Cerca negli script per "bar"

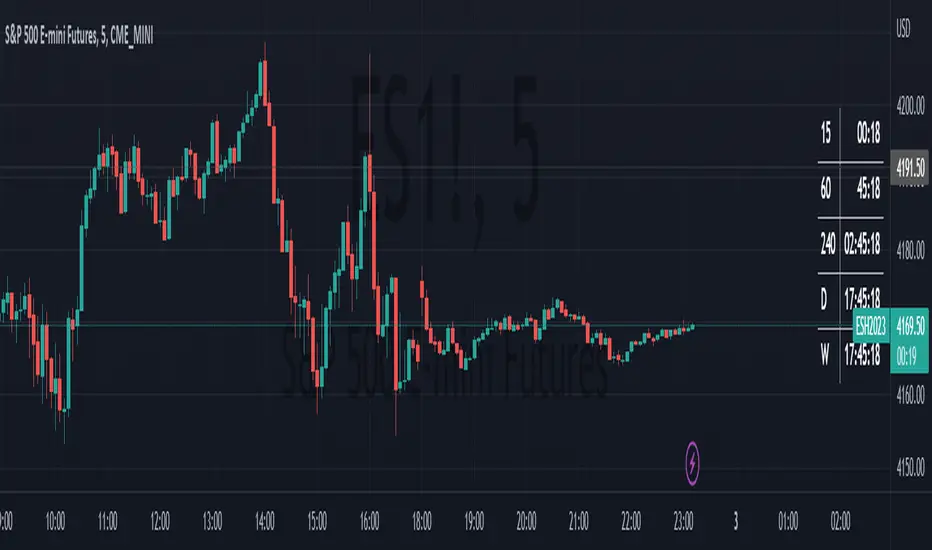
HTF Bar Close CountdownThis simple indicator displays a countdown for the amount of time left until a bar of your chosen timeframe closes.
Displays up to 5 different HTF countdowns.
Fully Customizable to fit any style, change the text colors, background colors, frame colors, display size and border & frame widths.
Flat display option for a sleek look to mesh with your charts.
Notes/Tips:
Higher Time Frames only! This is only intended to view HTF countdowns, will not work when trying to use a timeframe lower than your current chart's.
Some weird timeframes do not work, you'll know when.
Only works on live charts! Will display "Closed" when on an inactive chart.
Does not work for replay! A countdown is pretty pointless on a replay that is not real-time anyways...
Enjoy!
RSI Candle Advanced V2RSI Advanced
As the period value is longer than 14, the RSI value sticks to the value of 50 and becomes useless.
Also, when the period value is less than 14, it moves excessively, so it is difficult for us to see the movement of the RSI .
So, using the period value and the RSI value as variables, I tried to make it easier to identify the RSI value through a new function expression.
This is how RSI Advanced was developed.
Period below 14 reduce the volatility of RSI , and period above 14 increase the volatility of RSI, allowing overbought and oversold zones to work properly and give you a better view of the trend.
By applying the custom algorithm so that the 'RSI Advanced' with period on a 5-minute timeframe has the same value as the 'original RSI' with period on a 60-minute timeframe.
As another example, an 'RSI Advanced' with a period in a 60-minute time frame has the same value as an 'original RSI' with a period in a 240-minute time frame.
Compare the difference in the RSI with a period value of 200 in the snapshot.
------------------------------------------------------------------------------------------
RSI Candlestick
RSI derives its value using only the closing price as a variable.
I solved the RSI equation in reverse and tried to include the high and low prices of candlesticks in the equation.
As a result, 'if the high or low was the closing price, the value of RSI would be like this' was implemented.
Just like when a candle comes down after setting a high price, an upper tail is formed when RSI Candle goes down after setting a high price!!
In divergence, we had to look only at the relationship between closing prices, but if we use RSI candles, we can find divergences in highs and highs, and lows and lows.
Existing indicators could not express "gap", but Version 2 made it possible to express "gap"!!!!!!
RSI can be displayed as candlesticks, bars and lines
Then enjoy my RSI!
----------------------------------------------------------------------------------------
RSI Advanced
기간값이 14보다 길어질수록 RSI값은 50값에 달라붙게 되어서 쓸모가 없어집니다.
또 기간값이 14보다 줄어들수록 과도하게 움직여서 우리는 RSI의 움직임을 보기가 힘듭니다.
그래서 기간 값과 RSI 값을 변수로 사용하여 새로운 함수 식을 통해 RSI 값을 식별하기 편하도록 해보았습니다.
이렇게 RSI Advanced가 개발되었습니다.
기간값이 14보다 낮으면 rsi의 변동폭이 줄어들고, 기간값이 14보다 크면 변동폭이 넓어져 과매수 및 과매도 영역이 제대로 작동하여 추세를 더 잘 볼 수 있습니다.
또한 저는 5분 타임프레임의 기간값이 168(=14*12)인 RSI가 주기 값이 14인 60분 타임프레임의 RSI와 동일한 값을 갖도록 적절한 함수 표현식을 적용하여 RSI를 변경했습니다.
다른 예로, 15분 시간 프레임에서 기간값이 56(=14*4)인 RSI는 60분 시간 프레임의 기간값이 14인 RSI와 동일한 값을 갖습니다.
기간값이 200인 RSI의 차이를 스냅샷에서 비교해보십시오.
-----------------------------
RSI Candlestick
RSI는 종가만을 변수로 사용하여 값을 도출해냅니다.
저는 RSI 식을 역으로 풀어내어서 캔들스틱의 고가와 저가, 시가를 식에 포함시켜보았습니다.
결과적으로, '만약 고가나 저가가 종가였다면 RSI의 값이 이럴것이다'를 구현해내었습니다.
캔들이 고가를 찍고 내려오면 윗꼬리가 생기듯 RSI Candle에서도 고가를 찍고 내려오면 윗꼬리가 생기는겁니다!!
다이버전스 또한 원래는 종가끼리의 관계만 봐야했지만 RSI 캔들을 이용한다면 고가와 고가, 저가와 저가에서도 다이버전스를 발견할 수 있습니다.
기존의 지표는 "갭"을 표현하지 못했지만 Version 2 에서는 "갭"을 표현할 수 있게 만들었습니다!!!!!!
그럼 잘 사용해주십시오!!!

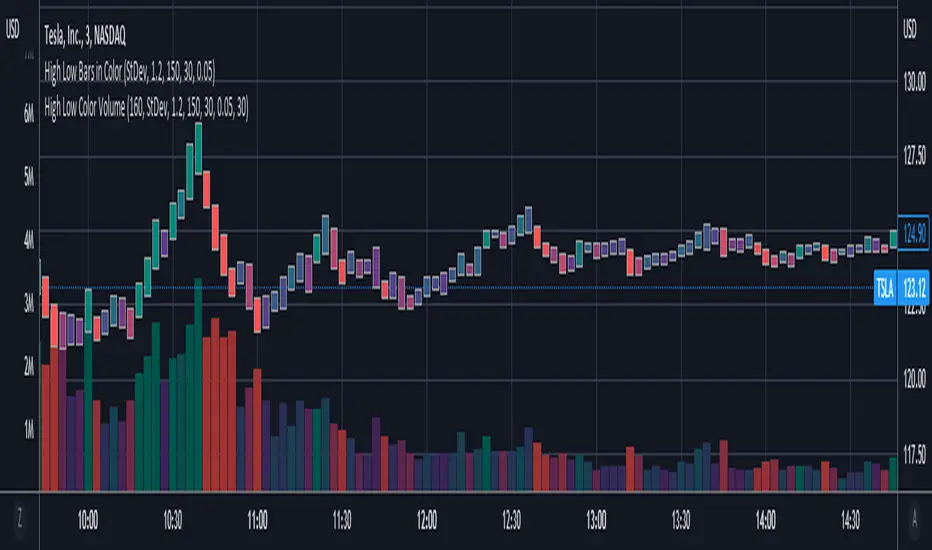
High Low Bars in ColorHigh Low bars de-emphasize open and close levels, but sacrifice color. Because traditional candles use open and close to determine color, a new approach was needed. This script uses change in midpoints between high and low ( hl2 ), with degrees of shading based on threshold levels in the settings. The default threshold is 1.2 standard deviations of the change in hl2 .
Optional "frosting" markers are available for open ("+") and close("x").
Best used in combination with High Low Color Volume .
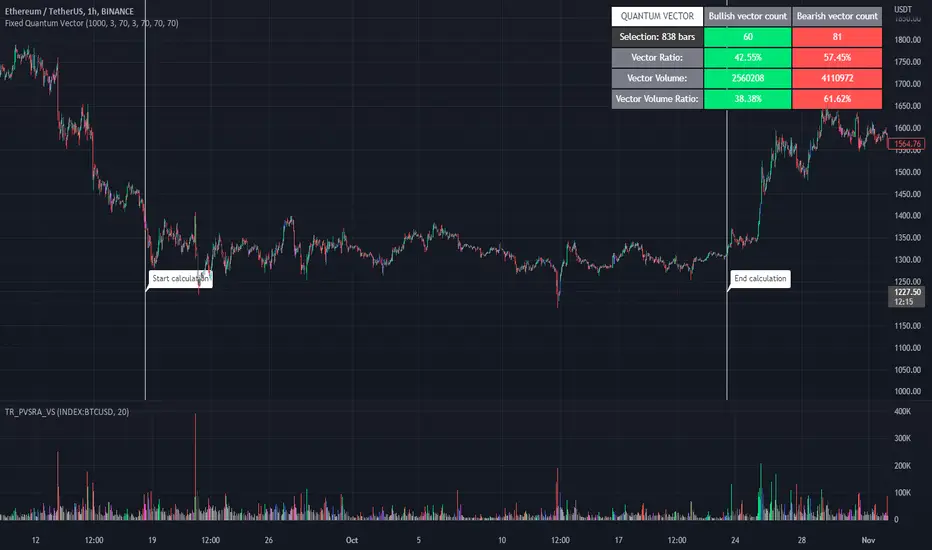
Fixed Quantum VectorSelect a zone to analyse the vectors.
This screener show the ratio of the bullish and bearish candle vector and on volume.
Slide the white bar to choose your sample size or you can enter the date.
Click label to hide start calculation and end calculation.
- Happy trading
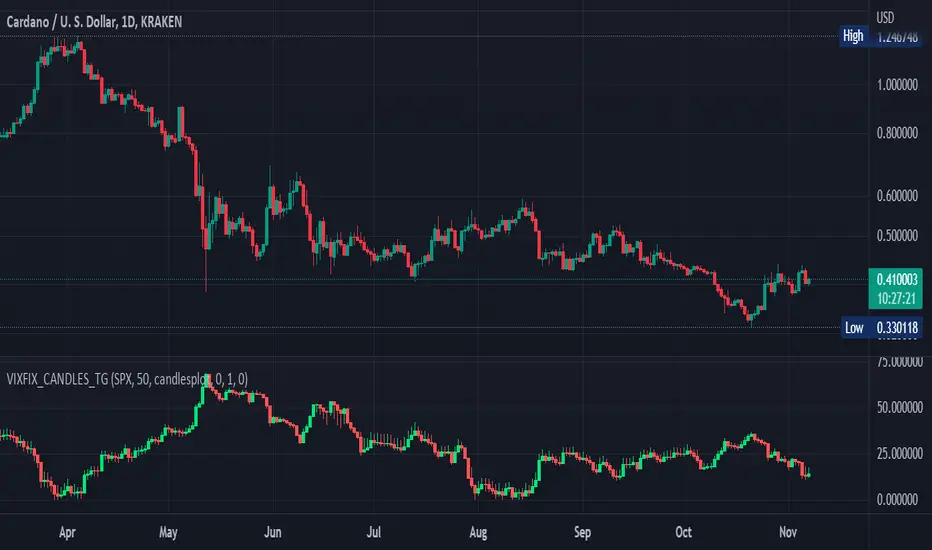
Williams Vix Fix OHLC candles plot indicator (Tartigradia)OHLC candles plot of the Williams VixFix indicator, which allows to draw trend lines.
Williams VixFix is a realized volatility indicator developed by Larry Williams, and can help in finding market bottoms.
Indeed, as Williams describe in his paper, markets tend to find the lowest prices during times of highest volatility, which usually accompany times of highest fear. The VixFix is calculated as how much the current low price statistically deviates from the maximum within a given look-back period.
The Williams VixFix indicator is usually presented as a curve or histogram. The novelty of this indicator is to present the data as a OHLC candles plot: whereas the original Williams VixFix calculation only involves the close value, we here use the open, high and low values as well. This led to some mathematical challenges because some of these calculations led to absurd values, so workarounds had to be found, but in the end I think the result was worth it, it reproduces the VIX chart quite well.
A great additional value of the OHLC chart is that it shows not just the close value, but all the values during the session: open, high and low in addition to close. This allows to draw trend lines and can provide additional information on momentum and sentiment. In addition, other indicators can be used on it, as if it was a price chart, such as RSI indicators (see RSI+ (alt) indicator for example).
For more information on the Vix Fix, which is a strategy published under public domain:
The VIX Fix, Larry Williams, Active Trader magazine, December 2007, web.archive.org
Fixing the VIX: An Indicator to Beat Fear, Amber Hestla-Barnhart, Journal of Technical Analysis, March 13, 2015, ssrn.com
Replicating the CBOE VIX using a synthetic volatility index trading algorithm, Dayne Cary and Gary van Vuuren, Cogent Economics & Finance, Volume 7, 2019, Issue 1, doi.org
This indicator includes only the Williams VixFix as an OHLC candles or bars plot, and price / vixfix candles plot, as well as the typical vixfix histogram. Indeed, it is much more practical for unbounded range indicators to be plotted in their own separate panel, hence why this indicator is released separately, so that it can work and be scaled adequately out of the box.
Note that the there are however no bottom buy signals. For a more complete indicator, which also includes the OHLC candles plots present here, but also bottom signals and Inverse VixFix (top signals), see:
Set Index symbol to SPX, and index_current = false, and timeframe Weekly, to reproduce the original VIX as close as possible by the VIXFIX (use the Add Symbol option, because you want to plot CBOE:VIX on the same timeframe as the current chart, which may include extended session / weekends). With the Weekly timeframe, off days / extended session days should not change much, but with lower timeframes this is important, because nights and weekends can change how the graph appears and seemingly make them different because of timing misalignment when in reality they are not when properly aligned.
MA Trend Bar [vnhilton]This indicator plots a bar that changes color when an uptrend/downtrend occurs as defined by a fast moving average being above/below a slow moving average respectively. This indicator can help spot crossovers easier, which may be hard to do via 2 moving average lines. This indicator supports different MA types & can be applied to any timeframe.

Market Sessions Day & Candles JRA V2.0Market Sessions Day & Candles JRA V2.0
This indicator will allow you to:
- Create boxes for the Market Hours for:
'♯1 SESSION TOKYO'
'♯2 SESSION LONDON'
'♯3 SESSION NEW YORK'
You will be able to change the Hours depending your TimeFrame
You will be able to extend the boxes for the Market Hours and Have Fibonacci Levels on it.
- With every one of it you can change the style of Box for the Market Hours
- You can show Labels for the Market hours as well other options like Price or Pips
- Show the Candles for the TimeFrames depending your settings
- You can change the Candles settings to be Candle or Bar
- Candle Resolution on Timeframe
-Maximum candles to Display
-Show or Unshown Timeframes Candles
-Change colors on candles
Every option has a Tip to understand the function to it

MTF Heikinashi BarOVERVIEW
This indicator shows whether Heikin Ashi is up or down, represented by a bar. This indicator is compatible with MTF.
CONCEPTS
What do you want to know about market analysis?
Do you want a hard analysis? You can look for it.
All I want to know is whether the commonly known technical analysis is 'UP' or 'DOWN'.
All I want to know is whether the current market price is going up or down. Not only for the current, but also for the monthly, weekly, and daily status.
I want to make a decision in a moment. Without even thinking about it.
That is why I created a color-coded bar indicator to show the status.
No need to frown anymore.
DETAILS
Heikin means average. Ashi means legs. In this case, it means a candle.
Close = (Close + Open + High + Low) / 4
For more information, click here.
tradingview.com
Heikin Ashi Up ⇒ green
Heikin Ashi Down ⇒ red

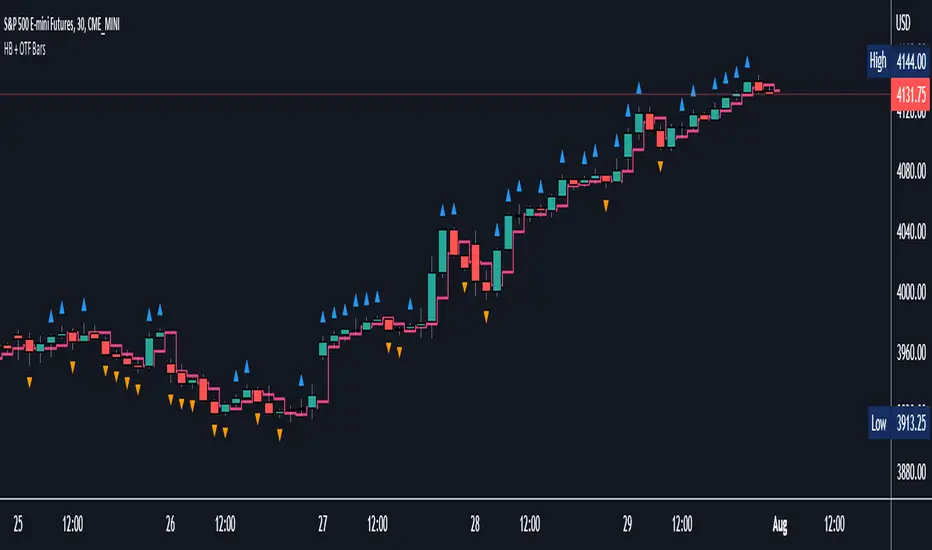
Halfback + One-Time-Framing BarsThis indicator is designed to be used with Market Profile / Volume Profile trading techniques on a 30min chart.
The halfback of a candle is the mid point between the high and the low of the candle. A halfback trade can be taken once price retraces into this point as support/resistance using the prevailing trend as your trade direction.
One-Time-Framing is a fancy term for trending in one direction. One-Time-Framing happens when a candle breaks the previous candle's high without testing the low or when a candle breaks the low of the previous candle without testing the high. This indicates that the trend is one directional and opposing pressure is very weak. Taking trades in the opposing direction of multiple OTF bars is typically a bad trade setup.
Halfback and OTF setups are typically used on a 30min timeframe combined with Market or Volume Profile, but you can experiment with these setups on any timeframe if you wish.
I hope you all enjoy this indicator, comment below if you have any questions.
Chervolinos_Rob Hoffman_Inventory Retracement Bar_and_OverlayHere is something like a combo from the well known Rob Hoffman (Overlay) Indicator and the Inventory Retracement Bar without any ballast
This really smart strategy with a low risk and a quick profit. I combine this two Indicators to save space.
The first condition is that the orange line and the lime line must be parallel and there is no other line between them because this condition is moving under 45 angle.
The second condition is that the target candles must be below the orange line in the case of the downtrend as we see.
As we see it here in the case of an uptrend should be candles above the orange line and this is logical as we see here.
Sometimes we noticed the appearance of the signal onto the candle but the conditions were not applicable because there is an orange line between the green line and the orange line and this means that the signal is fake.
This candle is also good for entry and we can place a buy order above it but is it beginner, so you must respect the conditions in order to be able to master it very well.
Enter with Confidence all conditions are present a red arrow above the candle and the candle is above the orange line and there are no lines between the lime and
orange line. Yes this is our target the entry-point will be a little above the wicked the candle, that is you will not buy now but it's a price exceeds the weight limit
even slightly, we will buy directly it is hoffman's method. Expected if the price in which resistance occurred which is the resistance represented
by the candlewick will be broken the price for rise up and strongly and if it does not happen you will not lose anything anyway to stop loss and take profit. Try the ratio by 1,5.
This part of this strategy is one of the best trading strategies with a low risk rate and can be used as an initial guide to know the market movement and to enter successful trades.
Let's start correctly. This strategy can be used on any time frame from one minute to one day or even more, but I recommend using it on a 10-minute frame one hour or 30 minutes frame. Here I use the 30-Minute frame.
This strategy is based on two things: Tramp Direction and the inventory retracement bar. Don't worry and don't think about it because all this will be automatic but let's understand some simple terms.
There many arrows in green and red. Please read the discription above.
Please read the following tipps:
To avoid the trend Reversal, try to add one one of the Divergence indicators to your chart.
To avoid entering in a pullback movement as much as possible.
--> Combine it with other indicators <--
Best Regards Chervolino
if there were any typographical errors, please forgive me
Note: Buy/Sell signals using non-standard chart types (Heikin Ashi, Renko, Kagi, Point & Figure, and Range) are not allowed, as they produce unrealistic results

chart visible bar timeWith the latest added features chart.left_visible_bar_time and chart.right_visible_bar_time it is now possible to
place label.new() positions at the equivalent of 'location.top' and 'location.bottom'
The following are examples of functions which enables to find the visible chart highest/lowest bars:
highest_visible_chart() =>
var float highs = na
highs := time == chart.left_visible_bar_time ? high :
time > chart.left_visible_bar_time and high > highs ? high : highs
lowest_visible_chart() =>
var float lows = na
lows := time == chart.left_visible_bar_time ? low :
time > chart.left_visible_bar_time and low < lows ? low : lows
In this example labels are plotted when a sma crosses another sma
Also combined with 3 boxes, scrolling gives insights how the features work
To all who make Tradingview the way it is, lots and lots of thanks!
Cheers!

MTF CCI BarOVERVIEW
This indicator shows whether Commodity Channel Index (CCI) is above or below 0, represented by a bar. This indicator is compatible with MTF.
CONCEPTS
What do you want to know about market analysis?
Do you want a hard analysis? You can look for it.
All I want to know is whether the commonly known technical analysis is 'UP' or 'DOWN'.
All I want to know is whether the current market price is going up or down. Not only for the current, but also for the monthly, weekly, and daily status.
I want to make a decision in a moment. Without even thinking about it.
That is why I created a color-coded bar indicator to show the status.
No need to frown anymore.
DETAILS
CCI is a momentum oscillator used in technical analysis primarily to identify overbought and oversold levels by measuring an instrument's variations away from its statistical mean. For this indicator, I have removed the concept of overbought and oversold.
0 <= CCI green
0 > CCI red
However, with future upgrades, I would like to color-code it for overbought and oversold conditions as well.

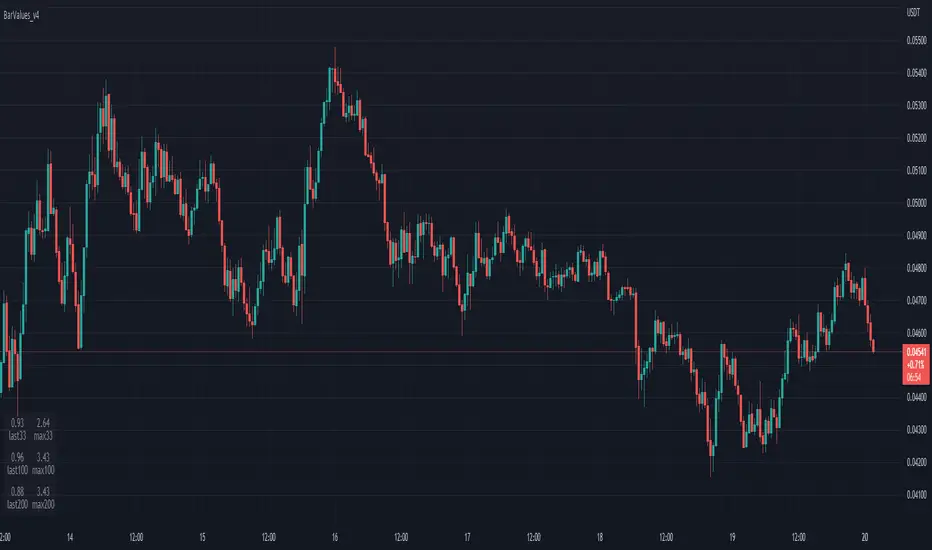
TableBarValues_v4It give you the absolute value of bar changes for different period of tims (33, 100, 200) AND the max barchange ont the same period.
Can be added in v4 in all codes. Stupid but useful.
You can add it to any v4 script. The location of the table can be changed easily
Inspired from the tradingview community. Don't forget to hydrate. @Magnumm
FiboBars ExtendedA trend indicator FiboBars Extended , the main purpose of which is to confirm the trend and cut off market noise. In his logic, he uses the Fibonacci sequence.
Two settings are used to account for noise suppression accuracy:
Period - number of calculation bars
Level - Fibonacci number selection

Wick Pressure/Close point inside the barCalculates the strength of closing within the bar. Higher the closing within the high/low points of the bar, greater is the buying strength and vice versa. HMA of the score for the input period is then divided by standard deviation for smoothing. Works well for higher timeframes with a larger data set. Compliments other indicators. Input period should be changed for various timeframes. Shorter the timeframe, the longer the input period is preferable.

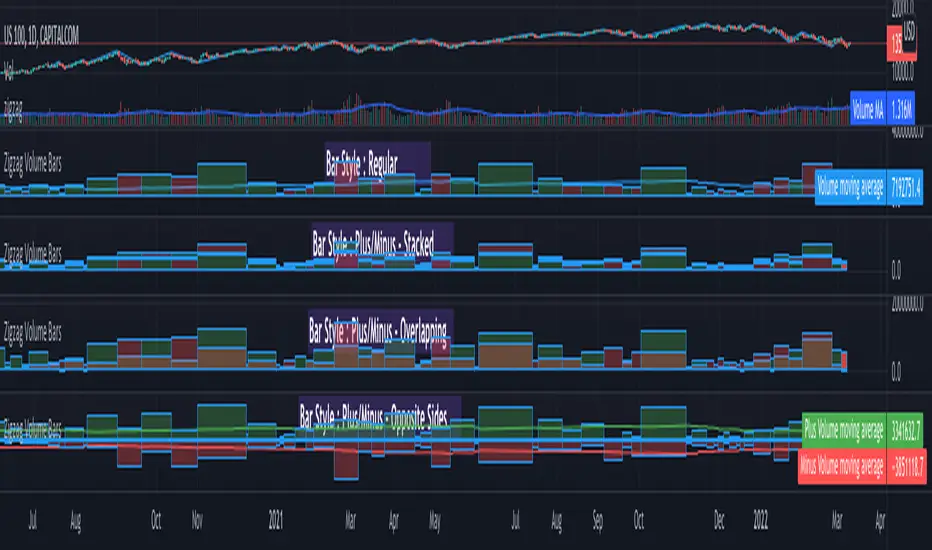
Zigzag Volume BarsBack to my favourite topic - Zigzags.
Here is an indicator which can help you visualise volume data on Zigzag swing highs and lows.
Settings are pretty simple and provides variety of display options
Display options are as demonstrated in the chart has following main types.
Regular
Plus/Minus - Stacked
Plus/Minus - Overlapping
Plus/Minus - Opposite Sides
Apart from the main display types, stacked display has several sub-types which determine whether to place green bar below red or the other way around.
Snapshot below shows example of each type.
Intraday Bar CountingAs a day-trader, revising is the most important habit.
This script adds numbers on intraday bars to help you revise and analyze patterns and your entries/exits. Great help!

MACD Bar 1.0 [upslidedown]MACD is one of the most consistent ways a trader can determine overall trend direction. In this script, I've simplified the traditional MACD histogram into a compact bar with trend change shapes (▲▼) when the MACD histogram goes under the zero line or above the zero line. With traditional MACD I often have to zoom in, wasting precious time. This indicator fixes that problem.
I use this script as a confirmation for other trigger signals, not as an entry or exit signal. I find this compact widget to be a preferable visualization of MACD on lower timeframes, while high timeframe analysis lends itself to the traditional MACD built-in with more data for decision making. This is also very useful when crafting trading strategies to quickly check for confluence of signals.
In addition to the traditional EMA smoothing that comes with MACD, I exposed a series of common moving average types. These include: SMA, EMA, WMA, RMA, SWMA, VWMA, Hull, TEMA, and ZLEMA. TEMA and ZLEMA are not standard builtins, but when looking for fast confirmation they can be very useful. They can also create LOTS of noise, so consider this wisely before changing the builtin methodology. One neat trick is to pair a "fast" version of this with fast moving average type and then a slow one using traditional EMA.
▲▼ signals = trend shift in direction of triangle
full color "bull or bear" color = strong trend
half color (semi-transparent) "bull or bear" color = weakening trend

SMI Ergodic Indicator Bar ColorsThis script simply displays bar colors corresponding to the SMI Ergodic Indicator. It does not display the oscillator or indicator itself. I prefer not to crowd my display with too many oscillators - others may find this script useful as well. Used in conjunction with other indicators, the SMII can give early reversal signals.
Thanks to the TV community.

Heikin Ashi Bar OverlayThis script shows Heikin Ashi bars on your chart with specified vertical offset
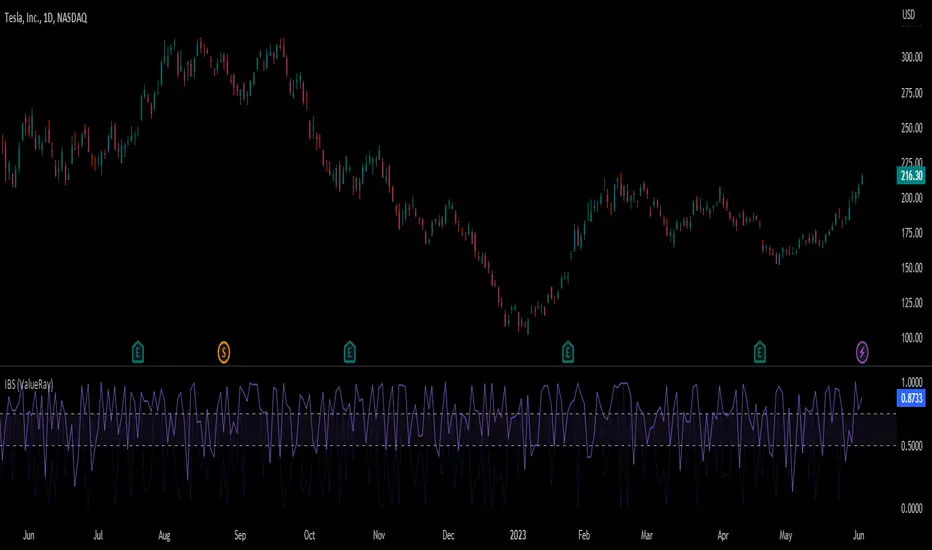
Internal Bar Strength (ValueRay)The IBS (Internal Bar Strength) as we know it, calculates only correctly on the long side. When the candle closes in loss, the original IBS still uses the upper wick.
This IBS checks first if its an up or down candle and then uses the top or bottom wick to calculate the IBS.
The yellow line is the corrected IBS, the blue line the original