Moon Phases Long/Short StrategyThis is an experiment of Moon Phases, likely buy when full moon and sell when new moon with few changes, like it would buy a day ahead or sometimes sell a day post these events, with Stop loss and take profits, 50% profitable so sounds good to me
Long only good for bitcoin gold, both modes(L+S) better for stocks and alt coins
Cerca negli script per "bitcoin"

BTC 5-MA Multi Cross Strategy By Hardik Prajapati Ai TradelabThis strategy is built around the five most powerful and commonly used moving averages in crypto trading — 5, 20, 50, 100, and 200-period SMAs (Simple Moving Averages) — applied on a 1-hour Bitcoin chart.
Core Idea:
The strategy aims to identify strong bullish trends by confirming when the price action crosses above all key moving averages. This alignment of multiple MAs indicates momentum shift and helps filter out false breakouts.
⸻
⚙️ How It Works:
1. Calculates 5 Moving Averages:
• 5 MA → Short-term momentum (fastest signal)
• 20 MA → Near-term trend confirmation
• 50 MA → Mid-term trend filter
• 100 MA → Long-term trend foundation
• 200 MA → Macro-trend direction (strongest support/resistance)
2. Buy Condition (Entry):
• A Buy is triggered when:
• The price crosses above the 5 MA, and
• The closing price remains above all other MAs (20, 50, 100, 200)
This signals that momentum is aligned across all time horizons — a strong uptrend confirmation.
3. Sell Condition (Exit):
• The position is closed when price crosses below the 20 MA, showing weakness in short-term momentum.
4. Visual Signals:
• 🟢 BUY triangle below candles → Entry signal
• 🔴 SELL triangle above candles → Exit signal
• Colored MAs plotted for trend clarity.
⸻
📈 Recommended Usage:
• Chart: BTC/USDT
• Timeframe: 1 Hour
• Type: Trend-following crossover strategy
• Ideal for: Identifying major breakout moves and confirming trend reversals.
⸻
⚠️ Notes:
• This script is meant for educational and backtesting purposes only.
• Always apply additional confirmation tools (like RSI, Volume, or VIX-style filters) before live trading.
• Works best during trending markets; may produce whipsaws in sideways zones.

Nirvana True Duel전략 이름
열반의 진검승부 (영문: Nirvana True Duel)
컨셉과 철학
“열반의 진검승부”는 시장 소음은 무시하고, 확실할 때만 진입하는 전략입니다.
EMA 리본으로 추세 방향을 확인하고, 볼린저 밴드 수축/확장으로 변동성 돌파를 포착하며, OBV로 거래량 확인을 통해 가짜 돌파를 필터링합니다.
전략 로직
매수 조건 (롱)
20EMA > 50EMA (상승 추세)
밴드폭 수축 후 확장 시작
종가가 상단 밴드 돌파
OBV 상승 흐름 유지
매도 조건 (숏)
20EMA < 50EMA (하락 추세)
밴드폭 수축 후 확장 시작
종가가 하단 밴드 이탈
OBV 하락 흐름 유지
진입·청산
손절: ATR × 1.5 배수
익절: 손절폭의 1.5~2배에서 부분 청산
시간 청산: 설정한 최대 보유 봉수 초과 시 강제 청산
장점
✅ 추세·변동성·거래량 3중 필터 → 노이즈 최소화
✅ 백테스트·알람 지원 → 기계적 매매 가능
✅ 5분/15분 차트에 적합 → 단타/스윙 트레이딩 활용 가능
주의점
⚠ 횡보장에서는 신호가 적거나 실패 가능
⚠ 수수료·슬리피지 고려 필요
📜 Nirvana True Duel — Strategy Description (English)
Name:
Nirvana True Duel (a.k.a. Nirvana Cross)
Concept & Philosophy
The “Nirvana True Duel” strategy focuses on trading only meaningful breakouts and avoiding unnecessary noise.
Nirvana: A calm, patient state — waiting for the right opportunity without emotional trading.
True Duel: When the signal appears, enter decisively and let the market reveal the outcome.
In short: “Ignore market noise, trade only high-probability breakouts.”
🧩 Strategy Components
Trend Filter (EMA Ribbon): Stay aligned with the main market trend.
Volatility Squeeze (Bollinger Band): Detect volatility contraction & expansion to catch explosive moves early.
Volume Confirmation (OBV): Filter out false breakouts by confirming with volume flow.
⚔️ Entry & Exit Conditions
Long Setup:
20 EMA > 50 EMA (uptrend)
BB width breaks out from recent squeeze
Close > Upper Bollinger Band
OBV shows positive flow
Short Setup:
20 EMA < 50 EMA (downtrend)
BB width breaks out from recent squeeze
Close < Lower Bollinger Band
OBV shows negative flow
Risk Management:
Stop Loss: ATR × 1.5 below/above entry
Take Profit: 1.5–2× stop distance, partial take-profit allowed
Time Stop: Automatically closes after max bars held (e.g. 8h on 5m chart)
✅ Strengths
Triple Filtering: Trend + Volatility + Volume → fewer false signals
Mechanical & Backtestable: Ideal for objective trading & performance validation
Adaptable: Works well on Bitcoin, Nasdaq futures, and other high-volatility markets (5m/15m)
⚠️ Things to Note
Low signal frequency or higher failure rate in sideways/range markets
Commission & slippage should be factored in, especially on lower timeframes
ATR multiplier and R:R ratio should be optimized per asset

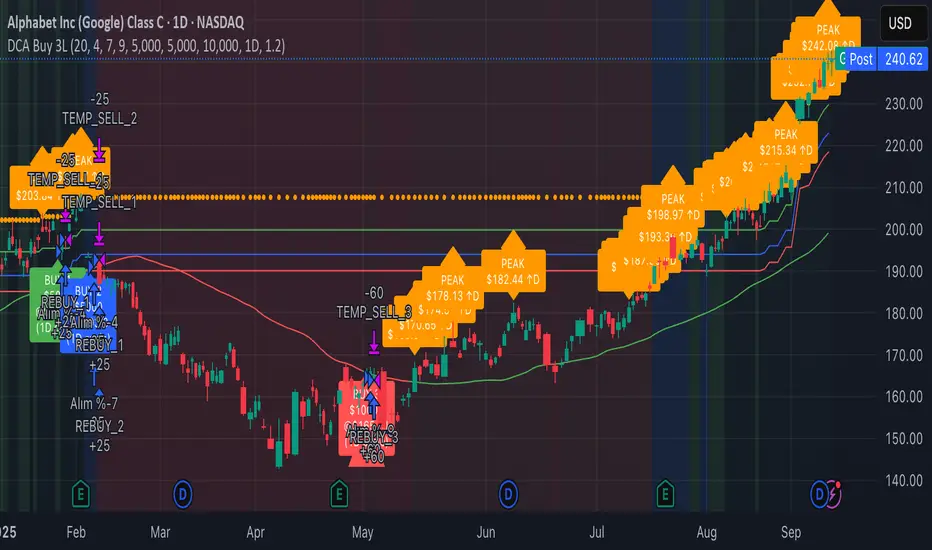
3-Level DCA Buy Strategy🎯 3-Level DCA Buy Strategy - Smart Dollar Cost Averaging
Professional DCA strategy that systematically accumulates positions during market dips. Enhanced with daily trend analysis for intelligent accumulation.
🚀 Key Features
- 3-Level Buying System: Automatic purchases at 5%, 10%, 15% drops from cycle highs
- Daily Trend Analysis: 1-day timeframe trend confirmation
- Smart Peak Detection: 100-period lookback for meaningful peaks
- Volume Filter: Optional volume confirmation system
- USD-Based Positions: Fixed dollar amounts per level
- Never Sells: Pure accumulation philosophy (buy-only)
📊 How It Works
1. Peak Identification: Detects highest price in last 100 periods
2. Daily Trend Check: Confirms price above 50 SMA on 1D timeframe
3. Drop Tracking: Calculates percentage drops from cycle high
4. Systematic Buying: Executes predetermined amounts at each level
5. Cycle Reset: Renews buy permissions when new peaks form
⚙️ Default Settings
- Buy Levels: 5%, 10%, 15% drops
- Position Sizes: $100, $150, $200
- Peak Period: 100 bars
- Higher Timeframe: 1 Day (1D)
- Pyramiding: 500 order capacity
🎨 Visual Elements
- Orange Circles: Mark cycle highs
- Colored Lines: Green/Blue/Red buy levels
- Triangle Signals: Buy point indicators
- Live Panel: Real-time statistics
- Background Colors: Trend and drop level indicators
🔔 Alert System
- Instant notifications for each buy level
- New peak detection alerts
- Major drop warnings (>20%)
- Daily trend change notifications
💡 Ideal Use Cases
- Crypto Accumulation: Bitcoin, Ethereum and major altcoins
- Stock DCA: Long-term portfolio building
- Volatile Markets: Capitalizing on price fluctuations
- Emotional Trading Prevention: Automated and disciplined buying
📈 Strategy Logic
This strategy follows the "buy the dip" philosophy. It waits during market rises and systematically builds positions during declines. Only buys when daily trend is bullish, providing protection during major bear markets.
⚠️ Important Notes
- Buy-only strategy - never sells positions
- Requires sufficient capital for multiple entries
- Most effective in trending and volatile markets
- Always backtest before live trading
- Risk management is your responsibility
🛠️ Customization Options
All parameters are fully customizable: drop percentages, position amounts, timeframes, visual elements and more. Suitable for both beginner and experienced investors.
🎯 Publishing Feature
Note: Strategy includes temporary 1-day sell cycle for TradingView publishing requirements. This feature can be disabled for normal DCA mode operation.
⭐ If you find this strategy helpful, please like and follow! Visit the profile for more trading tools.
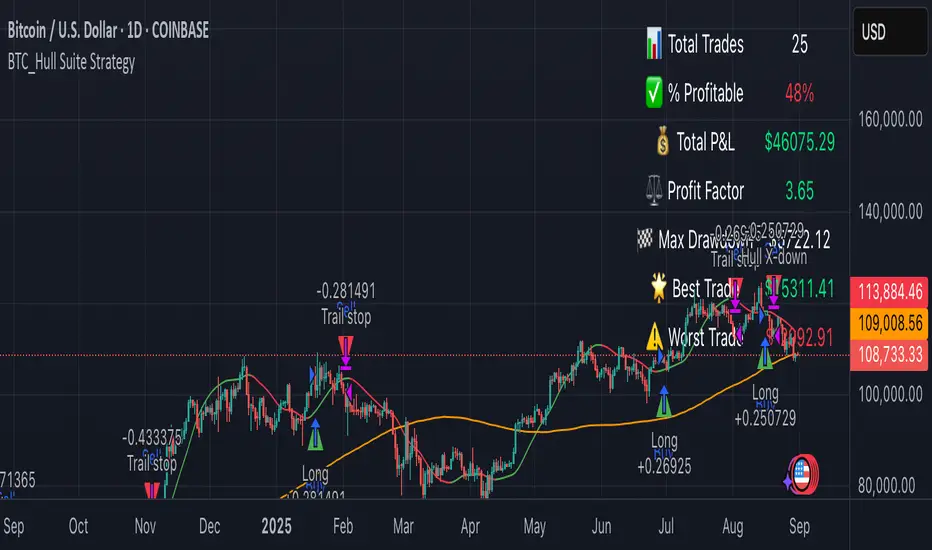
BTC_Hull Suite StrategyOverview
BTC_Hull Suite Strategy is a trend-following system designed to keep drawdowns modest while staying exposed during genuine uptrends. It uses the Hull Moving Average (HMA) for fast, low-lag trend turns, a long-term SMA filter to avoid chop, and a percentage trailing stop to protect gains.
🔧 What the strategy includes
- Hull Moving Average (HMA) with configurable length (default 55)
- SMA filter (default 130) to trade only with higher-timeframe bias
- Trailing stop in percent (default 5%) based on the running peak of close
- Execution model: signals are evaluated on the previous bar and entries are placed at the next bar’s open (TradingView default)
📈 How it works:
✅ Entry (Long):
Detects a bullish Hull turn by comparing the current HMA to its value 3 bars ago:
h > h3 and h <= h3 → HMA just turned up on the prior bar
The SMA filter must confirm: close > sma
If both are true (and within the date window), a long is opened next bar at the open
❌ Exit:
Hull turn down: h < h3 and h >= h3 , or
Trailing stop: price closes below peak * (1 – trailingPct)
Either condition closes the position at the current bar’s close
Notes:
pyramiding = 1 → allows one add-on (maximum two concurrent long positions)
Position sizing defaults to 20% of equity per entry (adjustable in Properties)
Who is this for?
This strategy is tailored for Bitcoin traders (spot or perpetuals) who want a rules-based, low-lag trend system with built-in drawdown protection.
It works best on Daily or 4H charts, but parameters can be adapted for other timeframes.
⚠️ Disclaimer
This strategy is provided for educational and research purposes only.
It is not financial advice. Markets are risky — always test on your own data, include realistic fees/slippage, and forward-test before using real capital.
AltCoin & MemeCoin Index Correlation [Eddie_Bitcoin]🧠 Philosophy of the Strategy
The AltCoin & MemeCoin Index Correlation Strategy by Eddie_Bitcoin is a carefully engineered trend-following system built specifically for the highly volatile and sentiment-driven world of altcoins and memecoins.
This strategy recognizes that crypto markets—especially niche sectors like memecoins—are not only influenced by individual price action but also by the relative strength or weakness of their broader sector. Hence, it attempts to improve the reliability of trading signals by requiring alignment between a specific coin’s trend and its sector-wide index trend.
Rather than treating each crypto asset in isolation, this strategy dynamically incorporates real-time dominance metrics from custom indices (OTHERS.D and MEME.D) and combines them with local price action through dual exponential moving average (EMA) crossovers. Only when both the asset and its sector are moving in the same direction does it allow for trade entries—making it a confluence-based system rather than a single-signal strategy.
It supports risk-aware capital allocation, partial exits, configurable stop loss and take profit levels, and a scalable equity-compounding model.
✅ Why did I choose OTHERS.D and MEME.D as reference indices?
I selected OTHERS.D and MEME.D because they offer a sector-focused view of crypto market dynamics, especially relevant when trading altcoins and memecoins.
🔹 OTHERS.D tracks the market dominance of all cryptocurrencies outside the top 10 by market cap.
This excludes not only BTC and ETH, but also major stablecoins like USDT and USDC, making it a cleaner indicator of risk appetite across true altcoins.
🔹 This is particularly useful for detecting "Altcoin Season"—periods where capital rotates away from Bitcoin and flows into smaller-cap coins.
A rising OTHERS.D often signals the start of broader altcoin rallies.
🔹 MEME.D, on the other hand, captures the speculative behavior of memecoin segments, which are often driven by retail hype and social media activity.
It's perfect for timing momentum shifts in high-risk, high-reward tokens.
By using these indices, the strategy aligns entries with broader sector trends, filtering out noise and increasing the probability of catching true directional moves, especially in phases of capital rotation and altcoin risk-on behavior.
📐 How It Works — Core Logic and Execution Model
At its heart, this strategy employs dual EMA crossover detection—one pair for the asset being traded and one pair for the selected market index.
A trade is only executed when both EMA crossovers agree on the direction. For example:
Long Entry: Coin's fast EMA > slow EMA and Index's fast EMA > slow EMA
Short Entry: Coin's fast EMA < slow EMA and Index's fast EMA < slow EMA
You can disable the index filter and trade solely based on the asset’s trend just to make a comparison and see if improves a classic EMA crossover strategy.
Additionally, the strategy includes:
- Adaptive position sizing, based on fixed capital or current equity (compound mode)
- Take Profit and Stop Loss in percentage terms
- Smart partial exits when trend momentum fades
- Date filtering for precise backtesting over specific timeframes
- Real-time performance stats, equity tracking, and visual cues on chart
⚙️ Parameters & Customization
🔁 EMA Settings
Each EMA pair is customizable:
Coin Fast EMA: Default = 47
Coin Slow EMA: Default = 50
Index Fast EMA: Default = 47
Index Slow EMA: Default = 50
These control the sensitivity of the trend detection. A wider spread gives smoother, slower entries; a narrower spread makes it more responsive.
🧭 Index Reference
The correlation mechanism uses CryptoCap sector dominance indexes:
OTHERS.D: Dominance of all coins EXCLUDING Top 10 ones
MEME.D: Dominance of all Meme coins
These are dynamically calculated using:
OTHERS_D = OTHERS_cap / TOTAL_cap * 100
MEME_D = MEME_cap / TOTAL_cap * 100
You can select:
Reference Index: OTHERS.D or MEME.D
Or disable the index reference completely (Don't Use Index Reference)
💰 Position Sizing & Risk Management
Two capital allocation models are supported:
- Fixed % of initial capital (default)
- Compound profits, which scales positions as equity grows
Settings:
- Compound profits?: true/false
- % of equity: Between 1% and 200% (default = 10%)
This is critical for users who want to balance growth with risk.
🎯 Take Profit / Stop Loss
Customizable thresholds determine automatic exits:
- TakeProfit: Default = 99999 (disabled)
- StopLoss: Default = 5 (%)
These exits are percentage-based and operate off the entry price vs. current close.
📉 Trend Weakening Exit (Scale Out)
If the position is in profit but the trend weakens (e.g., EMA color signals trend loss), the strategy can partially close a configurable portion of the position:
- Scale Position on Weak Trend?: true/false
- Scaled Percentage: % to close (default = 65%)
This feature is useful for preserving profits without exiting completely.
📆 Date Filter
Useful for segmenting performance over specific timeframes (e.g., bull vs bear markets):
- Filter Date Range of Backtest: ON/OFF
- Start Date and End Date: Custom time range
OTHER PARAMETERS EXPLANATION (Strategy "Properties" Tab):
- Initial Capital is set to 100 USD
- Commission is set to 0.055% (The ones I have on Bybit)
- Slippage is set to 3 ticks
- Margin (short and long) are set to 0.001% to avoid "overspending" your initial capital allocation
📊 Visual Feedback and Debug Tools
📈 EMA Trend Visualization
The slow EMA line is dynamically color-coded to visually display the alignment between the asset trend and the index trend:
Lime: Coin and index both bullish
Teal: Only coin bullish
Maroon: Only index bullish
Red: Both bearish
This allows for immediate visual confirmation of current trend strength.
💬 Real-Time PnL Labels
When a trade closes, a label shows:
Previous trade return in % (first value is the effective PL)
Green background for profit, Red for losses.
📑 Summary Table Overlay
This table appears in a corner of the chart (user-defined) and shows live performance data including:
Trade direction (yellow long, purple short)
Emojis: 💚 for current profit, 😡 for current loss
Total number of trades
Win rate
Max drawdown
Duration in days
Current trade profit/loss (absolute and %)
Cumulative PnL (absolute and %)
APR (Annualized Percentage Return)
Each metric is color-coded:
Green for strong results
Yellow/orange for average
Red/maroon for poor performance
You can select where this appears:
Top Left
Top Right
Bottom Left
Bottom Right (default)
📚 Interpretation of Key Metrics
Equity Multiplier: How many times initial capital has grown (e.g., “1.75x”)
Net Profit: Total gains including open positions
Max Drawdown: Largest peak-to-valley drop in strategy equity
APR: Annualized return calculated based on equity growth and days elapsed
Win Rate: % of profitable trades
PnL %: Percentage profit on the most recent trade
🧠 Advanced Logic & Safety Features
🛑 “Don’t Re-Enter” Filter
If a trade is closed due to StopLoss without a confirmed reversal, the strategy avoids re-entering in that same direction until conditions improve. This prevents false reversals and repetitive losses in sideways markets.
🧷 Equity Protection
No new trades are initiated if equity falls below initial_capital / 30. This avoids overleveraging or continuing to trade when capital preservation is critical.
Keep in mind that past results in no way guarantee future performance.
Eddie Bitcoin

Mutanabby_AI | Algo Pro Strategy# Mutanabby_AI | Algo Pro Strategy: Advanced Candlestick Pattern Trading System
## Strategy Overview
The Mutanabby_AI Algo Pro Strategy represents a systematic approach to automated trading based on advanced candlestick pattern recognition and multi-layered technical filtering. This strategy transforms traditional engulfing pattern analysis into a comprehensive trading system with sophisticated risk management and flexible position sizing capabilities.
The strategy operates on a long-only basis, entering positions when bullish engulfing patterns meet specific technical criteria and exiting when bearish engulfing patterns indicate potential trend reversals. The system incorporates multiple confirmation layers to enhance signal reliability while providing comprehensive customization options for different trading approaches and risk management preferences.
## Core Algorithm Architecture
The strategy foundation relies on bullish and bearish engulfing candlestick pattern recognition enhanced through technical analysis filtering mechanisms. Entry signals require simultaneous satisfaction of four distinct criteria: confirmed bullish engulfing pattern formation, candle stability analysis indicating decisive price action, RSI momentum confirmation below specified thresholds, and price decline verification over adjustable lookback periods.
The candle stability index measures the ratio between candlestick body size and total range including wicks, ensuring only well-formed patterns with clear directional conviction generate trading signals. This filtering mechanism eliminates indecisive market conditions where pattern reliability diminishes significantly.
RSI integration provides momentum confirmation by requiring oversold conditions before entry signal generation, ensuring alignment between pattern formation and underlying momentum characteristics. The RSI threshold remains fully adjustable to accommodate different market conditions and volatility environments.
Price decline verification examines whether current prices have decreased over a specified period, confirming that bullish engulfing patterns occur after meaningful downward movement rather than during sideways consolidation phases. This requirement enhances the probability of successful reversal pattern completion.
## Advanced Position Management System
The strategy incorporates dual position sizing methodologies to accommodate different account sizes and risk management approaches. Percentage-based position sizing calculates trade quantities as equity percentages, enabling consistent risk exposure across varying account balances and market conditions. This approach proves particularly valuable for systematic trading approaches and portfolio management applications.
Fixed quantity sizing provides precise control over trade sizes independent of account equity fluctuations, offering predictable position management for specific trading strategies or when implementing precise risk allocation models. The system enables seamless switching between sizing methods through simple configuration adjustments.
Position quantity calculations integrate seamlessly with TradingView's strategy testing framework, ensuring accurate backtesting results and realistic performance evaluation across different market conditions and time periods. The implementation maintains consistency between historical testing and live trading applications.
## Comprehensive Risk Management Framework
The strategy features dual stop loss methodologies addressing different risk management philosophies and market analysis approaches. Entry price-based stop losses calculate stop levels as fixed percentages below entry prices, providing predictable risk exposure and consistent risk-reward ratio maintenance across all trades.
The percentage-based stop loss system enables precise risk control by limiting maximum loss per trade to predetermined levels regardless of market volatility or entry timing. This approach proves essential for systematic trading strategies requiring consistent risk parameters and capital preservation during adverse market conditions.
Lowest low-based stop losses identify recent price support levels by analyzing minimum prices over adjustable lookback periods, placing stops below these technical levels with additional buffer percentages. This methodology aligns stop placement with market structure rather than arbitrary percentage calculations, potentially improving stop loss effectiveness during normal market fluctuations.
The lookback period adjustment enables optimization for different timeframes and market characteristics, with shorter periods providing tighter stops for active trading and longer periods offering broader stops suitable for position trading approaches. Buffer percentage additions ensure stops remain below obvious support levels where other market participants might place similar orders.
## Visual Customization and Interface Design
The strategy provides comprehensive visual customization through eight predefined color schemes designed for different chart backgrounds and personal preferences. Color scheme options include Classic bright green and red combinations, Ocean themes featuring blue and orange contrasts, Sunset combinations using gold and crimson, and Neon schemes providing high visibility through bright color selections.
Professional color schemes such as Forest, Royal, and Fire themes offer sophisticated alternatives suitable for business presentations and professional trading environments. The Custom color scheme enables precise color selection through individual color picker controls, maintaining maximum flexibility for specific visual requirements.
Label styling options accommodate different chart analysis preferences through text bubble, triangle, and arrow display formats. Size adjustments range from tiny through huge settings, ensuring appropriate visual scaling across different screen resolutions and chart configurations. Text color customization maintains readability across various chart themes and background selections.
## Signal Quality Enhancement Features
The strategy incorporates signal filtering mechanisms designed to eliminate repetitive signal generation during choppy market conditions. The disable repeating signals option prevents consecutive identical signals until opposing conditions occur, reducing overtrading during consolidation phases and improving overall signal quality.
Signal confirmation requirements ensure all technical criteria align before trade execution, reducing false signal occurrence while maintaining reasonable trading frequency for active strategies. The multi-layered approach balances signal quality against opportunity frequency through adjustable parameter optimization.
Entry and exit visualization provides clear trade identification through customizable labels positioned at relevant price levels. Stop loss visualization displays active risk levels through colored line plots, ensuring complete transparency regarding current risk management parameters during live trading operations.
## Implementation Guidelines and Optimization
The strategy performs effectively across multiple timeframes with optimal results typically occurring on intermediate timeframes ranging from fifteen minutes through four hours. Higher timeframes provide more reliable pattern formation and reduced false signal occurrence, while lower timeframes increase trading frequency at the expense of some signal reliability.
Parameter optimization should focus on RSI threshold adjustments based on market volatility characteristics and candlestick pattern timeframe analysis. Higher RSI thresholds generate fewer but potentially higher quality signals, while lower thresholds increase signal frequency with corresponding reliability considerations.
Stop loss method selection depends on trading style preferences and market analysis philosophy. Entry price-based stops suit systematic approaches requiring consistent risk parameters, while lowest low-based stops align with technical analysis methodologies emphasizing market structure recognition.
## Performance Considerations and Risk Disclosure
The strategy operates exclusively on long positions, making it unsuitable for bear market conditions or extended downtrend periods. Users should consider market environment analysis and broader trend assessment before implementing the strategy during adverse market conditions.
Candlestick pattern reliability varies significantly across different market conditions, with higher reliability typically occurring during trending markets compared to ranging or volatile conditions. Strategy performance may deteriorate during periods of reduced pattern effectiveness or increased market noise.
Risk management through stop loss implementation remains essential for capital preservation during adverse market movements. The strategy does not guarantee profitable outcomes and requires proper position sizing and risk management to prevent significant capital loss during unfavorable trading periods.
## Technical Specifications
The strategy utilizes standard TradingView Pine Script functions ensuring compatibility across all supported instruments and timeframes. Default configuration employs 14-period RSI calculations, adjustable candle stability thresholds, and customizable price decline verification periods optimized for general market conditions.
Initial capital settings default to $10,000 with percentage-based equity allocation, though users can adjust these parameters based on account size and risk tolerance requirements. The strategy maintains detailed trade logs and performance metrics through TradingView's integrated backtesting framework.
Alert integration enables real-time notification of entry and exit signals, stop loss executions, and other significant trading events. The comprehensive alert system supports automated trading applications and manual trade management approaches through detailed signal information provision.
## Conclusion
The Mutanabby_AI Algo Pro Strategy provides a systematic framework for candlestick pattern trading with comprehensive risk management and position sizing flexibility. The strategy's strength lies in its multi-layered confirmation approach and sophisticated customization options, enabling adaptation to various trading styles and market conditions.
Successful implementation requires understanding of candlestick pattern analysis principles and appropriate parameter optimization for specific market characteristics. The strategy serves traders seeking automated execution of proven technical analysis techniques while maintaining comprehensive control over risk management and position sizing methodologies.

[Stratégia] VWAP Mean Magnet v9 (Simple Alert)This strategy is specifically designed for a ranging (sideways-moving) Bitcoin market.
A trade is only opened and signaled on the chart if all three of the following conditions are met simultaneously at the close of a candle:
Zone Entry
The price must cross into the signal zone: the red band for a Short (sell) position, or the green band for a Long (buy) position.
RSI Confirmation
The RSI indicator must also confirm the signal. For a Short, it must go above 65 (overbought condition). For a Long, it must fall below 25 (oversold condition).
Volume Filter
The volume on the entry candle cannot be excessively high. This safety filter is designed to prevent trades during risky, high-momentum breakouts.

BTC 1m Chop Top/Bottom Reversal (Stable Entries)Strategy Description: BTC 5m Chop Top/Bottom Reversal (Stable Entries)
This strategy is engineered to capture precise reversal points during Bitcoin’s choppy or sideways price action on the 5-minute timeframe. It identifies short-term tops and bottoms using a confluence of volatility bands, momentum indicators, and price structure, optimized for high-probability scalping and intraday reversals.
Core Logic:
Volatility Filter: Uses an EMA with ATR bands to define overextended price zones.
Momentum Divergence: Confirms reversals using RSI and MACD histogram shifts.
Price Action Filter: Requires candle confirmation in the direction of the trade.
Locked Signal Logic: Prevents repaints and disappearing trades by confirming signals only once per bar.
Trade Parameters:
Short Entry: Above upper band + overbought RSI + weakening MACD + bearish candle
Long Entry: Below lower band + oversold RSI + strengthening MACD + bullish candle
Take Profit: ±0.75%
Stop Loss: ±0.4%
This setup is tuned for traders using tight risk control and leverage, where execution precision and minimal drawdown tolerance are critical.

Multi-Confluence Swing Hunter V1# Multi-Confluence Swing Hunter V1 - Complete Description
Overview
The Multi-Confluence Swing Hunter V1 is a sophisticated low timeframe scalping strategy specifically optimized for MSTR (MicroStrategy) trading. This strategy employs a comprehensive point-based scoring system that combines optimized technical indicators, price action analysis, and reversal pattern recognition to generate precise trading signals on lower timeframes.
Performance Highlight:
In backtesting on MSTR 5-minute charts, this strategy has demonstrated over 200% profit performance, showcasing its effectiveness in capturing rapid price movements and volatility patterns unique to MicroStrategy's trading behavior.
The strategy's parameters have been fine-tuned for MSTR's unique volatility characteristics, though they can be optimized for other high-volatility instruments as well.
## Key Innovation & Originality
This strategy introduces a unique **dual scoring system** approach:
- **Entry Scoring**: Identifies swing bottoms using 13+ different technical criteria
- **Exit Scoring**: Identifies swing tops using inverse criteria for optimal exit timing
Unlike traditional strategies that rely on simple indicator crossovers, this system quantifies market conditions through a weighted scoring mechanism, providing objective, data-driven entry and exit decisions.
## Technical Foundation
### Optimized Indicator Parameters
The strategy utilizes extensively backtested parameters specifically optimized for MSTR's volatility patterns:
**MACD Configuration (3,10,3)**:
- Fast EMA: 3 periods (vs standard 12)
- Slow EMA: 10 periods (vs standard 26)
- Signal Line: 3 periods (vs standard 9)
- **Rationale**: These faster parameters provide earlier signal detection while maintaining reliability, particularly effective for MSTR's rapid price movements and high-frequency volatility
**RSI Configuration (21-period)**:
- Length: 21 periods (vs standard 14)
- Oversold: 30 level
- Extreme Oversold: 25 level
- **Rationale**: The 21-period RSI reduces false signals while still capturing oversold conditions effectively in MSTR's volatile environment
**Parameter Adaptability**: While optimized for MSTR, these parameters can be adjusted for other high-volatility instruments. Faster-moving stocks may benefit from even shorter MACD periods, while less volatile assets might require longer periods for optimal performance.
### Scoring System Methodology
**Entry Score Components (Minimum 13 points required)**:
1. **RSI Signals** (max 5 points):
- RSI < 30: +2 points
- RSI < 25: +2 points
- RSI turning up: +1 point
2. **MACD Signals** (max 8 points):
- MACD below zero: +1 point
- MACD turning up: +2 points
- MACD histogram improving: +2 points
- MACD bullish divergence: +3 points
3. **Price Action** (max 4 points):
- Long lower wick (>50%): +2 points
- Small body (<30%): +1 point
- Bullish close: +1 point
4. **Pattern Recognition** (max 8 points):
- RSI bullish divergence: +4 points
- Quick recovery pattern: +2 points
- Reversal confirmation: +4 points
**Exit Score Components (Minimum 13 points required)**:
Uses inverse criteria to identify swing tops with similar weighting system.
## Risk Management Features
### Position Sizing & Risk Control
- **Single Position Strategy**: 100% equity allocation per trade
- **No Overlapping Positions**: Ensures focused risk management
- **Configurable Risk/Reward**: Default 5:1 ratio optimized for volatile assets
### Stop Loss & Take Profit Logic
- **Dynamic Stop Loss**: Based on recent swing lows with configurable buffer
- **Risk-Based Take Profit**: Calculated using risk/reward ratio
- **Clean Exit Logic**: Prevents conflicting signals
## Default Settings Optimization
### Key Parameters (Optimized for MSTR/Bitcoin-style volatility):
- **Minimum Entry Score**: 13 (ensures high-conviction entries)
- **Minimum Exit Score**: 13 (prevents premature exits)
- **Risk/Reward Ratio**: 5.0 (accounts for volatility)
- **Lower Wick Threshold**: 50% (identifies true hammer patterns)
- **Divergence Lookback**: 8 bars (optimal for swing timeframes)
### Why These Defaults Work for MSTR:
1. **Higher Score Thresholds**: MSTR's volatility requires more confirmation
2. **5:1 Risk/Reward**: Compensates for wider stops needed in volatile markets
3. **Faster MACD**: Captures momentum shifts quickly in fast-moving stocks
4. **21-period RSI**: Reduces noise while maintaining sensitivity
## Visual Features
### Score Display System
- **Green Labels**: Entry scores ≥10 points (below bars)
- **Red Labels**: Exit scores ≥10 points (above bars)
- **Large Triangles**: Actual trade entries/exits
- **Small Triangles**: Reversal pattern confirmations
### Chart Cleanliness
- Indicators plotted in separate panes (MACD, RSI)
- TP/SL levels shown only during active positions
- Clear trade markers distinguish signals from actual trades
## Backtesting Specifications
### Realistic Trading Conditions
- **Commission**: 0.1% per trade
- **Slippage**: 3 points
- **Initial Capital**: $1,000
- **Account Type**: Cash (no margin)
### Sample Size Considerations
- Strategy designed for 100+ trade sample sizes
- Recommended timeframes: 4H, 1D for swing trading
- Optimal for trending/volatile markets
## Strategy Limitations & Considerations
### Market Conditions
- **Best Performance**: Trending markets with clear swings
- **Reduced Effectiveness**: Highly choppy, sideways markets
- **Volatility Dependency**: Optimized for moderate to high volatility assets
### Risk Warnings
- **High Allocation**: 100% position sizing increases risk
- **No Diversification**: Single position strategy
- **Backtesting Limitation**: Past performance doesn't guarantee future results
## Usage Guidelines
### Recommended Assets & Timeframes
- **Primary Target**: MSTR (MicroStrategy) - 5min to 15min timeframes
- **Secondary Targets**: High-volatility stocks (TSLA, NVDA, COIN, etc.)
- **Crypto Markets**: Bitcoin, Ethereum (with parameter adjustments)
- **Timeframe Optimization**: 1min-15min for scalping, 30min-1H for swing scalping
### Timeframe Recommendations
- **Primary Scalping**: 5-minute and 15-minute charts
- **Active Monitoring**: 1-minute for precise entries
- **Swing Scalping**: 30-minute to 1-hour timeframes
- **Avoid**: Sub-1-minute (excessive noise) and above 4-hour (reduces scalping opportunities)
## Technical Requirements
- **Pine Script Version**: v6
- **Overlay**: Yes (plots on price chart)
- **Additional Panes**: MACD and RSI indicators
- **Real-time Compatibility**: Confirmed bar signals only
## Customization Options
All parameters are fully customizable through inputs:
- Indicator lengths and levels
- Scoring thresholds
- Risk management settings
- Visual display preferences
- Date range filtering
## Conclusion
This scalping strategy represents a comprehensive approach to low timeframe trading that combines multiple technical analysis methods into a cohesive, quantified system specifically optimized for MSTR's unique volatility characteristics. The optimized parameters and scoring methodology provide a systematic way to identify high-probability scalping setups while managing risk effectively in fast-moving markets.
The strategy's strength lies in its objective, multi-criteria approach that removes emotional decision-making from scalping while maintaining the flexibility to adapt to different instruments through parameter optimization. While designed for MSTR, the underlying methodology can be fine-tuned for other high-volatility assets across various markets.
**Important Disclaimer**: This strategy is designed for experienced scalpers and is optimized for MSTR trading. The high-frequency nature of scalping involves significant risk. Past performance does not guarantee future results. Always conduct your own analysis, consider your risk tolerance, and be aware of commission/slippage costs that can significantly impact scalping profitability.

[Mustang Algo] Channel Strategy# Mustang Algo Channel Strategy - Universal Market Sentiment Oscillator
## 🎯 ORIGINAL CONCEPT
This strategy employs a unique market sentiment oscillator that works on ALL financial assets. It uses Bitcoin supply dynamics combined with stablecoin market capitalization as a macro sentiment indicator to generate universal timing signals across stocks, forex, commodities, indices, and cryptocurrencies.
## 🌐 UNIVERSAL APPLICATION
- **Any Asset Class:** Stocks, Forex, Commodities, Indices, Crypto, Bonds
- **Market-Wide Timing:** BTC/Stablecoin ratio serves as a global risk sentiment gauge
- **Cross-Market Signals:** Trade any instrument using macro liquidity conditions
- **Ecosystem Approach:** One oscillator for all financial markets
## 🧮 METHODOLOGY
**Core Calculation:** BTC Supply / (Combined Stablecoin Market Cap / BTC Price)
- **Data Sources:** DAI + USDT + USDC market capitalizations
- **Signal Generation:** RSI(14) applied to the ratio, double-smoothed with WMA
- **Timing Logic:** Crossover signals filtered by overbought/oversold zones
- **Multi-Timeframe:** Configurable timeframe analysis (default: Daily)
## 📈 TRADING STRATEGY
**LONG Entries:** Bullish crossover when market sentiment is oversold (<48)
**SHORT Entries:** Bearish crossover when market sentiment is overbought (>55)
**Universal Timing:** These macro signals apply to trading any financial instrument
## ⚙️ FLEXIBLE RISK MANAGEMENT
**Three SL/TP Calculation Modes:**
- **Percentage Mode:** Traditional % based (4% SL, 12% TP default)
- **Ticks Mode:** Precise tick-based calculation (50/150 ticks default)
- **Pips Mode:** Forex-style pip calculation (50/150 pips default)
**Realistic Parameters:**
- Commission: 0.1% (adjustable for different asset classes)
- Slippage: 2 ticks
- Position sizing: 10% of equity (conservative)
- No pyramiding (single position management)
## 📊 KEY ADVANTAGES
✅ **Universal Application:** One strategy for all asset classes
✅ **Macro Foundation:** Based on global liquidity and risk sentiment
✅ **False Signal Filtering:** Overbought/oversold zones reduce noise
✅ **Flexible Risk Management:** Multiple SL/TP calculation methods
✅ **No Lookahead Bias:** Clean backtesting with realistic results
✅ **Cross-Market Correlation:** Captures broad market risk cycles
## 🎛️ CONFIGURATION GUIDE
1. **Asset Selection:** Apply to stocks, forex, commodities, indices, crypto
2. **Timeframe Setup:** Daily recommended for swing trading
3. **Sentiment Bounds:** Adjust 48/55 levels based on market volatility
4. **Risk Management:** Choose appropriate SL/TP mode for your asset class
5. **Direction Filter:** Select Long Only, Short Only, or Both
## 📋 BACKTESTING STANDARDS
**Compliant with TradingView Guidelines:**
- ✅ Realistic commission structure (0.1% default)
- ✅ Appropriate slippage modeling (2 ticks)
- ✅ Conservative position sizing (10% equity)
- ✅ Sustainable risk ratios (1:3 SL/TP)
- ✅ No lookahead bias (proper historical simulation)
- ✅ Sufficient sample size potential (100+ trades possible)
## 🔬 ORIGINAL RESEARCH
This strategy introduces a revolutionary approach to financial markets by treating the BTC/Stablecoin ratio as a global risk sentiment gauge. Unlike traditional indicators that analyze individual asset price action, this oscillator captures macro liquidity flows that affect ALL financial markets - from stocks to forex to commodities.
## 🎯 MARKET APPLICATIONS
**Stocks & Indices:** Risk-on/risk-off sentiment timing
**Forex:** Global liquidity flow analysis for major pairs
**Commodities:** Risk appetite for inflation hedges
**Bonds:** Flight-to-safety vs. risk-seeking behavior
**Crypto:** Native application with direct correlation
## ⚠️ RISK DISCLOSURE
- Designed for intermediate to long-term trading across all timeframes
- Market sentiment can remain extreme longer than expected
- Always use appropriate position sizing for your specific asset class
- Adjust commission and slippage settings for different markets
- Past performance does not guarantee future results
## 🚀 INNOVATION SUMMARY
**What makes this strategy unique:**
- First to use BTC/Stablecoin ratio as universal market sentiment indicator
- Applies macro-economic principles to technical analysis across all assets
- Single oscillator provides timing signals for entire financial ecosystem
- Bridges traditional finance with digital asset insights
- Combines fundamental liquidity analysis with technical precision

RSI Divergence StrategyOverview
The RSI Divergence Strategy Indicator is a trading tool that uses the RSI and divergences created to generate high-probability buy and sell signals.
I have provided the best formula of numbers to use for BTC on a 30 minute timeframe.
You can change where on RSI you enter and exit both long or short trades. This way you can experiment on different tokens using different entry/exit points. Can use on multiple timeframes.
This strategy is designed to open and close long or short trades based on the levels you provide it. You can then check on the RSI where the best levels are for each token you want to trade and amend it as required to generate a profitable strategy.
How It Works
The RSI Divergence Strategy Indicator uses bear and bull divergences in conjuction with a level you have input on the RSI.
RSI for Overbought/Oversold:
• Input variables for entry and exit levels and when the entry levels combine with a bear or bull divergence signal, a trade is alerted.
RSI Divergence:
• Buy and sell signals are confirmed when the RSI creates bearish or bullish divergences and these divergences are in the same area as your levels you input for entry to short or long.
After 7 years of experience and testing I have calculated the exact numbers required and produced a formula to calculate the exact input variables for a 30 minute Bitcoin chart.
Key Features
1️⃣ Divergence Identification – Ensures trades are taken only when a bull or bear divergence has formed.
2️⃣ Overbought/Oversold Input Filtering – Set up your own variables on the RSI for different markets after identifying patterns on the RSI in relation to a bearish or bullish divergence.
3️⃣ Works on any chart – Suitable for all markets and timeframes once you input the correct variables for entry and exit levels.
How to Use
🟢 Basic Trading:
• Use on any timeframe.
• Enter trade only when alert has fired off. Close when it says to exit.
• Change entry and exit levels in the properties of the strategy indicator.
• Make entry and exit levels coincide with bearish or bullish divergences on the RSI.
Check the strategy tester to see backtesting so you know if the indicator is profitable or not for that market and timeframe as each crypto token is different and so is the timeframe you choose.
📢 Webhook Automation:
• Set up TradingView Alerts to auto-execute trades via Webhook-compatible platforms.
Key additions for divergence visualization:
Divergence Arrows:
Bullish divergence: Green label with white 'bull ' text
Bearish divergence: Red label with white 'bear' text
Positioned at the pivot point
Divergence Lines:
Connects consecutive RSI pivot points
Automatically drawn between consecutive pivot points
Enhanced RSI Coloring:
Overbought zone: Red
Oversold zone: Green
Neutral zone: Gray
The visualization helps you instantly spot:
Where divergences are forming on the RSI
The pattern of higher lows (bullish) or lower highs (bearish)
Contextual coloring of RSI relative to standard levels
All divergence markers appear at the correct historical pivot points, making it easy to visually confirm divergence patterns as they develop.
Strategy levels and background zones also shown to help visual look.
Why This Combination?
This indicator is just a simple RSI tool.
It is designed to filter out weak trades and only execute trades that have:
✅ RSI Divergence
✅ Overbought or Oversold Conditions
It does not calculate downtrends or bear markets so care is recommended taking long trades during these times.
Why It’s Worth Using?
📈 Open Source – Free to use and learn from.
📉 Long or Short Term Trading Style – Entry/Exit parameters options are designed for both short or long term trades allowing you to experiment until you find a profitable strategy for that market you want to trade.
📢 Seamless Webhook Automation – Execute trades automatically with TradingView alerts.
💲 Ready to trade smarter?
✅ Add the RSI Divergence Strategy Indicator to your TradingView chart.

Big Mover Catcher BTC 4h🧠 Big Mover Catcher (BTC 4H Strategy) — Educational Tool
⚠️ Disclaimer: I am not a financial advisor. This script is for educational and testing purposes only. Cryptocurrency trading is highly volatile and involves significant risk. You can lose all of your invested capital.
📌 Overview
The Big Mover Catcher strategy is a work-in-progress trading system designed for Bitcoin (BTC) on the 4-hour chart. It aims to identify strong breakout moves by combining multiple technical indicators and conditions, allowing for high customization and filter-based confirmations.
This script is part of a personal project to learn Pine Script and backtesting on TradingView. It is currently in the testing and research phase.
🎯 Strategy Objective
Catch large, high-momentum breakout moves in the BTC market using:
Bollinger Band breakouts for entry signals
Momentum, volatility, and trend filters for trade confirmation
🧰 Features & Filters
The script provides a flexible set of filters that can be turned ON/OFF and adjusted directly from the settings panel:
✅ Entry Conditions
Price must break above or below Bollinger Bands
All selected filters must align before entry
🧪 Available Filters:
Relative Strength Index (RSI) with EMA/SMA smoothing
Average Directional Index (ADX) with EMA/SMA smoothing
Average True Range (ATR) with EMA/SMA smoothing
MACD Signal above or below zero
EMA 350 trend filter
ATR / ADX / RSI Threshold toggles for added control
🔥 Additional Feature:
Force Take Profit: Optionally closes the trade immediately if a candle closes with more than a defined % movement (default: 5%). This can help lock in quick profits during high volatility moves.
⚙️ Customizable Inputs
You can configure:
Stop loss percentage
All indicator lengths
Smoothing types (EMA/SMA)
Threshold activation toggles
Individual filter ON/OFF switches
This makes the strategy highly adaptable for educational exploration and optimization.
📊 Best Used For
Learning Pine Script and strategy structure
Testing filter combinations for BTC on the 4H timeframe
Understanding how different indicators interact in live markets
⚠️ Note: ❌ Short trades are currently disabled by default, as short-side logic is still under development.
❗ Final Reminder
This script is not financial advice. It is an educational tool. Use it to learn and explore trading logic. Trading cryptocurrencies carries high risk — only invest what you can afford to lose.

RTB - Momentum Breakout Strategy V3
📈 RTB - Momentum Breakout Strategy V3 is a directional breakout strategy based on momentum. It combines exponential moving averages (EMAs), RSI, and recent support/resistance levels to detect breakout entries with trend confirmation. The system includes dynamic risk management using ATR-based stop-loss and trailing stop levels. Webhook alerts are supported for external automated trading integrations.
🔎 The strategy was backtested using default parameters on BTCUSDT Futures (Bybit) with 4-hour timeframe and a 0.05% commission per trade.
⚠️ This script is for educational purposes only and does not constitute financial advice. Always do your own research before trading.

BTC Trading RobotOverview
This Pine Script strategy is designed for trading Bitcoin (BTC) by placing pending orders (BuyStop and SellStop) based on local price extremes. The script also implements a trailing stop mechanism to protect profits once a position becomes sufficiently profitable.
________________________________________
Inputs and Parameter Setup
1. Trading Profile:
o The strategy is set up specifically for BTC trading.
o The systemType input is set to 1, which means the strategy will calculate trade parameters using the BTC-specific inputs.
2. Common Trading Inputs:
o Risk Parameters: Although RiskPercent is defined, its actual use (e.g., for position sizing) isn’t implemented in this version.
o Trading Hours Filter:
SHInput and EHInput let you restrict trading to a specific hour range. If these are set (non-zero), orders will only be placed during the allowed hours.
3. BTC-Specific Inputs:
o Take Profit (TP) and Stop Loss (SL) Percentages:
TPasPctBTC and SLasPctBTC are used to determine the TP and SL levels as a percentage of the current price.
o Trailing Stop Parameters:
TSLasPctofTPBTC and TSLTgrasPctofTPBTC determine when and by how much a trailing stop is applied, again as percentages of the TP.
4. Other Parameters:
o BarsN is used to define the window (number of bars) over which the local high and low are calculated.
o OrderDistPoints acts as a buffer to prevent the entry orders from being triggered too early.
________________________________________
Trade Parameter Calculation
• Price Reference:
o The strategy uses the current closing price as the reference for calculations.
• Calculation of TP and SL Levels:
o If the systemType is set to BTC (value 1), then:
Take Profit Points (Tppoints) are calculated by multiplying the current price by TPasPctBTC.
Stop Loss Points (Slpoints) are calculated similarly using SLasPctBTC.
A buffer (OrderDistPoints) is set to half of the take profit points.
Trailing Stop Levels:
TslPoints is calculated as a fraction of the TP (using TSLTgrasPctofTPBTC).
TslTriggerPoints is similarly determined, which sets the profit level at which the trailing stop will start to activate.
________________________________________
Time Filtering
• Session Control:
o The current hour is compared against SHInput (start hour) and EHInput (end hour).
o If the current time falls outside the allowed window, the script will not place any new orders.
________________________________________
Entry Orders
• Local Price Extremes:
o The strategy calculates a local high and local low using a window of BarsN * 2 + 1 bars.
• Placing Stop Orders:
o BuyStop Order:
A long entry is triggered if the current price is less than the local high minus the order distance buffer.
The BuyStop order is set to trigger at the level of the local high.
o SellStop Order:
A short entry is triggered if the current price is greater than the local low plus the order distance buffer.
The SellStop order is set to trigger at the level of the local low.
Note: Orders are only placed if there is no current open position and if the session conditions are met.
________________________________________
Trailing Stop Logic
Once a position is open, the strategy monitors profit levels to protect gains:
• For Long Positions:
o The script calculates the profit as the difference between the current price and the average entry price.
o If this profit exceeds the TslTriggerPoints threshold, a trailing stop is applied by placing an exit order.
o The stop price is set at a distance below the current price, while a limit (profit target) is also defined.
• For Short Positions:
o The profit is calculated as the difference between the average entry price and the current price.
o A similar trailing stop exit is applied if the profit exceeds the trigger threshold.
________________________________________
Summary
In essence, this strategy works by:
• Defining entry levels based on recent local highs and lows.
• Placing pending stop orders to enter the market when those levels are breached.
• Filtering orders by time, ensuring trades are only taken during specified hours.
• Implementing a trailing stop mechanism to secure profits once the trade moves favorably.
This approach is designed to automate BTC trading based on price action and dynamic risk management, although further enhancements (like dynamic position sizing based on RiskPercent) could be added for a more complete risk management system.

Ultimate Stochastics Strategy by NHBprod Use to Day Trade BTCHey All!
Here's a new script I worked on that's super simple but at the same time useful. Check out the backtest results. The backtest results include slippage and fees/commission, and is still quite profitable. Obviously the profitability magnitude depends on how much capital you begin with, and how much the user utilizes per order, but in any event it seems to be profitable according to backtests.
This is different because it allows you full functionality over the stochastics calculations which is designed for random datasets. This script allows you to:
Designate ANY period of time to analyze and study
Choose between Long trading, short trading, and Long & Short trading
It allows you to enter trades based on the stochastics calculations
It allows you to EXIT trades using the stochastics calculations or take profit, or stop loss, Or any combination of those, which is nice because then the user can see how one variable effects the overall performance.
As for the actual stochastics formula, you get control, and get to SEE the plot lines for slow K, slow D, and fast K, which is usually not considered.
You also get the chance to modify the smoothing method, which has not been done with regular stochastics indicators. You get to choose the standard simple moving average (SMA) method, but I also allow you to choose other MA's such as the HMA and WMA.
Lastly, the user gets the option of using a custom trade extender, which essentially allows a buy or sell signal to exist for X amount of candles after the initial signal. For example, you can use "max bars since signal" to 1, and this will allow the indicator to produce an extra sequential buy signal when a buy signal is generated. This can be useful because it is possible that you use a small take profit (TP) and quickly exit a profitable trade. With the max bars since signal variable, you're able to reenter on the next candle and allow for another opportunity.
Let me know if you have any questions! Please take a look at the performance report and let me know your thoughts! :)

Sunil 2 Bar Breakout StrategyDetailed Explanation of the Sunil 2 Bar Breakout Strategy
Introduction
The Sunil 2 Bar Breakout Strategy is a simple yet effective price-action-based approach designed to identify breakout opportunities in financial markets. This strategy analyzes the movement of the last three candles to detect momentum and initiates trades in the direction of the breakout. It is equipped with a built-in stop-loss mechanism to protect capital, making it suitable for traders looking for a structured and disciplined trading system.
The strategy works well across different timeframes and asset classes, including indices, stocks, forex, and cryptocurrencies. Its versatility makes it ideal for both intraday and swing trading.
Core Concept
The strategy revolves around two primary conditions: breakout identification and risk management.
Breakout Identification:
Long Trade Setup: The strategy identifies bullish breakouts when:
The current candle's closing price is higher than the previous candle's closing price.
The high of the previous candle is greater than the highs of the two candles before it.
Short Trade Setup: The strategy identifies bearish breakouts when:
The current candle's closing price is lower than the previous candle's closing price.
The low of the previous candle is lower than the lows of the two candles before it.
Risk Management:
Stop-Loss: For each trade, a stop-loss is automatically set:
For long trades, the stop-loss is set to the low of the previous candle.
For short trades, the stop-loss is set to the high of the previous candle.
This ensures that losses are minimized if the breakout fails.
Exit Logic:
The trade is closed automatically when the stop-loss is hit.
This approach maintains discipline and prevents emotional trading.
Strategy Workflow
Entry Criteria:
Long Entry: A long trade is triggered when:
The current close is greater than the previous close.
The high of the previous candle exceeds the highs of the two candles before it.
Short Entry: A short trade is triggered when:
The current close is less than the previous close.
The low of the previous candle is below the lows of the two candles before it.
Stop-Loss Placement:
For long trades, the stop-loss is set at the low of the previous candle.
For short trades, the stop-loss is set at the high of the previous candle.
Trade Management:
Trades are exited automatically if the stop-loss level is hit.
The strategy avoids re-entering trades until new breakout conditions are met.
Default Settings
Position Sizing:
The default position size is set to 1% of the account equity. This ensures proper risk management and prevents overexposure to the market.
Stop-Loss:
Stop-loss levels are automatically calculated based on the previous candle’s high or low.
Timeframes:
The strategy is versatile and works across multiple timeframes. However, it is recommended to test it on 15-minute, 1-hour, and daily charts for optimal performance.
Key Features
Automated Trade Execution:
The strategy handles both trade entry and exit automatically based on pre-defined conditions.
Built-In Risk Management:
The automatic stop-loss placement ensures losses are minimized on failed breakouts.
Works Across Markets:
The strategy is compatible with a wide range of instruments, including indices, stocks, forex, and cryptocurrencies.
Clear Signals:
Entry and exit points are straightforward and based on objective conditions, reducing ambiguity.
Versatility:
Can be used for both day trading and swing trading, depending on the chosen timeframe.
Best Practices for Using This Strategy
Backtesting:
Test the strategy on your chosen instrument and timeframe using TradingView's Strategy Tester to evaluate its performance.
Market Conditions:
The strategy performs best in trending markets or during periods of high volatility. Avoid using it in range-bound or choppy markets.
Position Sizing:
Use the default position size (1% of equity) or adjust based on your risk tolerance and account size.
Instrument Selection:
Focus on instruments with good liquidity and volatility, such as indices (e.g., NIFTY, BANKNIFTY), forex pairs, or major cryptocurrencies (e.g., Bitcoin, Ethereum).
Potential Enhancements
To make the strategy even more robust, consider adding the following optional features:
Stop-Loss Multiplier:
Allow users to customize the stop-loss distance as a multiple of the default level (e.g., 1.5x the low or high of the previous candle).
Take-Profit Levels:
Add user-defined take-profit levels, such as a fixed risk-reward ratio (e.g., 1:2).
Time Filter:
Include an option to restrict trading to specific market hours (e.g., avoid low-liquidity times).
Conclusion
The Sunil 2 Bar Breakout Strategy is an excellent tool for traders looking to capitalize on breakout opportunities while maintaining disciplined risk management. Its simplicity, combined with its effectiveness, makes it suitable for traders of all experience levels. By adhering to the clearly defined rules, traders can achieve consistent results while avoiding emotional trading decisions.
This strategy is a reliable addition to any trader’s toolbox and is designed to work seamlessly across different market conditions and instruments.

EMA RSI Trend Reversal Ver.1Overview:
The EMA RSI Trend Reversal indicator combines the power of two well-known technical indicators—Exponential Moving Averages (EMAs) and the Relative Strength Index (RSI)—to identify potential trend reversal points in the market. The strategy looks for key crossovers between the fast and slow EMAs, and uses the RSI to confirm the strength of the trend. This combination helps to avoid false signals during sideways market conditions.
How It Works:
Buy Signal:
The Fast EMA (9) crosses above the Slow EMA (21), indicating a potential shift from a downtrend to an uptrend.
The RSI is above 50, confirming strong bullish momentum.
Visual Signal: A green arrow below the price bar and a Buy label are plotted on the chart.
Sell Signal:
The Fast EMA (9) crosses below the Slow EMA (21), indicating a potential shift from an uptrend to a downtrend.
The RSI is below 50, confirming weak or bearish momentum.
Visual Signal: A red arrow above the price bar and a Sell label are plotted on the chart.
Key Features:
EMA Crossovers: The Fast EMA crossing above the Slow EMA signals potential buying opportunities, while the Fast EMA crossing below the Slow EMA signals potential selling opportunities.
RSI Confirmation: The RSI helps confirm trend strength—values above 50 indicate bullish momentum, while values below 50 indicate bearish momentum.
Visual Cues: The strategy uses green arrows and red arrows along with Buy and Sell labels for clear visual signals of when to enter or exit trades.
Signal Interpretation:
Green Arrow / Buy Label: The Fast EMA (9) has crossed above the Slow EMA (21), and the RSI is above 50. This is a signal to buy or enter a long position.
Red Arrow / Sell Label: The Fast EMA (9) has crossed below the Slow EMA (21), and the RSI is below 50. This is a signal to sell or exit the long position.
Strategy Settings:
Fast EMA Length: Set to 9 (this determines how sensitive the fast EMA is to recent price movements).
Slow EMA Length: Set to 21 (this smooths out price movements to identify the broader trend).
RSI Length: Set to 14 (default setting to track momentum strength).
RSI Level: Set to 50 (used to confirm the strength of the trend—above 50 for buy signals, below 50 for sell signals).
Risk Management (Optional):
Use take profit and stop loss based on your preferred risk-to-reward ratio. For example, you can set a 2:1 risk-to-reward ratio (2x take profit for every 1x stop loss).
Backtesting and Optimization:
Backtest the strategy on TradingView by opening the Strategy Tester tab. This will allow you to see how the strategy would have performed on historical data.
Optimization: Adjust the EMA lengths, RSI period, and risk-to-reward settings based on your asset and time frame.
Limitations:
False Signals in Sideways Markets: Like any trend-following strategy, this indicator may generate false signals during periods of low volatility or sideways movement.
Not Suitable for All Market Conditions: This indicator performs best in trending markets. It may underperform in choppy or range-bound markets.
Strategy Example:
XRP/USD Example:
If you're trading XRP/USD and the Fast EMA (9) crosses above the Slow EMA (21), while the RSI is above 50, the indicator will signal a Buy.
Conversely, if the Fast EMA (9) crosses below the Slow EMA (21), and the RSI is below 50, the indicator will signal a Sell.
Bitcoin (BTC/USD):
On the BTC/USD chart, when the indicator shows a green arrow and a Buy label, it’s signaling a potential long entry. Similarly, a red arrow and Sell label indicate a short entry or exit from a previous long position.
Summary:
The EMA RSI Trend Reversal Indicator helps traders identify potential trend reversals with clear buy and sell signals based on the EMA crossovers and RSI confirmations. By using green arrows and red arrows, along with Buy and Sell labels, this strategy offers easy-to-understand visual signals for entering and exiting trades. Combine this with effective risk management and backtesting to optimize your trading performance.

Relative StrengthThis strategy employs a custom "strength" function to assess the relative strength of a user-defined source (e.g., closing price, moving average) compared to its historical performance over various timeframes (8, 34, 20, 50, and 200 periods). The strength is calculated as a percentage change from an Exponential Moving Average (EMA) for shorter timeframes and a Simple Moving Average (SMA) for longer timeframes. Weights are then assigned to each timeframe based on a logarithmic scale, and a weighted average strength is computed.
Key Features:
Strength Calculation:
Calculates the relative strength of the source using EMAs and SMAs over various timeframes.
Assigns weights to each timeframe based on a logarithmic scale, emphasizing shorter timeframes.
Calculates a weighted average strength for a comprehensive view.
Visualizations:
Plots the calculated strength as a line, colored green for positive strength and red for negative strength.
Fills the background area below the line with green for positive strength and red for negative strength, enhancing visualization.
Comparative Analysis:
Optionally displays the strength of Bitcoin (BTC), Ethereum (ETH), S&P 500, Nasdaq, and Dow Jones Industrial Average (DJI) for comparison with the main source strength.
Backtesting:
Allows users to specify a start and end time for backtesting the strategy's performance.
Trading Signals:
Generates buy signals when the strength turns positive from negative and vice versa for sell signals.
Entry and exit are conditional on the backtesting time range.
Basic buy and sell signal plots are commented out (can be uncommented for visual representation).
Risk Management:
Closes all open positions and cancels pending orders outside the backtesting time range.
Disclaimer:
Backtesting results do not guarantee future performance. This strategy is for educational purposes only and should be thoroughly tested and refined before risking capital.
Additional Notes:
- The strategy uses a custom "strength" function that can be further customized to explore different timeframes and weighting schemes.
- Consider incorporating additional technical indicators or filters to refine the entry and exit signals.
- Backtesting with different parameters and market conditions is crucial for evaluating the strategy's robustness.
Swing High/Low Pivots Strategy [LV]The Swing High/Low Pivots Strategy was developed as a counter-momentum trading tool.
The strategy is suitable for any market and the default values used in the input settings menu are set for Bitcoin (best on 15min). These values, expressed in minimum ticks (or pips if symbol is Forex) make this tool perfectly adaptable to every symbol and/or timeframe.
Check tooltips in the settings menu for more details about every user input.
STRTEGY ENTRY & EXIT MECHANISMS:
Trades Entry based on the detection of swing highs and lows for short and long entries respectively, validated by:
- Limit orders placed after each new pivot level confirmation
- Moving averages trend filter (if enabled)
- No active trade currently open
Trades Exit when the price reaches take-profit or stop-loss level as defined in the settings menu. A double entry/second take-profit level can be enabled for partial exits, with dynamic stop-loss adjustment for the remaining position.
Enhanced Trade Precision:
By limiting entries to confirmed swing high (HH, LH) or swing low (HL, LL) pivot points, the strategy ensures that trades occur at levels of significant price reversals. This precision reduces the likelihood of entering trades in the midst of a trend or during uncertain price action.
Risk Management Optimization:
The strategy incorporates clearly defined stop-loss (SL) and take-profit (TP) levels derived from the pivot points. This structured approach minimizes potential losses while locking in profits, which is critical for consistent performance in volatile markets.
Trend Filtering for Better Entry:
The use of a configurable moving average filter adds a layer of trend validation. This prevents entering trades against the dominant market trend, increasing the probability of success for each trade.
Avoidance of Noise:
The lookback period (length parameter) confirms pivots only after a set number of bars, effectively filtering out market noise and ensuring that entries are based on reliable, well-defined price movements.
Adaptability Across Markets:
The strategy is versatile and can be applied across different markets (Forex, stocks, crypto) due to its dynamic use of ticks and pips converters. It adapts seamlessly to varying price scales and asset types.
Dual Quantity Entries:
The original and optionnal double-entry mechanism allows traders to capture both short-term and extended profits by scaling out of positions. This adaptive approach caters to varying risk appetites and market conditions.
Clear Visualization:
The plotted pivot points, entry limits, SL, and TP levels provide visual clarity, making it easy for traders to track the strategy's behavior and make informed decisions.
Automated Execution with Alerts:
Integrated alerts for both entries and exits ensure timely actions without the need for constant market monitoring, enhancing efficiency. Configurable alert messages are suitable for API use.
Any feedback, comments, or suggestions for improvement are always welcome.
Hope you enjoy!

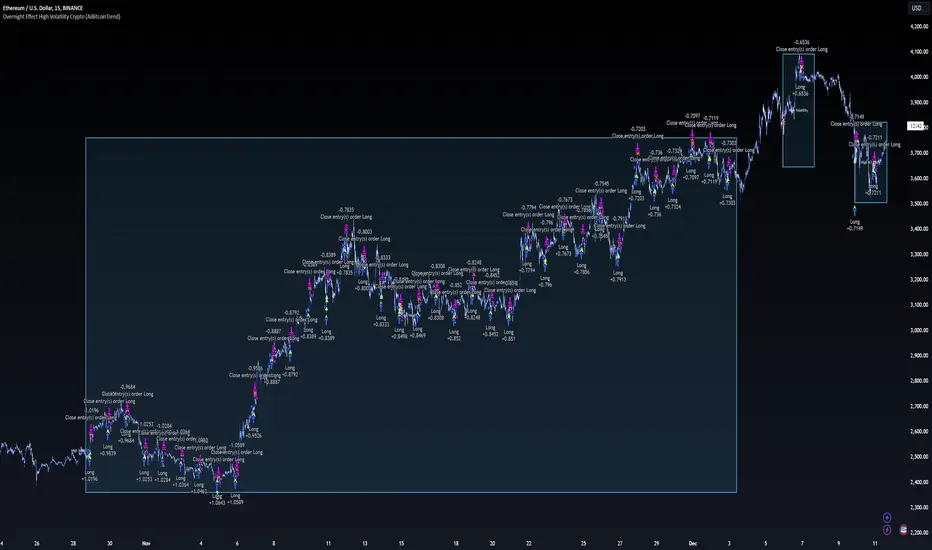
Overnight Effect High Volatility Crypto (AiBitcoinTrend)👽 Overview of the Strategy
This strategy leverages the overnight effect in the cryptocurrency market, specifically targeting the two-hour window from 21:00 UTC to 23:00 UTC. The strategy is designed to be applied only during periods of high volatility, which is determined using historical volatility data. This approach, inspired by research from Padyšák and Vojtko (2022), aims to capitalize on statistically significant return patterns observed during these hours.
Deep Backtesting with a High Volatility Filter
Deep Backtesting without a High Volatility Filter
👽 How the Strategy Works
Volatility Calculation:
Each day at 00:00 UTC, the strategy calculates the 30-day historical volatility of crypto returns (typically Bitcoin). The historical volatility is the standard deviation of the log returns over the past 30 days, representing the market's recent volatility level.
Median Volatility Benchmark:
The median of the 30-day historical volatility is calculated over a 365-day period (one year). This median acts as a benchmark to classify each day as either:
👾 High Volatility: When the current 30-day volatility exceeds the median volatility.
👾 Low Volatility: When the current 30-day volatility is below the median.
Trading Rule:
If the day is classified as a High Volatility Day, the strategy executes the following trades:
👾 Buy at 21:00 UTC.
👾 Sell at 23:00 UTC.
Trade Execution Details:
The strategy uses a 0.02% fee per trade.
Each trade is executed with 25% of the available capital. This allocation helps manage risk while allowing for compounding returns.
Rationale:
The returns during the 22:00 and 23:00 UTC hours have been found to be statistically significant during high volatility periods. The overnight effect is believed to drive this phenomenon due to the asynchronous closing hours of global financial markets. This creates unique trading opportunities in the cryptocurrency market, where exchanges remain open 24/7.
👽 Market Context and Global Time Zone Impact
👾 Why 21:00 to 23:00 UTC?
During this window, major traditional financial markets are closed:
NYSE (New York) closes at 21:00 UTC.
London and European markets are closed during these hours.
Asian markets (Tokyo, Hong Kong, etc.) open later, leaving this window largely unaffected by traditional trading flows.
This global market inactivity creates a period where significant moves can occur in the cryptocurrency market, particularly during high volatility.
👽 Strategy Parameters
Volatility Period: 30 days.
The lookback period for calculating historical volatility.
Median Period: 365 days.
The lookback period for calculating the median volatility benchmark.
Entry Time: 21:00 UTC.
Adjust this to your local time if necessary (e.g., 16:00 in New York, 22:00 in Stockholm).
Exit Time: 23:00 UTC.
Adjust this to your local time if necessary (e.g., 18:00 in New York, 00:00 midnight in Stockholm).
👽 Benefits of the Strategy
Seasonality Effect:
The strategy captures consistent patterns driven by the overnight effect and high volatility periods.
Risk Reduction:
Since trades are executed during a specific window and only on high volatility days, the strategy helps mitigate exposure to broader market risk.
Simplicity and Efficiency:
The strategy is moderately complex, making it accessible for traders while offering significant returns.
Global Applicability:
Suitable for traders worldwide, with clear guidelines on adjusting for local time zones.
👽 Considerations
Market Conditions: The strategy works best in a high-volatility environment.
Execution: Requires precise timing to enter and exit trades at the specified hours.
Time Zone Adjustments: Ensure you convert UTC times accurately based on your location to execute trades at the correct local times.
Disclaimer: This information is for entertainment purposes only and does not constitute financial advice. Please consult with a qualified financial advisor before making any investment decisions.
BTCUSD Momentum After Abnormal DaysThis indicator identifies abnormal days in the Bitcoin market (BTCUSD) based on daily returns exceeding specific thresholds defined by a statistical approach. It is inspired by the findings of Caporale and Plastun (2020), who analyzed the cryptocurrency market's inefficiencies and identified exploitable patterns, particularly around abnormal returns.
Key Concept:
Abnormal Days:
Days where the daily return significantly deviates (positively or negatively) from the historical average.
Positive abnormal days: Returns exceed the mean return plus k times the standard deviation.
Negative abnormal days: Returns fall below the mean return minus k times the standard deviation.
Momentum Effect:
As described in the academic paper, on abnormal days, prices tend to move in the direction of the abnormal return until the end of the trading day, creating momentum effects. This can be leveraged by traders for profit opportunities.
How It Works:
Calculation:
The script calculates the daily return as the percentage difference between the open and close prices. It then derives the mean and standard deviation of returns over a configurable lookback period.
Thresholds:
The script dynamically computes upper and lower thresholds for abnormal days using the mean and standard deviation. Days exceeding these thresholds are flagged as abnormal.
Visualization:
The mean return and thresholds are plotted as dynamic lines.
Abnormal days are visually highlighted with transparent green (positive) or red (negative) backgrounds on the chart.
References:
This indicator is based on the methodology discussed in "Momentum Effects in the Cryptocurrency Market After One-Day Abnormal Returns" by Caporale and Plastun (2020). Their research demonstrates that hourly returns during abnormal days exhibit a strong momentum effect, moving in the same direction as the abnormal return. This behavior contradicts the efficient market hypothesis and suggests profitable trading opportunities.
"Prices tend to move in the direction of abnormal returns till the end of the day, which implies the existence of a momentum effect on that day giving rise to exploitable profit opportunities" (Caporale & Plastun, 2020).

TrendGuard Scalper: SSL + Hama Candle with Consolidation ZonesThis TradingView script brings a powerful scalping strategy that combines the SSL Channel and Hama Candles indicators with a special twist—consolidation detection. Designed for traders looking for consistency in various markets like crypto, forex, and stocks, this strategy highlights clear trend signals, risk management, and helps filter out risky trades during consolidation periods.
Why Use This Strategy?
Clear Trend Detection:
With the SSL Channel, you’ll know exactly when the market is in an uptrend (green) or downtrend (red), giving you straightforward entry points.
Short-Term Trend Precision with Hama Candles:
By calculating unique EMAs for open, high, low, and close, the Hama Candles show the strength and direction of short-term trends. Combined with the Hama Line, it gives you a solid confirmation on whether the trend is strong or about to reverse, allowing for precise entries and exits.
Avoiding Choppy Markets:
Thanks to ATR-based consolidation detection, this strategy identifies low-volatility periods where the market is “choppy” and less predictable. During these times, a yellow background appears on the chart, warning you to hold off on trades, reducing the likelihood of entering losing trades.
Built-In Risk Management:
With adjustable Take Profit and Stop Loss levels based on price movements, you can set and forget your trades, with a safety net if the market turns against you. The strategy automatically closes positions if the price returns to the Hama Candle, keeping your risk low.
How It Works:
Long Position: When both the SSL and Hama indicators show a green trend, and the price is above the Hama Candles, the strategy opens a long position. Take Profit triggers at your chosen risk-to-reward ratio, while Stop Loss protects you just below the Hama Line.
Short Position: When both indicators align in red and the price is below the Hama Candles, the strategy opens a short. Similar to longs, Stop Loss is set just above the Hama Line, and Take Profit is at your defined level.
Start Trading Confidently
Test this strategy with different settings and discover how it can perform across various assets. Whether you're trading Bitcoin, forex pairs, or stocks, this system has the flexibility and robustness to help you spot profitable trends and avoid risky zones. Try it today on a 30-minute timeframe to see how it aligns with your trading goals, and let the consolidation detection guide you away from false signals.
Happy trading, and may the trends be with you! 📈
