Cerca negli script per "bollingerband"

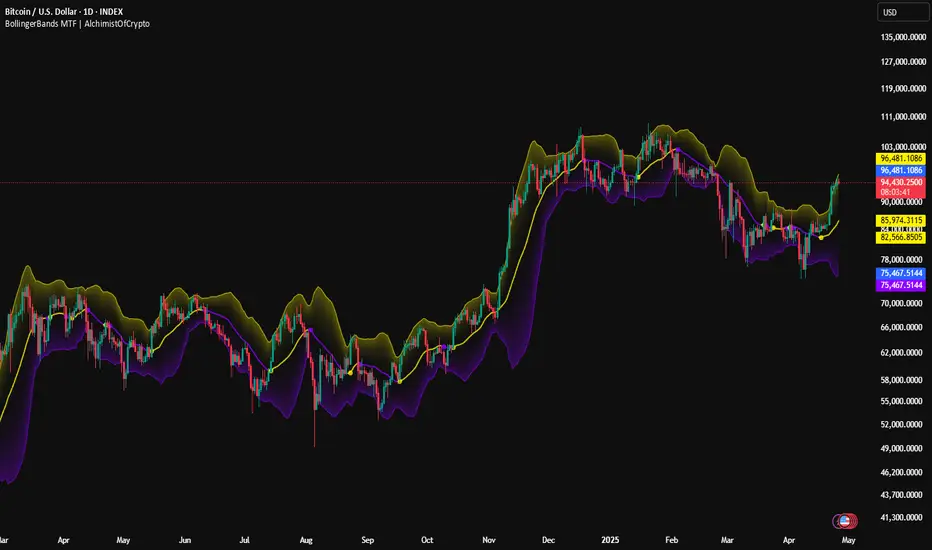
BollingerBands MTF | AlchimistOfCrypto🌌 Bollinger Bands – Unveiling Market Volatility Fields 🌌
"The Bollinger Bands, reimagined through quantum mechanics principles, visualizes the probabilistic distribution of price movements within a multi-dimensional volatility field. This indicator employs principles from wave function mathematics where standard deviation creates probabilistic boundaries, similar to electron cloud models in quantum physics. Our implementation features algorithmically enhanced visualization derived from extensive mathematical modeling, creating a dynamic representation of volatility compression and expansion cycles with adaptive glow effects that highlight the critical moments where volatility phase transitions occur."
📊 Professional Trading Application
The Bollinger Bands Quantum transcends traditional volatility measurement with a sophisticated gradient illumination system that reveals the underlying structure of market volatility fields. Scientifically calibrated for multiple timeframes and featuring eight distinct visual themes, it enables traders to perceive volatility contractions and expansions with unprecedented clarity.
⚙️ Indicator Configuration
- Volatility Field Parameters 📏
Python-optimized settings for specific market conditions:
- Period: 20 (default) - The quantum time window for volatility calculation
- StdDev Multiplier: 2.0 - The probabilistic boundary coefficient
- MA Type: SMA/EMA/VWMA/WMA/RMA - The quantum field smoothing algorithm
- Visual Theming 🎨
Eight scientifically designed visual palettes optimized for volatility pattern recognition:
- Neon (default): High-contrast green/red scheme enhancing volatility transition visibility
- Cyan-Magenta: Vibrant palette for maximum volatility boundary distinction
- Yellow-Purple: Complementary colors for enhanced compression/expansion detection
- Specialized themes (Green-Red, Forest Green, Blue Ocean, Orange-Red, Grayscale): Each calibrated for different market environments
- Opacity Control 🔍
- Variable transparency system (0-100) allowing seamless integration with price action
- Adaptive glow effect that intensifies during volatility phase transitions
- Quantum field visualization that reveals the probabilistic nature of price movements
🚀 How to Use
1. Select Visualization Parameters ⏰: Adjust period and standard deviation to match market conditions
2. Choose MA Type 🎚️: Select the appropriate smoothing algorithm for your trading strategy
3. Select Visual Theme 🌈: Choose a color scheme that enhances your personal pattern recognition
4. Adjust Opacity 🔎: Fine-tune visualization intensity to complement your chart analysis
5. Identify Volatility Phases ✅: Monitor band width to detect compression (pre-breakout) and expansion (trend)
6. Trade with Precision 🛡️: Enter during band contraction for breakouts, or trade mean reversion using band boundaries
7. Manage Risk Dynamically 🔐: Use band width as volatility-based position sizing parameter
BollingerBands Strat + pending order alerts via TradingConnectorSoftware part of algotrading is simpler than you think. TradingView is a great place to do this actually. To present it, I'm publishing each of the default strategies you can find in Pinescript editor's "built-in" list with slight modification - I'm only adding 2 lines of code, which will trigger alerts, ready to be forwarded to your broker via TradingConnector and instantly executed there. Alerts added in this script: 14, 17, 20 and 23.
SCRIPT INCLUDES PENDING ORDERS AND ALERTS! Alert will be sent to MetaTrader when order is triggered, but not yet filled. That means if market conditions change and order does not get filled, it needs to be cancelled as well, and there are alerts for that in the script as well.
How it works:
1. TradingView alert fires.
2. TradingConnector catches it and forwards to MetaTrader4/5 you got from your broker.
3. Trade gets executed inside MetaTrader within 1 second of fired alert.
When configuring alert, make sure to select "alert() function calls only" in CreateAlert popup. One alert per ticker is required.
Adding stop-loss, take-profit, trailing-stop, break-even or executing pending orders is also possible. These topics have been covered in other example posts.
This routing works for Forex, indices, stocks, crypto - anything your broker offers via their MetaTrader4 or 5.
Disclaimer: This concept is presented for educational purposes only. Profitable results of trading this strategy are not guaranteed even if the backtest suggests so. By no means this post can be considered a trading advice. You trade at your own risk.
If you are thinking to execute this particular strategy, make sure to find the instrument, settings and timeframe which you like most. You can do this by your own research only.

bollingerBandsV2Library "bollingerBandsV2"
Bollinger bands related functions
get_multiple_bollinger_bands(stdv1, stdv2, stdv3, stdv4, stdv5, stdv6, stdv7, length, source)
: Calculates 7 sets of bollinger bands, with 7 different standard deviations
Parameters:
stdv1 (float) : (simple int): standard deviation 1
stdv2 (float) : (simple int): standard deviation 2
stdv3 (float) : (simple int): standard deviation 3
stdv4 (float) : (simple int): standard deviation 4
stdv5 (float) : (simple int): standard deviation 5
stdv6 (float) : (simple int): standard deviation 6
stdv7 (float) : (simple int): standard deviation 7
length (simple int) : (simple int): Length for the bands
source (float) : (simple float): source for the calculation
Returns: : Returns 8 levels plus the range of all the levels.
get_bb_volatility(bb_highest, bb_lowest, ma_length, lookback)
: Provides a volatility indicator based on Bollinger Bands, and indicates wheather the volatility is increasing or decreasing.
Parameters:
bb_highest (float) : (simple float): Top Bollinger Band on which to calculate the range.
bb_lowest (float) : (simple float): Bottom Bollinger Band on which to calculate the range.
ma_length (simple int) : (simple int): Length to use in the smoothing of Bollinger Bands range.
lookback (int) : (simple int): Lookback period to identify a change in the Bollinger Bands range.
Returns: : Returns 8 levels plus the range of all the levels.
get_bbVolatility_data(source, length, stdv1, stdv2, stdv3, stdv4, stdv5, stdv6, stdv7, trend_direction)
: Generates Bollinger Bands Volatility
Parameters:
source (float) : (float): Source for Bollinger Bands
length (simple int) : (int): Length for Bollinger Bands
stdv1 (int) : (int): Standard Deviation 1
stdv2 (int) : (int): Standard Deviation 2
stdv3 (int) : (int): Standard Deviation 3
stdv4 (int) : (int): Standard Deviation 4
stdv5 (int) : (int): Standard Deviation 5
stdv6 (int) : (int): Standard Deviation 6
stdv7 (int) : (int): Standard Deviation 7
trend_direction (string) : (string): Current direction of the trend
Returns: : Returns a map with the levels, plus direction flag and the data table

bollingerBandsLibrary "bollingerBands"
Bollinger bands related functions
get_multiple_bollinger_bands(stdv1, stdv2, stdv3, stdv4, stdv5, stdv6, stdv7, length, source)
Parameters:
stdv1 (int)
stdv2 (int)
stdv3 (int)
stdv4 (int)
stdv5 (int)
stdv6 (int)
stdv7 (int)
length (simple int)
source (float)
get_bb_volatility(bb_highest, bb_lowest, ma_length, lookback)
Parameters:
bb_highest (float)
bb_lowest (float)
ma_length (simple int)
lookback (int)

TEC_MapHack_Sub2_Chart_ver_2.0.0본 지표는 PSAR + Bollinger Bands 를 사용해 추세를 나타내는 지표입니다.
배경색이 붉은색이면 상승추세, 파란색이면 하락추세를 나타냅니다.
PSAR과 BollingerBands 중심선을 기준으로 추세를 알아냅니다.
These are indicators of trends using PSAR + Bollinger Bands.
A red background indicates an upward trend, while a blue one indicates a downward trend.
Identify trends based on the centerlines of PSAR and BollingerBands.

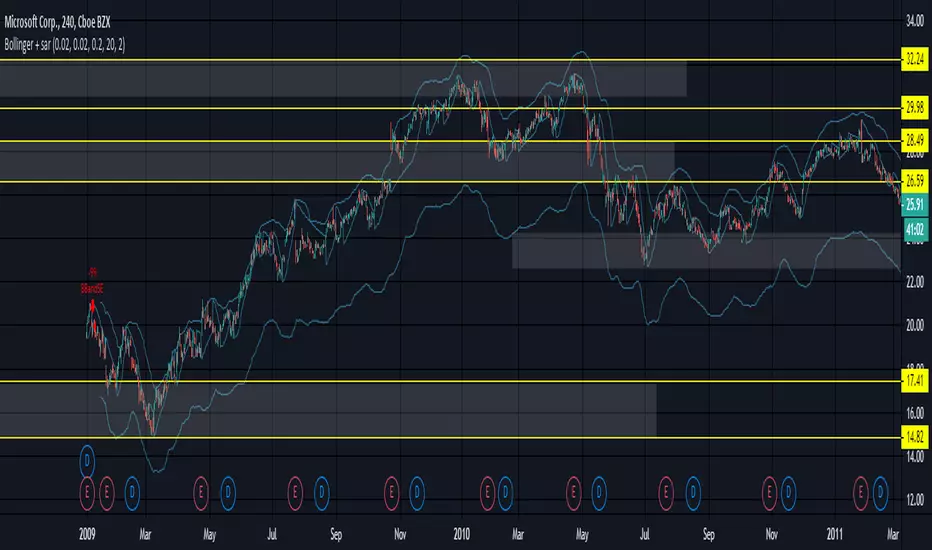
Matty Pips strategy 2For education purpose. Applied only for Matty Pips Strategy. Arrow will appear when bollingerband + sar + binary with temito are in the same OB/OS.
Matty Pips main strategy is number 1. This is number 2

BollingerBands Balance[Giang]The "BollingerBands Balance " indicator is an enhanced version of the traditional Bollinger Bands, designed to analyze price trends on higher timeframes to identify key support and resistance zones. Instead of relying on the Simple Moving Average (SMA) to calculate standard deviation and define upper/lower bands, this indicator uses a Balance Line (CB), calculated by averaging the highest and lowest prices over a specified period and smoothing it with the Hull Moving Average (HMA).
This indicator provides multi-level upper and lower bands (from "min" to "supper max") with customizable multipliers, enabling users to identify potential reversal or continuation zones with ease. Analyzing with multiple support/resistance bands not only aids in recognizing short-term trends but also provides a broad view of long-term trends. The BollingerBands Balance indicator is a valuable tool for adjusting trading strategies and identifying optimal entry and exit points based on price dispersion around the balance line.

Bollinger + sarProblem with change in bollingerbands when adding psar short condition - and i dont know why.
Anyone - any ideas?
5EMA BollingerBand Nifty Stock Scanner
What ?
We all heard about (well: over-heard) 5-EMA strategy. Which falls into the broader category of mean reversal type of trading setup.
What is mean reversal?
Price (or any time series, in fact) tries to follow a mean . Whenever price diverges from the mean it tries to meet it back.
It is empirically observed by some traders (I honestly don't know who first time observed it) that in Indian context specially, 5 Exponential Moving Average (5-EMA) works pretty good as that mean.
So whenever price moves away from that 5-EMA, it ultimately comes back and attain total nirvana :) Means: if price moved way higher than the 5EMA without touching it, then price will correct to meet it's 5-EMA and if price moved way lower, it will be uplifted to meet it's 5-EMA. Funny - but it works !
Now there are already enough social media coverage on this 5-EMA strategy/setup. Even TradingView has some excellent work done on these setups. Kudos to all those great souls.
So when we came to know about this, we were thinking what we should do for the community. Because it is well cover topic (specially in Indian context). Also, there are public indicators.
Then we thought why not come up with a scanner which will scan all the Nifty-50 constituent stocks and find out on the fly, real-time which all stocks are matching this 5-EMA setup and causing a Buy/Sell trade recommendation.
Hence here we are with the first version of our first scanner on the 5EMA setup (well it has some more masala than merely a 5-EMA setup).
Why?
Parts of why is already covered up.
Now instead of blindly following 5-EMA setup, we added the Bollinger band as well. Again: it's also not new. There are enough coverage in social media about the 5-EMA+BB strategy/setup. We mercilessly borrowed from all of these.
Suppose you have an indicator.
Now you apply the indicator in your chart. And then you need to (rock) and roll through your watchlist of Nifty-50 stocks (note: TradingView has no default watchlist of Nifty-50 stock by default - you have to create one custom watchlist to list all manually) to find out which all are matching the setup, need to take a note about the trade recomendations (entry, SL, target) and other stuffs like VWAP, Volume, volatility (Bollinger Band Width).
Not any more.
This scanner will track all the Nifty-50 stocks (technically: 40 stocks other than Banking stocks) and provide which one to Buy or Sell (if any), what's the entry, SL, target, where is the VWAP of the day, what's the picture in volume (high, low, rising, falling) and the implied volatility (using Bolling band width). Also it has a naive alerting mechanism as well.
In fact the code is there to monitor the (Future) OI also and all the OI drama (OI vs price and all the 4 stuffs like long build up, long unwinding, short covering, short buildup). But unfortunately, due to some limitations of the TradingView (that one can not monitor more than 40 `ta.security` call) we have to comment out the code. If you wish you can monitor only 20 stocks and enable the OI monitoring also (20 for stocks + 20 for their OI monitoring .. total 40 `ta.security` call).
How?
To know the divergence from 5-EMA we just check if the high of the candle (on closing) is below the 5-EMA. Then we check if the closing is inside the Bollinger Band (BB). That's a Buy signal. SL: low of the candle, T: middle and higher BB.
Just opposite for selling. 5-EMA low should be above 5-EMA and closing should be inside BB (lesser than BB higher level). That's a Sell signal. SL: high of the candle, T: middle and lower BB.
Along with we compare the current bar's volume with the last-20 bar VWMA (volume weighted moving average) to determine if the volume is high or low.
Present bar's volume is compared with the previous bar's volume to know if it's rising or falling.
VWAP is also determined using `ta.vwap` built-in support of TradingView.
The Bolling Band width is also notified, along with whether it is rising or falling (comparing with previous candle).
Simple, but effective.
Customization
As usual the EMA setup (5 default), the BB setup (20 SMA with 1.5 standard deviation), we provided option wherther to include or exclude BB role in the 5-EMA setup (as we found out there are two schools of thought .. some people use BB some don't. Lets make all happy :))
We also provide options to choose other symbols using Settings if they wish so. We have the default 40 non banking Nifty stocks (why non-banking? - Bank Nifty is in ATH :) .. enough :)). But if user wishes can monitor others too (provided the symbol is there in TradingView).
Although we strongly recommend the timeframe as 30 minutes , you can choose what's fit you most.
The output of the scanner is a table. By default the table is placed in the right-bottom (as we are most comfortable with that). However you can change per your wish. We have the option to choose that.
What is unique in it ?
This is more of an indicator. This is a scanner (of Nifty-50 stocks). So you can apply (our recommendation is in 30m timeframe) it to any chart (does not matter which chart it is) and it will show every 30 mins (which is also configurable) which all stocks (along with trade levels) to Buy and Sell according to the setup.
It will ease your trading activity.
You can concentrate only on the execution, the filtering you can leave it to this one.
Limitations
There is a build in limitation of the TradingView platform is that one can call only upto 40 securities API. Not beyond that. So naturally we are constraint by that. Otherwise we could monitor 190 Nifty F&O stocks itself.
30m is the recommended timeframe. In very lower (say 5m) this script tends to go out of heap (out of memory). Please note that also.
How to trade using this?
Put any chart in 30m (recommended) timeframe.
Apply this screener from Indicators (shortcut to launch indicators is just type / in your keyboard).
This will provide the Buy (shown in green color) or Sell (shown in red color) recommendations in a table, at every 30m candle closing.
Note the volume and BB width as well.
Wait for at least 2 5-minutes candles to close above/below the recommended level .
Take the trade with the SL and target mentioned.
Mentions
@QuantNomad. The whole implementation concept we mercilessly borrowed from him, even some of his code snippet we took it (after asking him through one of his videos comment section and seeking explicit permission which he readily granted within an hour). Thank You sir @QuantNomad. Indebted to you.
Monika (Rawat) ji: for reviewing, correcting, providing real time examples during live market hours, often compromising her own trading activities, about the effectiveness and usefulness of this setup. Thank You madam ji. Indebted to you.
There are innumerable contents in social media about this. Don't even know whom all we checked. Thanks to all of them.
Happy Trading (in stocks - isn't enough of Indices already?)
Disclaimer
This piece of software does not come up with any warrantee or any rights of not changing it over the future course of time.
We are not responsible for any trading/investment decision you are taking out of the outcome of this indicator.

5EMA_BB_ScalpingWhat?
In this forum we have earlier published a public scanner called 5EMA BollingerBand Nifty Stock Scanner , which is getting appreciated by the community. That works on top-40 stocks of NSE as a scanner.
Whereas this time, we have come up with the similar concept as a stand-alone indicator which can be applied for any chart, for any timeframe to reap the benifit of reversal trading.
How it works?
This is essentially a reversal/divergence trading strategy, based on a widely used strategy of Power-of-Stocks 5EMA.
To know the divergence from 5-EMA we just check if the high of the candle (on closing) is below the 5-EMA. Then we check if the closing is inside the Bollinger Band (BB). That's a Buy signal. SL: low of the candle, T: middle and higher BB.
Just opposite for selling. 5-EMA low should be above 5-EMA and closing should be inside BB (lesser than BB higher level). That's a Sell signal. SL: high of the candle, T: middle and lower BB.
Along with we compare the current bar's volume with the last-20 bar VWMA (volume weighted moving average) to determine if the volume is high or low.
Present bar's volume is compared with the previous bar's volume to know if it's rising or falling.
VWAP is also determined using `ta.vwap` built-in support of TradingView.
The Bolling Band width is also notified, along with whether it is rising or falling (comparing with previous candle).
What's special?
We love this reversal trading, as it offers many benifits over trend following strategies:
Risk to Reward (RR) is superior.
It _Does Hit_ stop losses, but the stop losses are tiny.
Means, althrough the Profit Factor looks Nahh , however due to superior RR, end of day it ended up in green.
When the day is sideways, it's difficult to trade in trending strategies. This sort of volatility, reversal strategies works better.
It's always tempting to go agaist the wind. Whole world is in Put/PE and you went opposite and enter a Call/CE. And turns out profitable! That's an amazing feeling, as a trader :)
How to trade using this?
* Put any chart
* Apply this screener from Indicators (shortcut to launch indicators is just type / in your keyboard).
* It will show you the Green up arrow when buy alert comes or red down arrow when sell comes. * Also on the top right it will show the latest signal with entry, SL and target.
Disclaimer
* This piece of software does not come up with any warrantee or any rights of not changing it over the future course of time.
* We are not responsible for any trading/investment decision you are taking out of the outcome of this indicator.

matty pips strategyFor education purpose. Applied only for Matty Pips Strategy. Arrow will appear when bollingerband + sar + binary with temito are in the same OB/OS.

3MAs & BB, Time-Res, Low-VolTriple MAs with EMA/SMA option, and specific timeframe options.
Very customizable.
Bollinger Bands
If BollingerBand Width is lowest in 100 bars it fills background.

Bollinger Bands Strategy LingsbordIndicator made by the idea provided by Lingsbord from the forum Binary Options Edge.
Features Implemented from Original Idea
Trade Sessions 0410-0815 and 0930-1200 (for some reason pinescript works off UTC-4?, London is UTC+1)
Indicator only signals when bar is inside trade sessions.
Background is shaded when Trade session is active.
Indicator Draws Arrows when a bar closes outside of 2.5 bollinger band.
Trade is executed at the opening of the next bar and recorded in the strategy tester.
Modifications to Original Idea
This Strategy has been modified to include his "Anti-Breakout Protection) where it will only place 2 consecutive losing trades in the event of consecutive bar closing outside of the bollingerbands.
www.binaryoptionsedge.com
In the Event of the first trade ending ITM and the next bar closing back inside the Bollinger bands then the next bar going back outside, the script will trigger another trade signal.
Allows for consecutive wins in an uptrend but still limiting to 2 losses as per modification above
Excel Spread sheet tracking profits
$1887.04 from Monday 17-09-2018 to Friday 21-09-2018
i.imgur.com
www.binaryoptionsedge.com
Step 1.
I have an FXCM demo account running Metatrader 4 and a 1 min EURUSD chart open.
This chart has 1 indicator on it, Bollinger Bands with settings 20 and 2.5.
I found that deviation of 2 creates too many false signals and deviation of 3 means you’ll be lucky to see more than 3 trades per day.
I settled on 1 minute for the number of trades it offers during an average day and because the 5 minute offers no better ITM rate.
I also have the Market Watch window open on the metatrader but I reduce the size of the box down so I can only see the EURUSD rate and the clock.
It’s this clock that I use as my “countdown trigger”.
Step 2.
-Redacted- (Affilliate marketing bullshit) -Redacted-
Step 3.
OK as you will have seen elsewhere on the BOE Boards,
the trading strategy is simply to take a trade in the opposite direction when a candle closes outside the Bollinger Bands,
so if it closes out of the top band I enter a Put, and if it closes below the bottom band I enter a Call.
As the Market Watch clock gets into the 50s on the seconds and if a trade appears to be lining up,
I’ll hover over the Put/Call button and closely watch the clock and the chart so I can nail the trade the moment the candle closes.
Expiry is 1 minute.
Trading times
I avoid the period prior to London Open as there’s often a series of trades in the same (wrong) direction as the market gears itself up for the day,
so I’ll normally look for the first trade from 09:10 UK time and I’ll then trade until about 13:15,
picking up again around 14:30 after NYC Open to avoid another rush around that time and to give me a chance to enjoy some lunch without worrying about trading!
For those of you trading Asian markets I’d avoid the “dead zone” and trade from about 02:00 onwards (again, UK time) when there might be enough movement to be able to make sense of this strategy.
Trade sizes
My first trade is $100. If this trade ends ITM I make $82 and look for the next one, again at the starting level of $100
If the first trade ends OTM then my second trade on the next signal is $320. If this trade ends ITM I make $262 which recovers the original $100,
also creates the original $82 of profit that the first trade would have made, and then makes a further $80.
Again your next trade is at the starting level of $100
If the second trade ends OTM then the third trade is $512.
If this trade ends ITM then it recovers the original $100 and the $320 but there’s no profit,
we’ve just recovered the losses and we move on with the next trade at $100
If the third trade ends OTM we REPEAT the $512 trade. If this trade ends ITM we generate $420 towards recovering part of the losses made in the other trades.
These 1-4 trade sequences we call “events”.
Most events will be only 1 or 2 trades,
i.e. you will be making consistent strong returns most of the time.
When an event consists of 3 consecutive trades you will break even on that event and look for the next trade
When an event consists of 4 trades where the 4th one ends ITM you will subsidise your loss on the previous 3.
Some people can’t face the concept of a trade that doesn’t generate profit,
but believe me I’ve run so many examples that this structure works best in terms of risk/reward over time.
When an event consists of 4 trades and the 4th one ends OTM you will take a “hit”.
Based on the above numbers the hit will cost you $1,444 at this level.
When this happens you set the platform back to $100 and start again.

RSI-BBGun-v6.1RSI BB Gun – Operator's Guide
“Eyes on target. Wait for the right moment. Then strike.”
________________________________________
🎯 Mission Objective
RSI BB Gun identifies extreme market conditions using RSI and Bollinger Bands, then overlays trend and volatility intelligence so you know when the setup is real.
The ❌ is your target acquisition signal—price just moved from an extreme zone back into play. Now you’ve got a clean radar lock.
________________________________________
📡 How to Operate
🟣 Step 1: Watch for the ❌'s (Black X = RSI & Bollinger Band Extremes Encountered)
• The Purple X means price and RSI are both stretched—and just snapped back into range.
• The target is now in the cross hairs and potentially ready for engagement.
🟥 Step 2: Confirm the Trend
• The thick ribbon tells you if the trend is with you:
o 🟢 Green = Uptrend. Focus on long setups.
o 🔴 Red = Downtrend. Focus on puts or short plays.
• Align with trend. Only engage when the field favors your position.
🔺 Step 3: Evaluate Signal Context
• Green Triangles = price just crossed below lower Bollinger Band (oversold).
• Red Triangles = price crossed above upper Band (overbought).
• Horizontal Lines Disappeared = The bar after the green or red horizontal line disappears means its time. We patiently wait for this as it means the momentum may be changing.
• These are your early indicators—they scout the setup on the GO / NO GO DECISION.
• ❌ + triangle + trend = clean shot.
________________________________________
☁️ Avoid These Situations
• ❌ in a choppy/no-trend zone = false alarm. Don’t engage.
• Repeated black ❌s without a purple ❌confirmation = low conviction. Let it go.
________________________________________
________________________________________
🪖 Operator's Mindset
“You don’t chase trades. You stalk them. When the ❌ flashes, the system has found a target. What you do next is up to your discipline, your tools, and your plan.”
________________________________________
Note: This is a free version. Upcoming paid version includes multi-timeframes working together. Multiple strategies. Volatility meter. Make money and master the BB Gun so that you can elevate to the Snipers weapon.
🔒 Want More Firepower?
Upgraded version coming soon. Unlocks next-gen targeting tools:
• Multi-timeframe RSI intelligence in a live dashboard
• Precision-timed combo signals based on layered volatility + RSI logic
• Advanced trend filters, trade zone overlays, and sniper-level entry indicators
• Ideal for swing traders and options strategists who want clarity under pressure
💥 Budget-friendly. No subscription. Upgrade when you're ready to go Pro.
Tip: Make 4+ trades mastering this setup. Then use a small portion of the trades to gain more features. Always be in a position you cannot lose.
🆚 Why This Beats Standard RSI/BB Tools
Mission Feature Basic Indicators RSI Ribbon Lite
Trend Confirmation ❌ ✅ Ribbon Overlay
Multi-Timeframe Awareness ❌ ✅ 5-Timeframe RSI Grid
Volatility Confirmation ❌ ✅ Weighted ATR Scoring
Combo Signal Alerts ❌ ✅ ❌ Reentry Combo Alerts
TradingView Alerts ❌ ✅ Built-In Radar Ping
#rsi #bb #bollingerbands #hull ma #trend

MACD Indicator for 5 Min ScalpThis Indicator merges the 1 min MACD with BollingerBands to dedect a bigger than avarage tick on the Macd for the 5 min Scalping Strategy
You can change the length of the bollinger bands for the upper and lower channel individually so that you can get better signals
if a tick is bigger than avarage it will be colored, else it would be gray
this is the same indicator i used to get entrys in my 5 min scalping statagy, but i wouldnt just go in a trade when there is a bigger than usual tick. You have to look at other things to

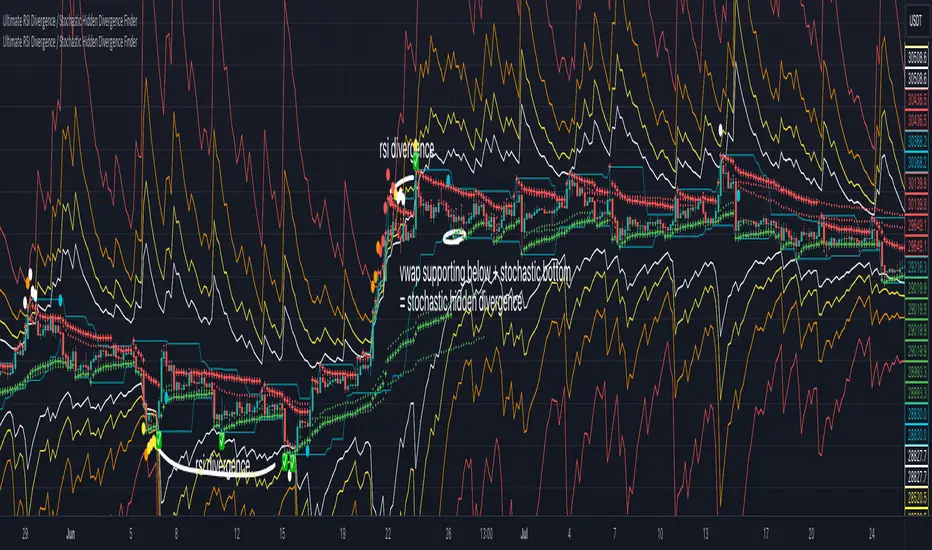
multi RSI channel for divergence / wave analysisThis is an indicator that will make analysis using RSI much easier!
This indicator is basically an RSI, that uses the concept of bollingerbands, and draws channel that corresponds with the real RSI value.
With this script, you will be able to
1.spot divergences visually, and much easier (rsi channel is set to 35/65-white 30/70-yellow 20/80-orange 15/85-red)
2.analyze the wave easier with the guidance of labels printed
For those people who use RSI alot, you will be able to use this indicator for spotting divergence scenarios before the divergence forms,
and with the multi-rsi channel & help of label, you will be able to visually know that the divergence has formed.
this indicator will help guide you to read RSI indicator much better, and I personally don't think that you need extra RSI indicator(default),
because this is much more intuitive, and you get all the benefits of RSI as well.
hope this helps someone like me who really wanted to use RSI channel more professionally!
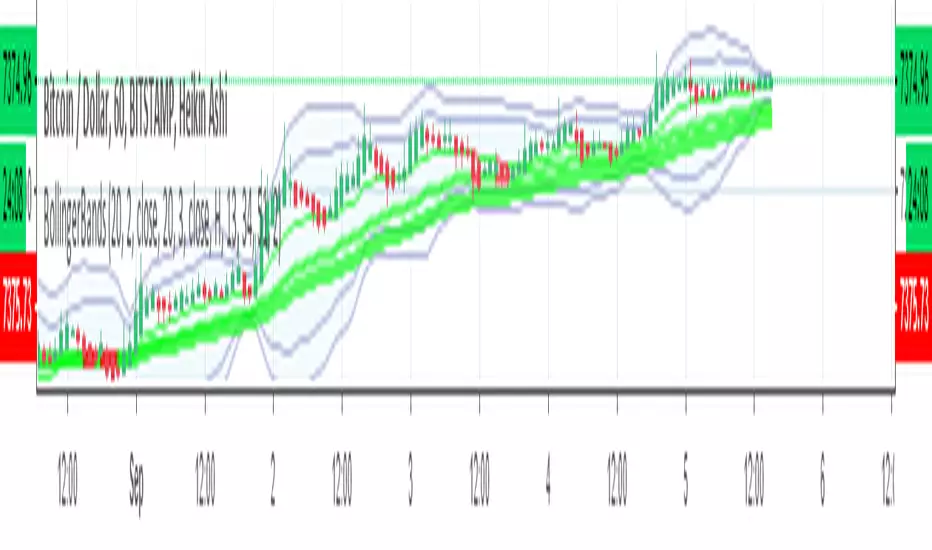
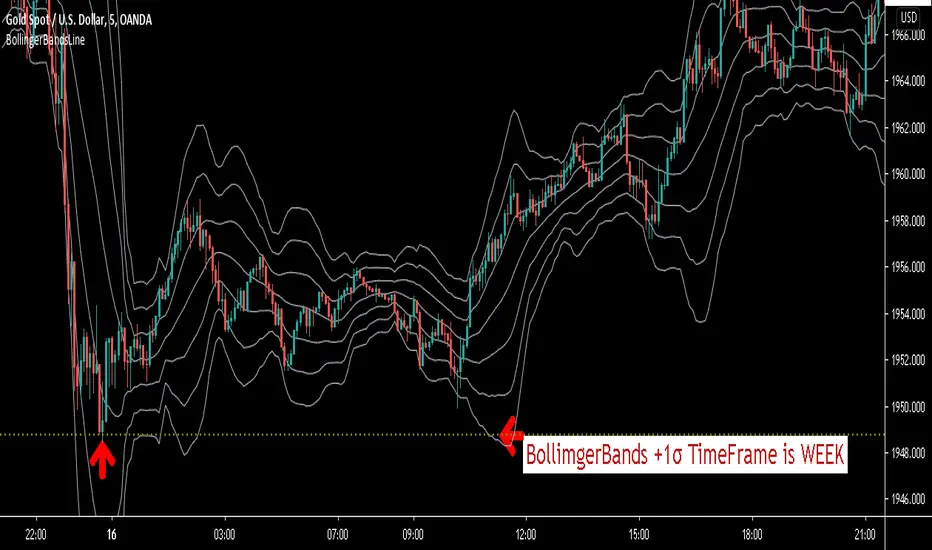
BollingerBandsLineThis script will display the price of Bollinger Bands .
For example.See the image above.
You can grasp the price of + 1σ on the weekly chart while looking at the five-minute chart.
You can know the existence of resistance.And you can get the sign of reversal.
This script can display the price of Bollinger Bands for each hour at the same time.
M5,M15,M30,H1,H4,DAY,WEEK,MONTH.
You can also display the price of the middle line for the specified period.
All lines can be changed in color.
You can also specify three Bollinger Bands deviations.
± 1σ is very important in Bollinger Bands .
Once the price goes out of ± 1σ, it may become a trend and start a bandwalk.
Conversely, if the price returns to within ± 1σ, the trend may reverse.
With a line drawn there, this script will help you trade.
If you are interested in the invitation-only indicator, please contact us on private chat.
The following is an explanation in Japanese.
通常のボリンジャーバンドのミドルラインと+1σ、-1σに加えて、
指定した2つの偏差のラインを表示できます。
※デフォルト設定ではミドルラインと±1σ、±2σ、±3σになっています。
5分足・15分足・30分足・1時間足・4時間足・日足・週足・月足のボリンジャーバンドの±1σ、及びミドルラインにリアルタイムで自動的にラインを引いてくれるインジケーターです。
好きな時間足のチャートを見ながら今、各時間足のボリンジャーバンド±1σ、及びミドルラインがどの位置にあるか把握することができます。
各時間足の±1σ、ミドルそれぞれラインの色を変更可能!
必要のない時間足の±1σ及びミドルラインのON・OFFが変更可能!
自分の見やすいようにお好みでアレンジできます!
TradingViewの設定で「インジケーター名ラベル」をオンにすれば、
この水平線がどの時間足のどこの水平線なのか説明が表示されます!
このインジケーターに興味がある方はプライベートチャットで連絡ください。
Vector Trinity I: Structure [VWAP-DBB] This indicator is **Part 1** of the "Vector Trinity" trading system—a comprehensive, data-driven framework designed to analyze market behavior through three distinct physical dimensions:
* **I: Structure (Space):** Defines the battlefield and volatility boundaries (Current Indicator).
* **II: Impulse (Time):** Identifies momentum ignition and energy release.
* **III: Flow (Energy):** Validates the move via volume and capital flow.
**2. Core Logic: Why Rolling VWAP?**
Most standard Bollinger Bands use a Simple Moving Average (SMA) as the centerline. The flaw in SMA is that it treats every candle equally, regardless of trading activity.
**Vector Trinity I** replaces the SMA with a **Rolling VWAP (Volume-Weighted Average Price)** over a rolling window (default 20).
* **Data Logic:** Price combined with Volume represents the true "cost basis" of the market.
* **Behavior:** The centerline becomes "sticky" during high-volume nodes and moves faster when real capital enters. It represents the *True Mean* of the market structure.
**3. The Dual-Band "Highway" Structure**
Instead of a single channel, this system utilizes a Double Bollinger Band (DBB) architecture based on Standard Deviations (StdDev) from the VWAP:
* **The Noise Zone (Basis to 1.0 StdDev):** The empty space in the middle. Price action here is often choppy and directionless.
* **The Acceleration Zone (1.0 to 2.0 StdDev):** The filled "Cloud." When candles close and stay within this zone, it indicates a strong trend (The Highway).
* **The Reversion Zone (> 2.0 StdDev):** Price is statistically extended and may revert to the mean.
**4. Volatility Squeeze Detection**
The indicator integrates a mechanical "Squeeze" detection based on the relationship between the Bollinger Bands (Variance) and Keltner Channels (ATR).
* **Squeeze ON (Orange Cloud & Dots):** Daily variance is at extreme lows. Energy is compressing. Do not trade direction; prepare for a breakout.
* **Squeeze OFF (Grey Cloud):** Expansion phase. Volatility is returning to the market.
**5. How to Use**
* **Step 1:** Observe the **Purple Line (VWAP)**. Its slope dictates the dominant trend structure.
* **Step 2:** Look for **Orange Zones**. This indicates a "Squeeze." Wait for the cloud to turn Grey.
* **Step 3:** Trade the breakout when price closes inside the "Acceleration Zone" (between the inner and outer bands) accompanied by Volume.
**Settings:**
* **Rolling Length:** 20 (Standard for swing/day trading).
* **Inner/Outer Bands:** 1.0 / 2.0 (The standard trend definition).
* **Squeeze Sensitivity:** 1.5 (Standard KC Multiplier).
---
### **中文说明**
**1. 简介:矢量三位一体系统 (Vector Trinity)**
本指标是“矢量三位一体”交易系统的 **第一部分**。这是一套基于数据逻辑的综合分析框架,旨在通过三个物理维度解构市场行为:
* **I: Structure 结构 (空间):** 定义价格运行的战场边界与波动率结构(本指标)。
* **II: Impulse 脉冲 (时间):** 识别动能的点火与能量释放。
* **III: Flow 流向 (能量):** 通过成交量与资金流验证突破的真伪。
**2. 核心逻辑:为什么要用 Rolling VWAP?**
传统的布林带使用简单移动平均线 (SMA) 作为中轨。SMA 的缺陷在于它平等地对待每一根 K 线,而忽略了成交量的权重。
**Vector Trinity I** 使用 **Rolling VWAP (滚动成交量加权平均价)** 替代了 SMA。
* **数据逻辑:** 只有结合了成交量的价格,才代表市场真实的“平均持仓成本”。
* **表现特征:** 在放量交易区,中轨会表现出更强的支撑/阻力特性;在缩量区则表现平滑。它代表了市场结构的*真实均值*。
**3. 双通道“高速公路”结构**
本系统不使用单条轨道,而是基于 VWAP 的标准差 (StdDev) 构建了双重布林带 (DBB) 架构:
* **噪音区 (中轨 到 1.0 标准差):** 中间的空白区域。在此区域内的价格通常是无方向的震荡。
* **加速区 (1.0 到 2.0 标准差):** 填充颜色的“云带”。当 K 线收盘并运行于此区域时,代表趋势确立,价格进入了“高速公路”。
* **回归区 (> 2.0 标准差):** 价格在统计学上过热,可能面临均值回归。
**4. 波动率挤压监测 (Squeeze)**
指标内置了基于布林带(方差)与肯特纳通道(ATR)对比的机械化“挤压”监测。
* **挤压状态 (橙色云带 & 底部圆点):** 每日方差处于极低值 (Variance at extreme lows)。市场正在积蓄能量。此时不应猜测方向,而应等待爆发。
* **扩张状态 (灰色云带):** 挤压结束,波动率回归,趋势展开。
**5. 使用方法**
* **第一步:** 观察 **紫色中轨 (VWAP)**。它的倾斜方向决定了主要的结构趋势。
* **第二步:** 寻找 **橙色区域**。这代表“挤压”正在发生。耐心等待云带变回灰色。
* **第三步:** 当价格突破并收盘在“加速区”(内轨与外轨之间)时,配合成交量介入交易。
**参数设置:**
* **Rolling Length (周期):** 20 (波段/日内交易的标准设置)。
* **Inner/Outer Bands (内外轨):** 1.0 / 2.0 (经典的趋势定义范围)。
* **Squeeze Sensitivity (敏感度):** 1.5 (标准肯特纳通道倍数)。

Trinity Bollinger Bands Pro with BreakoutsTrinity Bollinger Bands Pro Indicator
The **Trinity Bollinger Bands Pro + Triple Bands & Expansion** is a highly customized, advanced volatility and breakout indicator built on the classic Bollinger Bands framework. It expands the standard single-pair bands into **three independent deviation levels** (typically 1σ, 2σ, and 3σ) around a user-selectable moving average basis (default EMA 20). This creates clear "zones" of volatility, with dynamic trend-based coloring, layered fills, fixed-style labels, and a statistical volatility expansion detector shown as a directional background highlight in a separate pane. The result is a visually intuitive tool that helps traders identify consolidation, building momentum, confirmed trends, and rare explosive moves with high-probability filtering.
### Why It's Good and Different from Standard Indicators
This indicator stands out by addressing common limitations of traditional Bollinger Bands and multi-deviation scripts:
- **Layered statistical significance**: Unlike single (2σ) or basic double-band setups, it provides three distinct levels—early momentum (1σ), standard confirmation (2σ), and extreme/rare breakouts (3σ)—making it easier to stage trades progressively rather than relying on one ambiguous cross.
- **Trend-aware visuals**: Bands, basis, and fills change color based on price position relative to a separate trend MA, giving immediate bullish/bearish bias without needing additional indicators.
- **Clean, fixed labels**: Tiny, arrow-pointing labels ("1/2/3 SD Above/Below", "BB Basis") with consistent colors (purple upper, blue lower, yellow basis) provide instant identification
- **Statistical expansion detection**: Uses percentile ranking of band width "bell curve" concept" to identify abnormally high volatility, triggering directional background highlights (green bullish, red bearish) earlier than raw width spikes.
- **Reduced noise and fakeouts**: Tiered breakouts + expansion filter focus alerts on high-probability moves, unlike most BB scripts that flood signals on every touch.
Compared to popular public scripts (e.g., standard Bollinger Bands, Triple BB variants, or separate BBW Percentile tools), this combines everything into one cohesive indicator with superior visual clarity and statistical rigor.
### Key Features
- **Triple customizable bands**: Enable/disable and adjust multipliers for 1σ (early), 2σ (confirmed), 3σ (extreme) deviations.
- **Trend-based dynamic coloring**: Separate editable colors for each band set (bullish/bearish).
- **Layered zone fills**: Colored between bands with transparency, reflecting current trend.
- **Fixed tiny labels**: All left-pointing arrows with purple (upper), blue (lower), yellow (basis) backgrounds for quick reference.
- **Statistical expansion overlay**: with directional background (green/red) during extreme volatility expansions (earlier trigger using 2σ width).
- **Tiered alerts**: Early (Band 1), Confirmed (Band 2), Extreme (Band 3), High-Probability (Extreme + expansion), and general expansion alerts.
- **Fully configurable basis**: Length, type (SMA/EMA/WMA/RMA), and thin fixed lines for minimal clutter.
### How Traders Can Use It
- **Spot squeezes and breakouts**: Watch for tight bands (low width) → expansion background → price closing outside Band 1 (early entry), Band 2 (add/confirm), Band 3 (strong trend conviction).
- **Filter fakeouts**: Only act on crosses accompanied by expansion background color matching trend direction—dramatically reduces whipsaws.
- **Trend riding**: Price "walking" colored bands (e.g., hugging upper purple-label bands in green background = strong bullish momentum).
- **Scalping/intraday**: On lower timeframes (e.g., 10min), use early Band 1 signals with expansion for quick moves.
- **Swing/position trading**: Wait for Band 3 extreme breakout + colored background for higher-probability, larger moves.
- **Risk management**: Place stops near basis or inner band; trail using outer bands during expansions.
Overall, this indicator excels at turning volatility into actionable, staged signals with visual simplicity—ideal for traders seeking an edge in identifying real explosive trends over noise. It's particularly powerful on volatile stocks like AMD/INTC or indices during news/events.

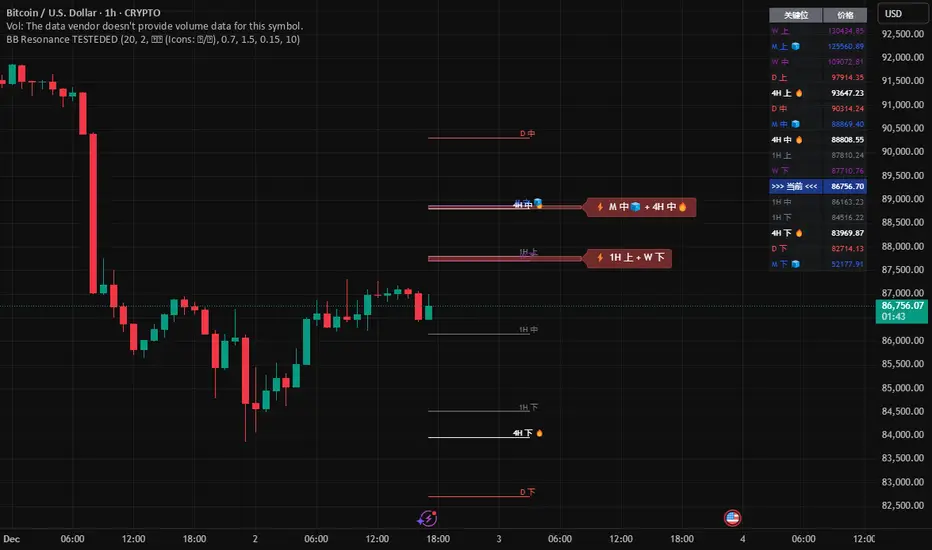
Global BB Resonance [by TESTEDED]📈 Global BB Resonance Hunter
1. Design Philosophy: Dimensional Reduction
In modern trading, "Information Overload" is the enemy. Traders often clutter their charts with 15+ Bollinger Band lines across 1H, 4H, Daily, and Weekly timeframes, resulting in a "spaghetti chart" that is impossible to read quickly.
The core logic of this indicator is "Dimensional Reduction." Instead of drawing every single line, this script runs a background algorithm to detect "Confluence" (Resonance).
The Thesis: A single Bollinger line (e.g., 1H Upper) is easily broken. However, when multiple dimensions overlap (e.g., 1H Upper + Daily Mid + Weekly Low) at the exact same price level, a "Market Consensus" is formed. These are the critical "Walls" of the market.
The Solution: We sort all data by Price, not Time. If lines cluster together within a specific threshold (e.g., 0.15%), the script draws a single Resonance Box instead of multiple confusing lines.
2. Key Features
🛡️ Multi-Timeframe Monitoring: Simultaneously monitors 1H, 4H, Daily, Weekly, and Monthly Bollinger Bands in the background, regardless of your chart's current timeframe.
⚡ Smart Resonance Detection: Automatically groups overlapping levels into "Resonance Boxes."
⚡ (2-Line Confluence): Watch closely.
⚡⚡ (3-Line Confluence): Strong Support/Resistance.
⚡⚡⚡ (4+ Lines): "Iron Wall" Resonance.
📊 Volatility State Perception: Detects if the bands are Squeezing (accumulating energy) or Expanding (trending).
Style Options: Choose between Icons (🧊/🔥) or Geek Symbols (>.< / <^>).
🧘 Focus Mode (Sniper View): A unique feature that hides all individual lines, leaving only the Resonance Boxes and the Dashboard. This keeps your chart clean and distraction-free.
🔔 Smart Alerts: Get notified immediately when Price touches a Resonance Box or when a Squeeze occurs.
3. Visual Guide
A. The Symbols (State Indicators)
You can switch styles in the settings.
B. The Resonance Boxes
Red Box: Resistance Zone (Above Price).
Green Box: Support Zone (Below Price).
Label: E.g., ⚡⚡ 1H Up + D Mid. This tells you exactly which levels are overlapping.
4. Usage Strategy
The "Reversal" Setup: Look for a Green Resonance Box below price with High Confluence (⚡⚡). Ensure the state is NOT Expanding (<^> or 🔥).
The "Breakout" Setup: Look for the Squeeze Symbol (>.< or 🧊) on the dashboard. If price approaches a Resonance Box while Squeezing, expect a breakout.
The "Sniper" Method: Turn on Focus Mode. Set Alerts. Only look at the chart when price hits a "Wall."
How to use: youtu.be
📈 布林带多维共振捕猎者
1. 设计哲学:降维打击
在现代交易中,“信息过载”是最大的敌人。交易者经常在图表上叠加 1H、4H、日线、周线等 15 条以上的布林带线条,导致图表像“盘丝洞”一样难以阅读。
本指标的核心逻辑是“降维打击”与“数据可视化”。 我们不再画出每一条线,而是在后台运行算法来捕捉**“共振”(Confluence)**。
核心理念:单一周期的布林线(如 1H 上轨)很容易被刺破。但是,当多个维度的力量(如 1H 上轨 + 日线中轨 + 周线下轨)在同一个价格水平重叠时,就形成了**“市场合力”**。这些位置才是市场真正的“铜墙铁壁”。
解决方案:系统按价格而非时间对数据进行排序。如果多条线在特定阈值(如 0.15%)内聚集,脚本会画出一个**“共振框”**,而不是无数条混乱的线。
2. 核心功能
🛡️ 全维幽灵监控:无论当前图表周期如何,脚本都会在后台实时监控 1H, 4H, 日线, 周线, 月线 的数据。
⚡ 智能共振雷达:自动检测并合并重叠的关键位。
⚡ (2线共振):值得关注。
⚡⚡ (3线共振):强力支撑/阻力。
⚡⚡⚡ (4线以上):核弹级/铁壁共振。
📊 波动率状态感知:自动识别布林带是处于 挤压蓄势 还是 扩张爆发 阶段。
风格切换:支持 图标模式 (🧊/🔥) 或 极客符号模式 (>.< / <^>)。
🧘 专注模式 (Focus Mode):一键隐藏所有单线,只保留共振框和仪表盘。让您的图表瞬间清空,像狙击手一样只关注目标。
🔔 智能警报:当价格触及共振框,或出现极度压缩信号时,立即发送警报。
3. 视觉指南
A. 状态符号说明
您可以在设置中切换显示风格。
B. 共振框说明
红色方框:上方阻力区 (Resistance)。
绿色方框:下方支撑区 (Support)。
标签示例:⚡⚡ 1H Up + D Mid —— 明确告知您是哪几条线发生了共振。
4. 实战策略
“反转”交易:寻找价格下方的绿色共振框,且具有高星级 (⚡⚡)。前提是当前状态不是扩张状态 (<^> 或 🔥)。
“突破”交易:在仪表盘上看到 挤压符号 (>.< 或 🧊)。如果价格在挤压状态下逼近共振框,不要逆势阻挡,大概率会发生强力突破。
“狙击”模式:开启 专注模式。设置好警报。不要盯着 K 线波动,直到价格撞上“墙壁”触发警报时再介入。
使用说明: youtu.be