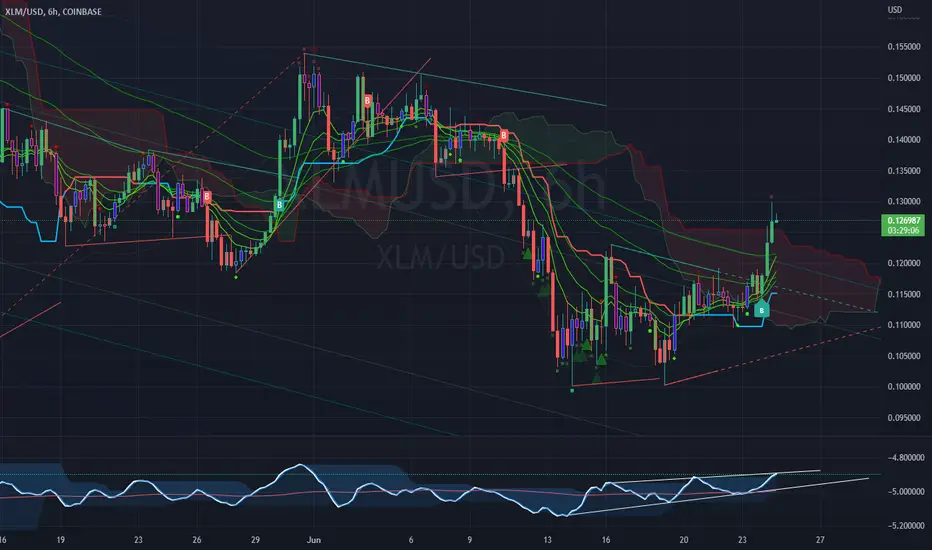
RVL Unreal Edge (concept build)Designed with a purpose, this script was intended for use by bots automating trading of XLM using a 6hr timeframe.
However the script has turned out to be a fantastic indicator on its own, and much of the power behind it is derived from John Ehler's incredible CG oscillator.
John Ehler was an electrical engineer, a Raytheon employee who began trading in the 1970's. He is best known for his work creating super-smoothing algorithms and methods of analysing cycle length and behaviour in price action, and his work in the field of zero-lag indicators - indicators that don't follow the price action, but are in fact capable of leading it actionably, and responding with essentially zero lag.
By approaching the price action as a sine wave with demonstrably a fractal nature, Ehler's makes a number of important advancements. His CG indicator is derived from calculations typically used to derive the centre of gravity in a physical object. It effectively works as a band-pass filter and is possibly one of the very best leading indicators avaliable.
Cerca negli script per "bot"
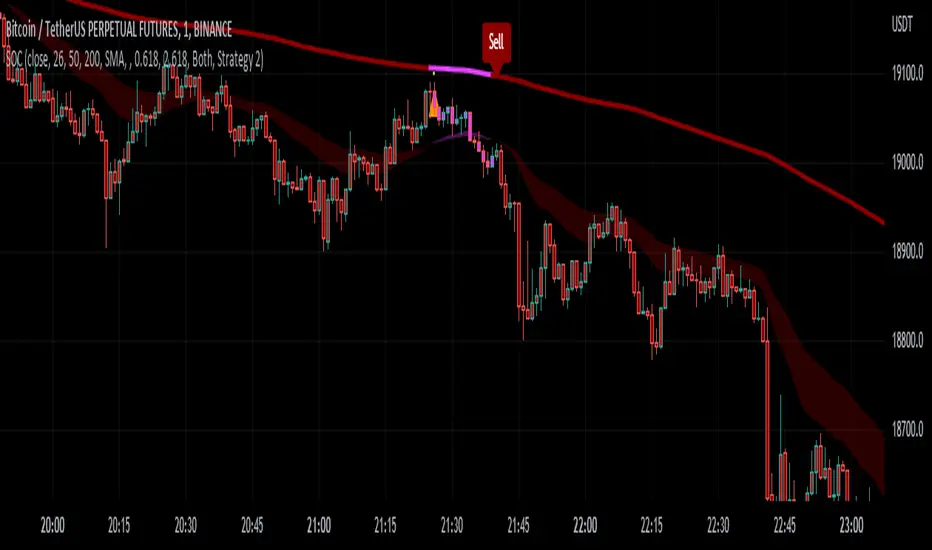
Sherry on cryptoIf the price is above the 200 EMA, you are allowed to open only long positions and avoid shorts.
If the price is below the 200 EMA, you are allowed to open only short position and avoid longs. Don't use this indicator alone, use RSI, Stochastic RSI etc. Do not use this indicator like a bot, do TA and FA as well. This is just an indicator, do not always rely on it. It requires experience. This indicator has different winrate in different timeframes. Set its value accordingly.
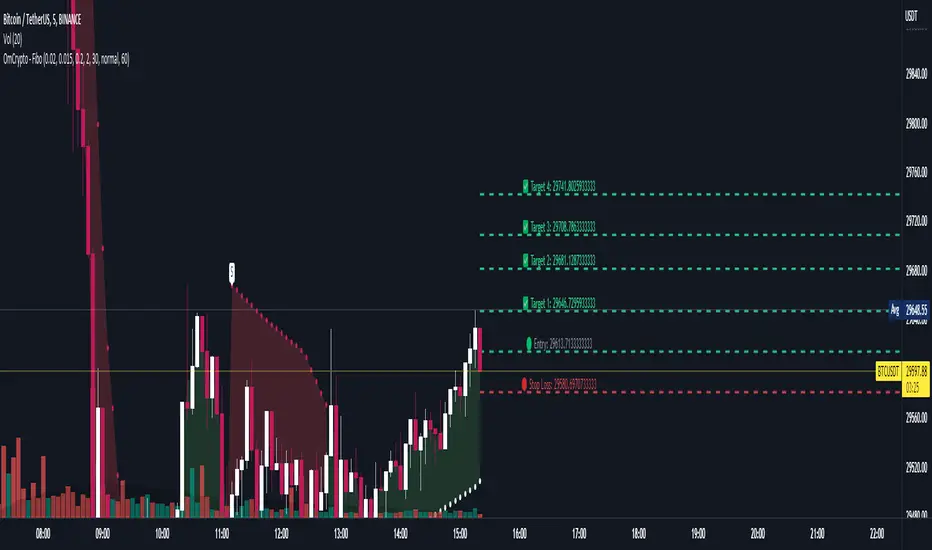
OmCrypto - PSAR with TargetOmCrypto - PSAR with Target
This script uses PSAR as it's main buy and sell signal with automatic target to take profit, entry and stop loss
It also supports alert so you can use it for bots
You can set your own period (timeframe) for the target lines in settings, default is 60 minutes (1h)
Honest Algo PremiumThis toolkit is a collection of innovative indicators, carefully designed to be as user friendly as possible. Get access to a collection of all the best we can offer in one indicator.
Providing Multiple Trading Styles
Our toolkit works in any market but has been specifically designed for Bitcoin and Forex.
Detect the direction of the trend using an algorithm based on our bounce manager ATR consolidation filtering
Find bounces from a handful of different pre-determined lines, the include a 20 period EMA, a supertrend, a T3 moving average and kijun-sen
Detect Rob Smith #thestrat entries
Filter out noise with our environment filters
and much more. (Check the changelog below for future additions)
If you want more information on how the price action entries of Rob Smith #thestrat work, there are many tutorials on the internet.
When using Rob Smith #thestrat entries the indicator uses bounce manager with a 200 period EMA for trend based bar coloring.
A quick explanation how it finds bounces from these lines:
Filter signals based on timeframe continuity
Timeframe continuity is a method of market analysis where you look if multiple different timeframe charts are in the same direction.
For example:
default settings we are in bull territory when the yearly, the quarterly, the monthly and the weekly candle all are green.
default settings we are in bear territory when the yearly, the quarterly, the monthly and the weekly candle all are red.
We provided multiple presets but it is recommended to use the standard preset, timeframe continuity is the strongest when using higher timeframes.
Filter signals based on market environment
We realised that trading long or short in an environment with no resistances increased our algorithms success rate.
How the algorithm does this:
1: See which timeframes the user has selected as a filter, on default these are:
Needs to be outside timeframe 1 (yearly), false
Needs to be outside timeframe 2 (quarterly), false
Needs to be outside timeframe 3 (monthly), true
2: Check if our closing price is above those timeframes previous candle high or below previous candle low.
This in combination with timeframe continuity gives a great tool to find the sentiment of the market and trade in the direction of the market.
Turn on autopilot using our signals
This tool is not made to do all decisions for you and requires a manager (you). The basic strategy using the #thestrat preset is to scale into positions on the 4H or higher timeframe, whenever a signal is fired you add to your position and as trend keeps developing the tool will keep adding to your positions.
A good manager knows risk management and does not use a very large position size per entry and builds a position over time.
We recommend you use a timeframe of 4H or higher and diversify over multiple assets. The indicator works best on assets that overtime have created long lasting trends.
Examples of perfect coins to use this on.
We know traders love clean looking charts
This is wy we added some popular indicators to our toolkit, these you can find on tradingview for free but we added them into our toolkit using our color theme, you can find these in the settings under (extra tools).
We also added an option to display bounce source, this is the source line some of our signal presets use to find bounces from using preset bounce manager parameter.

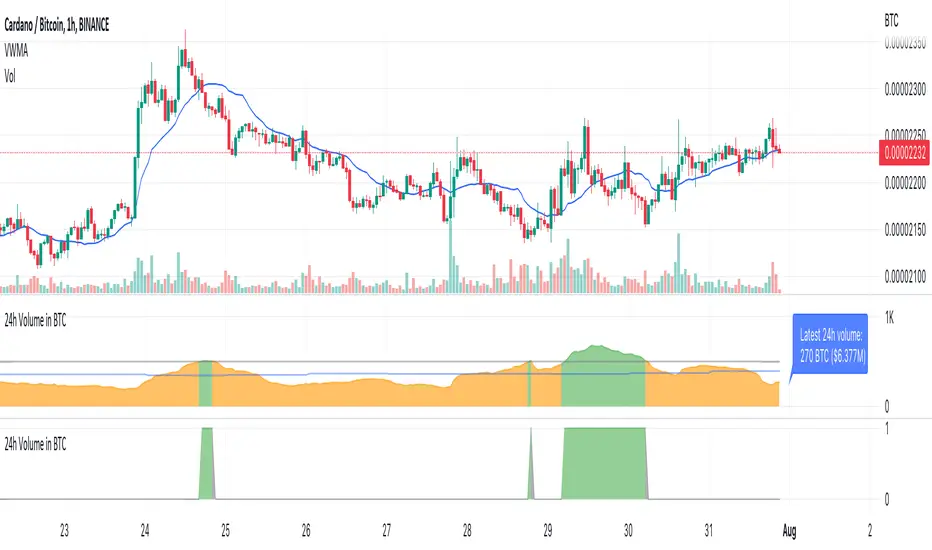
TTP Volume in BTCThis indicator shows you the volume of the last 24 hours of the current asset converted into BTC
The classic way to measure volume is by the base units of the asset itself being bought and sold in the selected timeframe. When trading crypto with bots it can be useful to filter out which assets/altcoins to trade by analysing the 24 hours-volume of the asset converted into Bitcoin instead of in the asset itself. By using Volume in BTC as a reference between assets you can rate and identify key levels of volume using the same reference and identify if an assets has enough liquidity for your personal requirements. You can also ensure assets are only traded when the volume is above your set threshold if you set this in your bots.
The volume is measured from the sum of the last 24 hourly closed candles multiplied with the average price during this period → 24h Vol * VWMA (Volume Weighted Moving Average).
What it does?
Measures the asset volume for the last 24 hrs converted to BTC
Regardless of chart timeframe it always shows you the last 24 hrs volume
Does not repaint, it uses only confirmed data by candle close
Shows the latest 24 hours of volume in BTC counted from the bar
Shows the latest 24 hours volume in BTC and USD as a label on the latest bar
It is color coded to show when it’s above or below your threshold visually
How to use it?
Use the Volume Threshold to identify periods when the volume is above or below your threshold
Set alerts to get alerted when the volume crosses your threshold in either direction
AMASling - All Moving Average Sling ShotThis indicator modifies the SlingShot System by Chris Moody to allow it to be based on 'any' Fast and Slow moving average pair. Open Long / Close Long / Open Short / Close Short alerts can be generated for automated bot trading based on the SlingShot strategy:
• Conservative Entry = Fast MA above Slow MA, and previous bar close below Fast MA, and current price above Fast MA
• Conservative Entry = Fast MA below Slow MA, and previous bar close above Fast MA, and current price below Fast MA
• Aggressive Entry = Fast MA above Slow MA, and price below Fast MA
• Aggressive Exit = Fast MA below Slow MA, and price above Fast MA
Entries and exits can also be made based on moving average crossovers, I initially put this in to make it easy to compare to a more standard strategy, but upon backtesting combining crossovers with the SlingShot appeared to produce better results on some charts.
Alerts can also be filtered to allow long deals only when the fast moving average is above the slow moving average (uptrend) and short deals only when the fast moving average is below the slow moving averages (downtrend).
If you have a strategy that can buy based on External Indicators you can use the 'Backtest Signal' which plots the values set in the 'Long / Short Signals' section.
The Fast, Slow and Signal Moving Averages can be set to:
• Simple Moving Average (SMA)
• Exponential Moving Average (EMA)
• Weighted Moving Average (WMA)
• Volume-Weighted Moving Average (VWMA)
• Hull Moving Average (HMA)
• Exponentially Weighted Moving Average (RMA) (SMMA)
• Linear regression curve Moving Average (LSMA)
• Double EMA (DEMA)
• Double SMA (DSMA)
• Double WMA (DWMA)
• Double RMA (DRMA)
• Triple EMA (TEMA)
• Triple SMA (TSMA)
• Triple WMA (TWMA)
• Triple RMA (TRMA)
• Symmetrically Weighted Moving Average (SWMA) ** length does not apply **
• Arnaud Legoux Moving Average (ALMA)
• Variable Index Dynamic Average (VIDYA)
• Fractal Adaptive Moving Average (FRAMA)
'Backtest Signal' and 'Deal State' are plotted to display.none, so change the Style Settings for the chart if you need to see them for testing.
Yes I did choose the name because 'It's Amasling!'

Trend Friend - Swing Trade & Scalp Signals - Stocks Crypto ForexTREND FRIEND is a custom built, data driven algorithm that gives buy and sell signals when many different factors line up together on a single candle. It is designed to catch every move so you can expect early entries and exits across all of your favorite markets. Use scalp mode for early entries with lots of signals or swing mode for longer swings with fewer signals and long swing mode for really long swing trades with even less signals.
The best markets to use this indicator on are high volume tickers with a lot of price action as these markets have enough data to use to give the signals the algo needs to be able to detect highly probable moves in price. That being said, it works across all markets such as stocks, crypto, forex and futures and across all timeframes(on really long timeframes it may not give signals due to not having enough data to work with).
***MAJOR POINTS TO REMEMBER BEFORE USING THIS INDICATOR***
The algo is designed to catch major moves, so if a signal seems to come in late, it is highly likely the market is about to reverse so use caution when taking signals that seem late. This typically happens because the market is indecisive so always be careful in these situations and just wait for a better signal when markets are really decisive.
Always trade in the direction of the trend meaning the volume weighted moving average clouds. There is also a trend detection label and risk level label that you should follow to keep your trades as safe as possible. The safest way to do this is only trade short when the VWMA 100 is below the VWMA 500 and a Bear signal comes in very close to a VWMA line. Only trade long when the VWMA 100 is above the VWMA 500 and a Bull signal comes in very close to a VWMA line.
If price is between the moving averages, play the VWMA 100 and VWMA 500 as support and resistance and only take signals near one of the VWMAs with the plan of price returning to the other VWMA. If you are taking trades against the trend, like trying to buy the dips or sell the tops, wait for price to cross the VWMA 100 before following a signal.
If the VWMA 100 and VWMA 500 are close to each other and/or moving sideways, you can expect choppy price action and consolidation so use caution when taking trades during this time. It is better to wait for the price to hold above or below both VWMAs and stay supportive there before taking trades. Waiting for volume to increase is also a good way to avoid chop after the trend decides a direction.
This indicator will repaint sometimes before the candle has closed, so either wait for the candle to close with a signal before entering trades or only take signals before it closes on candles with good volume and technical analysis backing it.
***ALL THE FEATURES YOU NEED***
Trend Friend has multiple features designed to help you trade better and make decisions faster.
Buy & Sell Signals - When the algo detects all of our required parameters lining up on a single candle, Trend Friend will give Bull or Bear signals on the chart. Bull means upward price action is expected. Bear means downward price action is expected.
Take Profit Signals - When the price action makes a move that typically signals a reversal, a take profit signal will show up on the chart to help you get out of a trade before the next signal comes in.
Risk Levels For Signals
There is a risk detection system that tells you how risky each signal is as it comes in to help you stay out of dangerous trades. Wait for signals with low risk and you’ll be much safer than trying to take trades against the trend.
Alerts - There are options for alerts on buy signals, sell signals, take profit signals, price crossing the VWMA 100 and price crossing the VWMA 500. All of these can be controlled using tradingview alerts so you don't have to watch the charts and wait for things to happen. These alerts can also be used to send orders to trading bots if you choose.
Candles Painted Green Or Red According To Buy & Sell Pressure - By default, this indicator paints the candle sticks green, red or blue according to buy & sell pressure(DMI). You will need to turn off candle colors in your chart settings for this to appear correctly.
Percentage Updates - The table on the right has live percentage updates so you don’t have to measure out every move you are expecting. It will tell you the percentage from closest fibonacci levels, percentage away from the VWAP, percent gain or loss from the last signal entry and percentages from your own trades that can be configured in the settings. These help you always know how much more you can squeeze out of a trade and where your position stands without having to switch screens between Tradingview and your broker constantly.
Moving Average & VWAP Clouds - We included two color coded volume weighted moving averages(VWMA 100 and VWMA 500) and a color coded RMA 10 moving average. We also have a VWAP dotted line and cloud so you can easily see the trend direction on the chart at all times. The cloud and moving averages will turn green or red in real time depending on whether price is above or below each moving average or the VWAP respectively.
Trend Detection Label - The top label on the percentage update table tells you if the trend for this timeframe is Bullish or Bearish as well as when the trend is undecisive with choppy price action expected.
Chop & Low Volume Warning Labels - When price action is choppy or there is very low volume compared to historic candles, a warning label will appear at the top of the screen so you know to use caution and stay out of trades during these times.
Auto Fibonacci Levels - The chart will automatically populate fibonacci retracement and extension levels. The percentage update table will also give you real time updates on how far away the next fibonacci levels are from the current price.
Bounce Zone - We also included a very long term moving average cloud(EMA 1000 and EMA 2000) that shows as purple on the chart. When price enters that cloud, you can expect a reversal in that area. If price was trending above the cloud, expect that cloud to act as support. If price was trending below the cloud, expect that cloud to act as resistance. When price is trying to break through that cloud in either direction you can expect price action to be choppy and big moves to happen once price gets supportive in that zone and breaks out.
Margin Multiplier - If you are using margin to trade, our margin multiplier will multiply all of the percentage updates by the margin level you input in the settings tab so your percentages will reflect the percentages in your account.
***HOW TO USE***
Scalp, Swing And Long Swing Mode
You can choose from scalp mode, swing mode or long swing mode in the indicator settings. It is set to scalp mode by default. Scalpers will want to use the scalp mode as it provides early entries and exits and is designed to catch every move quickly. Swing mode is designed to catch almost every move and filter out some of the noise so it will have less signals than scalp mode. Long swing mode is designed to catch those lengthy moves and will hold positions the longest but give entries later than the other modes.
Try all three on a few charts and timeframes to see which setting matches your trading style the best. If you want more signals with any of the 3 modes, go to a lower timeframe. If you want less signals on any mode, go to a higher timeframe.
Bull & Bear Signals - When all of our algo parameters line up, a BULL or BEAR label will print on the chart. Bull labels will be colored green and bear labels will be colored red. Bull indicates a good place to enter a long trade because the algo is detecting patterns that indicate price should move upwards. Bear indicates a good place to enter a short trade because the algo is detecting patterns that indicate price should move downwards.
For best results using these signals, take trade signals that line up very closely with fibonacci levels or volume weighted moving averages or the vwap or any combination of them. It is also recommended to only take trades in the direction of the trend to avoid trading false reversals. Wait for low risk signals using our risk identifier and then enter the market. Waiting for good volume to come in will also help you avoid chop and catch those quick moves.
Also, make sure to check the percentage updates table to see if the expected move to the next fibonacci level is far enough away to make the risk to reward ratio worth taking the trade. Watch for signals when the VWMAs squeeze together after a wide gap and price breaks out with a corresponding signal as these can bring large, quick moves in price. Use caution when the VWMAs are close to each other and trending sideways as this usually brings choppy price action.
(The bull and bear signals can be turned on or off in the indicator settings input tab. Useful if you want to clean up the chart or only show bear or bull signals according to the trend.)
Take profit Signals - Take profit labels will show up on the chart when a reversal candle pattern or reversal indicator pattern is detected while a trade is still open. Use these signals as times that it may be a good point to exit the trade to avoid losses or reduced profits.
(The take profit signals can be turned on or off in the indicator settings input tab.)
Risk Level Label
Taking trades against the trend is dangerous because there are more false bottoms than there are actual bottoms. Our risk detection label is there to keep you from taking dangerous trades against the trend. The label will say Low Risk when the trend is in the same direction as the last signal given. The label will say Medium Risk when the trend is neutral because price likes to chop around during these times. The label will say High Risk when the trend is in the opposite direction as the last signal given.
Make sure you wait for the risk level detector to show Low Risk before taking trades or you may be buying a false bottom.
Candles Colored According To Buy & Sell Pressure - By default this indicator will paint the candlesticks green, red or blue depending on the buy & sell pressure for those candles using the Directional Movement Index or DMI. If buy pressure is higher than sell pressure, it will paint green. If Sell pressure is higher than buy pressure, it will paint red. If buy pressure is equal to sell pressure, it will paint blue. Use this to confirm which direction buying and selling is favoring and use a change in color trend to determine reversal points early. For this to work correctly you will need to go into chart settings(gear icon top right) and in the symbol tab turn off body, wicks and border.
(The buy & sell pressure candle coloring can be turned on or off in the indicator settings input tab.)
Auto Fibonacci - This indicator will automatically populate fibonacci retracement and extension levels for you. These levels are calculated using the previous high and low. You can switch the source between the previous day, week, month, quarter and year(the weekly setting is the default as it is great for day trading). The previous high and low levels will show as white(These are very important levels so watch for price to bounce off of the white lines). The percentage update table will also show the percentage gap from the current price and the next closest fibonacci level above and below, with labels telling you which fib levels they are.
(The fibonacci levels can be turned on or off in the indicator settings input tab.)
Volume Weighted Moving Averages With Clouds - The red or green moving averages should be treated as dynamic support and resistance as well as a visual way of telling current price trends. You can expect price to bounce off of these moving averages very often and quick moves usually happen when price breaks out of these moving averages.
The safest long trades you can take will be when the VWMA 100 is above the VWMA 500 and you get a BULL signal that is very close to the VWMA 100 or VWMA 500. The safest short trades you can take will be when the VWMA 100 is below the VWMA 500 and you get a BEAR signal that is very close to the VWMA 100 or VWMA 500.
When the moving averages squeeze together and price bounces between them, you can expect big moves in price when it breaks out. If price has been trending up and the moving averages squeeze together, expect the price to fall quickly once it breaks down from there. If price has been trending down and the moving averages squeeze together, expect the price to jump quickly once it breaks out from there.
These moving averages and the clouds associated with them will paint green when price is above them, indicating a bullish trend and they will change to red when price is below the moving averages, indicating a bearish trend.
You can also use the moving averages as support and resistance levels when markets are moving sideways. Since these are volume weighted moving averages, price tends to stick to them very well and paints a much clearer picture of what is going to happen than regular moving averages that don't take volume into account. Try it on a bunch of different timeframes and charts to see for yourself.
(The moving averages and clouds can be turned on or off in the indicator settings input tab.)
Bounce Zone - The bounce zone is a purple cloud that is made up of two very long term moving averages. When price is trending above this cloud and comes back down to it, you can expect the price to bounce back upwards in this zone. If the price is trending below this cloud and comes up to it, you can expect the price to bounce back downwards when it reaches this zone.
Sometimes price will break through this cloud and you will usually notice a lot of choppy price action and accumulation in this zone. When price does break out of it, you can expect fast, large moves. I also like to call this zone the safe zone because taking trades in this zone is typically a very safe place to enter trades depending on how the price is trending before it entered this zone. If you look at the cloud on any of your favorite charts, you will see that the cloud usually represents support and resistance areas quite well.
(The bounce zone can be turned on or off in the indicator settings input tab.)
Chop & Low Volume Warnings - When price is choppy, it can be a portfolio killer. When volume is low, it can give false signals or the market can reverse easily, so stay out of trades when these warning labels appear on your chart. If you were already in a trade when these warnings appear, keep a close eye on your trades and be ready to exit if things start to go the wrong way.
Long & Short Entry Calculator - Here you can enter your own entry price for short or long positions so that your actual P&L will be shown live on your chart. This eliminates the need to calculate percentages in your head or switch screens to your broker often or use the measuring tool to calculate your P&L. These will show as zero until a trade price is entered.
Margin Multiplier - If you use margin to trade, enter your margin multiplier in this input and all of the percentages in the percentage update table will reflect how far each level is based on your margin. So a 5x margin will multiply all percentages in the chart by 5 and so on. This way you don’t have to calculate everything in your head or switch between your chart and your broker constantly.
Customization - Go into the indicator settings and you can customize just about everything to suit your style. In the Input tab you can: turn the Bull or Bear labels off or on so you only get the signals that are going in the direction of the trend, turn on or off the moving average lines & clouds, turn on or off the vwap & clouds, set your fibonacci timeframe or turn them off completely and set your long or short entry price as well as your margin level for percentage updates according to your portfolio.
You can also easily customize: the moving average lines & clouds, the bounce zone lines and cloud, the vwap color and line style, the support and resistance line colors and thickness, the bull and bear label styles, the take profit label styles and more.
***MARKETS***
This indicator can be used as a signal on all markets, including stocks, crypto, futures and forex as long as Tradingview has enough data to support the calculations needed by the algo.
***TIMEFRAMES***
Trend Friend can be used on all timeframes.
***IMPORTANT NOTES***
For the buy & sell pressure colored candles to show up properly you will need to go to the chart settings(gear icon in top right corner) and in the symbol tab turn off body, wicks and border.
No indicator can be right 100% of the time and remember that past results do not guarantee future performance. You still need to make smart decisions when using this indicator to be successful. It is also important to note that markets with little volume and price action may not give very good signals due to many different parameters needing to line up on one candle for a signal to be given so use it on high volume tickers with lots of price action for best results.
***TIPS***
Try using numerous indicators of ours on your chart so you can instantly see the bullish or bearish trend of multiple indicators in real time without having to analyze the data. Some of our favorites are our Volume Spikes, Directional Movement Index + Fisher, Volume Profile with DMI, and MOM + MFI + RSI with Trend Friend. They all have real time Bullish and Bearish labels as well so you can immediately understand each indicator's trend.

Level 1 - Learn to code simply - PineScriptThe goal of this script is honestly to help everyone learn about trading with bots and algos.
At least, to get started.
Level 1:
10 lines of code.
learn to plot 2 moving averages on your chart.
learn to create a signal from a crossover.
learn the very basics of Pine Script algo.

Bounce Manager TrendlinesThe trendline script is made for manual input of trendlines using point clicks on the chart. The script will then see if price respects these lines by the parameters you input in settings panel. On a respectable bounce it will print buy/sell arrows. The script also has functionality to send alerts, this is helpful if you want to automate trendlines . I created this script and many others under the bounce manager toolkit to expand on the signalling capabilities of popular drawing tools as I find using just a crossover to be lacking especialy for full automation.
components:
- Line respect: When price moves past this the script will no longer look for entry until a new trend has been established. The line can also be used as a stop loss.
- Confirmation: When price touches the line during a trend it
will wait to cross over this line to confirm a reaction from the line.
- Consolidation filter: A trend filtering system, this is a distance from
the line price has to break to confirm trend direction.
- Stop loss: This can be set to a percentage distance from the low after
bounce. Or it can be set to the line respect line
- Take profit: This can be a fixed take profit target or a risk to reward
based take profit. With risk to reward it will multiply the stop loss
distance by the input and use that to create target (green cross)
- ATR based or % based: there are 2 versions of the script, one for strict
percentage based logic and another one based on ATR values
If you are having problems figuring out which settings to use I recommend you check the Bounce Manager ATR script for reference as this script plots the components:
Zignaly automation settings:
zignaly integration, you can use the settings panel to decide your risk management. Option to use a fixed take profit % or an automatic risk to reward calculation based on the stop loss. Stop loss can get calculated using the max violation setting as a stop loss (this will put stop loss below line respect level) or when not checked it will use 0.01% below the low of the signal candle as stop loss. Just add your zignaly private key in the settings and use any alert function call as alert. Make sure to use zignaly.com as your webhook url.
If 5 trendlines are not enough use the 20 line input version, this script is for the clean strong trendline trader.
Part of the Honest Algo indicator suite

Bounce Manager 20 TrendlinesThe trendline script is made for manual input of trendlines using point clicks on the chart. The script will then see if price respects these lines by the parameters you input in settings panel. On a respectable bounce it will print buy/sell arrows. The script also has functionality to send alerts, this is helpful if you want to automate trendlines. I created this script and many others under the bounce manager toolkit to expand on the signalling capabilities of popular drawing tools as I find using just a crossover to be lacking especialy for full automation.
components:
- Line respect: When price moves past this the script will no longer look for entry until a new trend has been established. The line can also be used as a stop loss.
- Confirmation: When price touches the line during a trend it
will wait to cross over this line to confirm a reaction from the line.
- Consolidation filter: A trend filtering system, this is a distance from
the line price has to break to confirm trend direction.
- Stop loss: This can be set to a percentage distance from the low after
bounce. Or it can be set to the line respect line
- Take profit: This can be a fixed take profit target or a risk to reward
based take profit. With risk to reward it will multiply the stop loss
distance by the input and use that to create target (green cross)
- ATR based or % based: there are 2 versions of the script, one for strict
percentage based logic and another one based on ATR values
If you are having problems figuring out which settings to use I recommend you check the Bounce Manager ATR script for reference as this script plots the components:
Zignaly automation settings:
zignaly integration, you can use the settings panel to decide your risk management. Option to use a fixed take profit % or an automatic risk to reward calculation based on the stop loss. Stop loss can get calculated using the max violation setting as a stop loss (this will put stop loss below line respect level) or when not checked it will use 0.01% below the low of the signal candle as stop loss. Just add your zignaly private key in the settings and use any alert function call as alert. Make sure to use zignaly.com as your webhook url.
The trendlines you see in preview are based on a long term pitchfork on BTCUSDT 10H chart
If 20 trendlines are too much I will be releasing a 5 line input version, this script is more to be used to automate pitchforks, gann boxes etc.
Part of the Honest Algo indicator suite

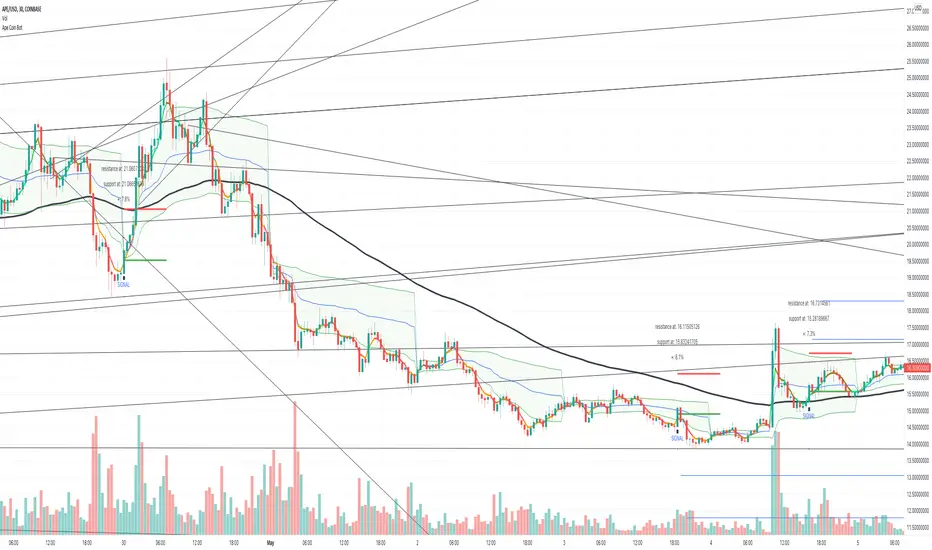
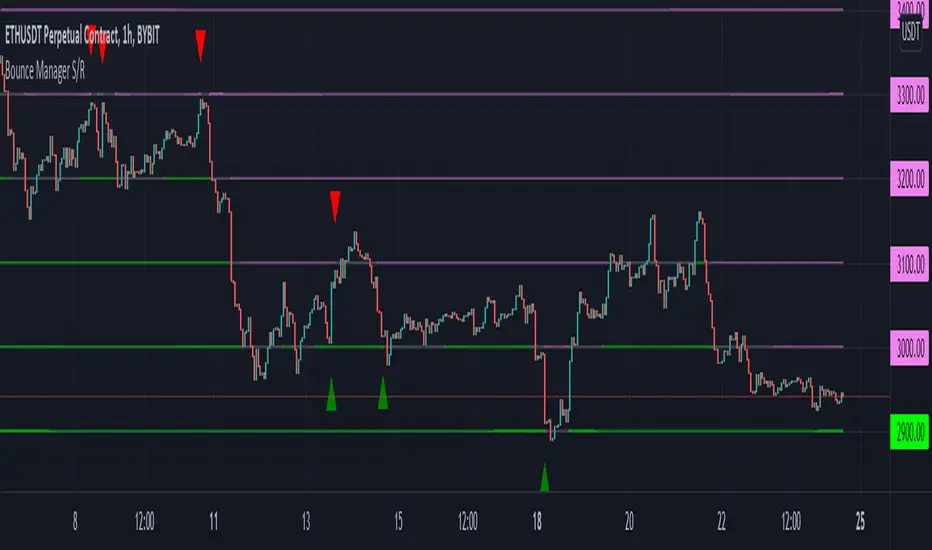
Bounce Manager S/RThis script is based on the bounce manager ATR script
The S/R script is made for manual input of horizontal S/R lines, the script will then see if price respects these levels by the parameters you input in settings panel. On a respectable bounce it will print buy/sell arrows. The script also has functionality to send alerts, this is helpful if you want to automate S/R lines.
An easy strategy to use would be the one you see in the preview using a grid of round numbers. This script in no way shape or form promises easy gains and like all algorithms should be forward tested on a paper trading account before using real money.
components:
- Max violation: When price moves past this the script will no longer look for entry until a new trend has been established. The line can also be used as a stop loss.
- Confirmation line: When price touches the line during a trend it
will wait to cross over this line to confirm a reaction from the line.
- Min past distance: A trend filtering system, this is a distance from
the line price has to break to confirm trend direction.
- Stop loss: This can be set to a percentage distance from the low after
bounce. Or it can be set to the max violation line
- Take profit: This can be a fixed take profit target or a risk to reward
based take profit. With risk to reward it will multiply the stop loss
distance by the input and use that to create target (green cross)
- ATR based or % based: there are 2 versions of the script, one for strict
percentage based logic and another one based on ATR values
Part of the Honest Algo service.
Bogdan Ciocoiu - Sniper EntryWhat is Sniper Entry
Sniper Entry is a set indicator that encapsulates a collection of pre-configured scripts using specific variables that enable users to extract signals by interpreting market behaviour quickly, suitable for 1-3min scalping. This instrument is a tool that acts as a confluence for traders to make decisions concerning current market conditions. This indicator does not apply solely to an asset.
What Sniper Entry is not
Sniper Entry is not interpreting fundamental analysis and will also not be providing out of box market signals. Instead, it will provide a collection of integrated and significantly improved open-source subscripts designed to help traders speculate on market trends. Traders must apply their strategies and configure Sniper Entry accordingly to maximise the script's output.
Originality and usefulness
The collection of subscripts encapsulated in this tool makes it unique in the Trading View ecosystem. This indicator enables traders to consider entry positions or exit positions by comparing similar algorithms at once.
Its usefulness also emerges from the unique configurations embedded in the indicator's settings, which are different from those of the original scripts.
This indicator's originality is also reflected in how its modules are integrated, including the integration of the settings.
Open-source reuse
I used the following open-source resources, which I simplified significantly and pre-configured for short term scalping. The source codes for the below are already in the public domain, including the following links listed below.
www.tradingview.com (open source)
(open source and generic algorithm)
www.tradingview.com (open source)
(open source)
(open source)
www.tradingview.com (generic MA algorithm and open source)
(generic VWAP algorithm and open source)

crypto futures hourly scalping with ma & rsi - ogcheckershi to all lovable traders,
hereby i want to share a combination of trade ideas for scalping
i've chosen hourly timeframe
indicators used: moving averages and rsi
moving averages:
ema 3, ema 5, ema 7
sma 3, sma 5, sma 7
daily_ema_3, daily_ema_5
daily_ema_5, daily_sma_5
rsi:
rsi 7, rsi 14, rsi 26
daily_rsi_7, daily_rsi_14, daily_rsi_26
as per the analysis over moving average behavioral patterns & rsi movements, useful points are given below which will be helpful while choosing good entry points & exit points,
strategical points for LONG:
* when ema3 crosses above sma3 - green candles start to form
* it's followed by ema5 > sma5 and ema7 > sma7
* when ema3 crosses down sma3 - it's considered as an indication of exit
* if rsi supports then can wait for ema5 crossing down sma5
* as similar, when daily_ema_3 crosses above daily_sma_3, its an higher timeframe bullish indication, so the lower timeframe entries inside this higher timeframe is a sure shot confident entry
* for LONG always take entries when rsi_14 < 30 or 25 else check rsi_7 < 25 or below
* as along the above, bullish CANDLE patterns like bullish engulfing , morning star is been used for entry at lower levels
* so here i've used OPEN as rsi_source in majority
* exit points also indicated at high_rsi and moving average crossunders or reverse crossovers
* for SHORTING, the above said ideas can be used in viceversa
* inputs in the indicator were tailored for users needs so that you will enjoy the magics of customization
if i am wrong in anyways regarding the above indicator strategy, please forgive me and help me improve in this aspect by commenting.
after few more studies and analysis and mainly QUERIES & COMMENTS, i'm planning to backtest these strategies here in tradingview.
also if these strategies are coded in python, we can link it to Binance Futures Algo or Bot Trading.
thankyou for this opportunity,
thanks to tradingview and pinecoders
thanks to Pranab (for 365MA)
thanks to Gandalf (for inspiring)
Special Thanks & Love to Chartbank for Everything

Ichimoku Cloud MasterIchimoku Cloud Master aims to provide the ichimoku trader with easy alert functionality to not miss out on valuable trade setups. The key purpose of this script is to better visualise crucial moments in Ichimoku trading. These alerts should not be used for botting in my opinion as they always need a human to confirm the ichimoku market structure. For example, is the Kijun-Sen flat and too far away from price? A good ichimoku trader will not enter at such a point in time.
Explanation of script:
Chikou(lagging span): pink line, this is price plotted 26 bars ago. People ignore the power of this it is crucial to see how chikou behaves towards past price action as seen in the chart below where we got an entry at red arrow because chikou bounced from past fractal bottom.
Kijun-Sen(base line): Black line or color coded line. This is the equilibrium of last 26 candles. To me this is the most important line in the system as it attracts price.
Kijun = (Highest high of 26 periods + Lowest low of 26 periods) ÷ 2
Tenkan-Sen(conversion line): Blue line. This is the equilibrium of last 9 candles. In a strong uptrend price stays above this line.
Tenkan = (Highest high of 9 periods + Lowest low of 9 periods) ÷ 2
Senkou A (Leading span A)= Pink cloud line, this is the average of the 2 components projected 26 bars in the future.
Senkou A = (Tenkan + Kijun) ÷ 2
Senkou B (Leading span B) = Green cloud line, this is the 52 day equilibrium projected 26 bars in the future.
Senkou B = (Highest high of prior 52 periods + Lowest low of prior 52 periods) ÷ 2
Notice how the distance between Chikou and the cloud is also 52 bars. This is all part of Hosoda's numbers which I am not going to explain here.
Fractals: These are the black triangles you find at key turning point. If you want to know how they work reseach williams fractals. I've used fractals with a period of 9 as it is an ichimoku number. These fractals are useful when working with ichimoku wave theory. Again I will not explain that here but in further education
Fractal Support: Ability to extend lines from the fractals which can be used as an entry/exit mechanism in your trading. For example wait for tenkan to cross kijun and then enter on fractal breakout.
Signals:
Crossing of Chikou (lagging span) with past Kijun-Sen: this will color code the Bars / Kijun-Sen (you can turn this off in options)
The script also has a signal for this, this will be the green and purple diamonds. Where green is bullish and purple is bearish.
wy is this important?
When current price plotted 26 candles back (chikou) crosses over the past equilibrium (kijun-sen) this usualy means price has moved past resistance levels where sellers come in. This indicates a switch in market structure and price is bullish from this point, this is the same in the other direction.
Kumo Twist: when the kumo cloud (future) has a crossover from for example green to red (bull to bear). The script plots these using the colored cross symbols as seen in the picture above. A chikou cross + a Kumo twist at same bar of next to eachother below the cloud can be a great entry sign: this would be an entry after cross in the chart above.
Kijun Bounce: when in an uptrend the price retraces back to Kijun-Sen and starts to go back up. These are marked by the yellow circles as seen in chart below:
low below Kijun-Sen and close above it
Strong Trend: when Tenkan is above Kijun, price above cloud, future cloud green, chikou above close, chikou above Kijun we establish a strong bullish trend. For bearish the exact opposite. The script has a function to send an alert at the start of such trends and to plot them with small colored circles above the bars.
Customisation:
I've added options to disable specific aspects of the indicator for those traders who do not want to use all aspects of the indicator. In the customisation tab I've given each part a clear title so you can use your own colors/shapes.
The perfect entry?
Further info:
Look into my education pane, I will be adding education in the future. The chance of me making a more advanced version of the script including line forecasting etc is rather high so watch out for that.
For those who want to master this system I recommend reading the book:
How to make money with the ichimoku system by Balkrishna M. Sadekar
Or the originals books by Hosoda the inventor of Ichimoku if you can get your hands on them and can read Japanese.
Almost all info about the ichimoku system you find on the internet will lose you money because they reduce the system to simple signals that do not generate money.
I will be providing educational material on tradingview using this indicator.

Ridicoulous_MA - Multitimeframe MA that adapts to TrendRidicoulous_MA
This is my very own creation of an MA that adapts to Trend strength! - It gets Thicker when Trend is weak and Thinner when Trend is Strong to help you Filter out Bad Trades
I was looking for an MA that Adapts fast to sideway Markets to filter out Signals from Algos in Sidewaymarkets but couldnt find anything, So i decided to create my own
The MA is created Multitimeframe with close so it does not repaint!
The MA gets Builded with Values from EMA or SMA from the Choosen Timeframe (you can decide to use SMA or MA Values for building it up) i personally prefer to build it on EMA.
Trade Below the MA for Short and Above the MA for long!
If you need the MA for a Bot or anything contact me and i can add an output for you if close above/below the MA then you can use it as an external Filter!
This is only the MA! no Strategy! but i still just did some test on very simple strategies for autotrade
In this screenshot i simulated entry on Crossover MA and close Above an EMA & Above Vwap
prnt.sc
In this screenshot i just tested it as a Filter for a Strategy, simple Long above MA & Vwap (Pyramiding 1, 0.05% comission)
prnt.sc
In this screenshot i just entered a Trade after the breakabove and retesting the MA (Pyramiding 5, 0.05% comission)
prnt.sc

[TTI] Net New Highs / Lows––––History & Credit
There are multiple methodologies that use Net New Highs for the NASDAQ or NYSE as a market direction indicator. Recently, I saw Matt Caruso to also apply such methodology, so I decided to code this indicator.
–––––What it does
👉 Plots a Net Change histogram. This shows New Highs - New Lows, if the histogram is above 0 this means there are more highs than lows
👉 Plots Background colouring. This is dependant on the sensitivity setting of the indicator. We would require a few days of downward action before concluding a downward action. Sensitivity can be adjusted in the menu
👉 Bot the Histogram and the Background colouring can be turned on and off (as per screenshot example)
–––––How to use it
You can use it to validate if the market conditions are ripe for entering a trade. For instance if you trade long, you would want to confirm with the indicator that general market is facilitating moves to the upside. IBD have mentioned more than once that a stock move is 50% due to the general market move.

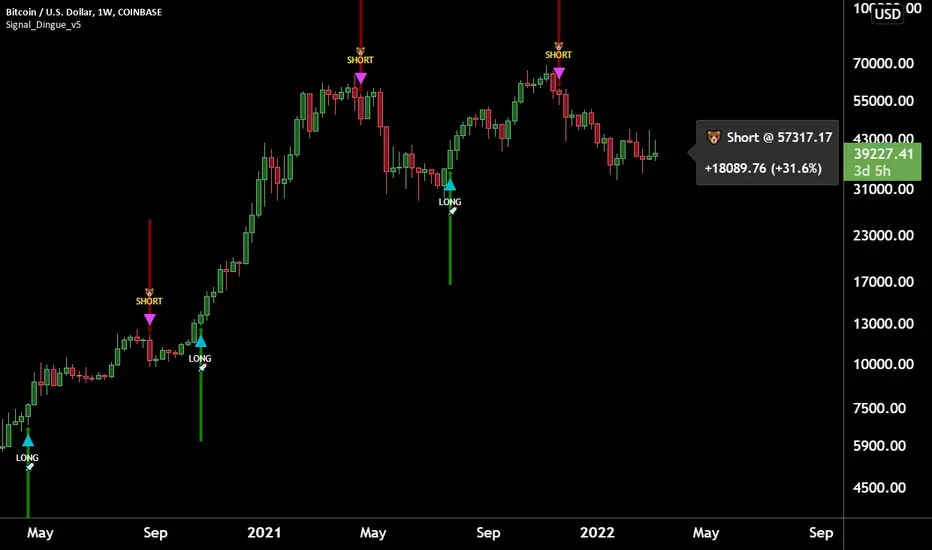
Trading Assistant DiNGUETrading Assistant DiNGUE This indicator is like a trading assistant for your charts.
It helps set your biases and emotions aside and lets you focus on managing trades in an easy visual way.
Get various types of signals to enter your trades (either Long or Short). Then use take profits, stops, or the opposite signal to exit trades.
The signals are created from various indicators and sensibility options you can customize any way you want. Works on every timeframe.
You can customize every setting or used the preset ones. Preset settings adjust automatically based on the timeframe you are using on the chart.
The 12 Indicators are Volume - RSI - Stochastic - MacD - Moving Averages (MA) - Rate of Change (ROC) - ADX DMI Directional Movement Index - On Balance Volume (OBV) - Bollinger Bands - VWAP - ATR - Parabolic SAR.
Every indicator can be turned On or Off.
You can adjust the way it creates signals by selecting either 'rise-fall', 'crosses' or by combining both.
You can select the sensitivity of the signal from Normal - Safe - Safer.
You can adjust lengths or use the preset ones.
There are also additional options for each indicator, you can filter weak levels for ADX, filter for tight bands, have ROC above 0…
You can also plot several of those indicators on the screen. 2x Moving Averages, 2x VWAP, 2x ATR, 2x SAR for even easier visualization of the trend.
You can also plot fractals to facilitate once again on trend visualization. Higher high, lower low, higher low, lower high.
Trade with the Trend and Safe Trades:
If you want to have a higher chance of success, you can trade with the trend. First, select the trend timeframe you would like to use. Let's say the “Weekly” trend. Meaning it will generate a signal on the weekly timeframe and based on the result (Long or Short) it will only take trades in that direction. So the trend is LONG on the Weekly and you get a “Long” signal, it will take it. “Short” signals on the other hand will be treated as “stops” and won’t want to go against the trend by going ‘short’.
Safe Trend works in the same manner, but instead of using the signal on a bigger timeframe, it uses an indicator as to the deciding factor. Let's say you select the 200SMA as the “Safe signal”. The indicator will only go “Long” when above the 200SMA and “Short” under the 200SMA. Otherwise, it will put a stop instead of going against the trend.
Stop Loss:
There are 4 different types of stop-loss that you can use at the same time.
- Indicator Stop
- Fib stop
- Fix % stop
- Trailing stop
You can plot the stops directly on the chart AND OR add them to the panel for an easy visualization once again.
With the ‘indicator stop’, you can select one of the two: MA ATR SAR VWAP as a stop.
Fib stop, it uses fib numbers to calculate a stopping point.
Fix %, you can select your max loss in percent. Could be 2%, 5%
A trailing stop is like a fixed stop but that will trail as the price moves in the right direction.
Take Profit:
There are 4 different types of take profit that you can use simultaneously.
- Fix % Take Profit
- ATR multiple Take Profit
- Fib multiple Take Profit
- Bollinger Band Take Profit
Fix % just let you set a fix take profit target in percent.
ATR multiple lets you select a target based on a multiple of the average true range.
Fib multiple lets you select a target based on a fib multiple
Bolling Band lets you take profit based on the Bollinger band settings you select.
Visual Panel:
The visual panel lets you see exactly how is the last trade progressing. It will give you the entry price, profit, stop, and target. You can turn it on or off, as is for the stop and target.
You can also decide to plot 1 position or more, you can even show all the possible signals, add backgrounds with colors. You can also plot the bigger Trend and Safe Signals explained above.
If you have any questions, suggestions, or comments, feel free to do so!
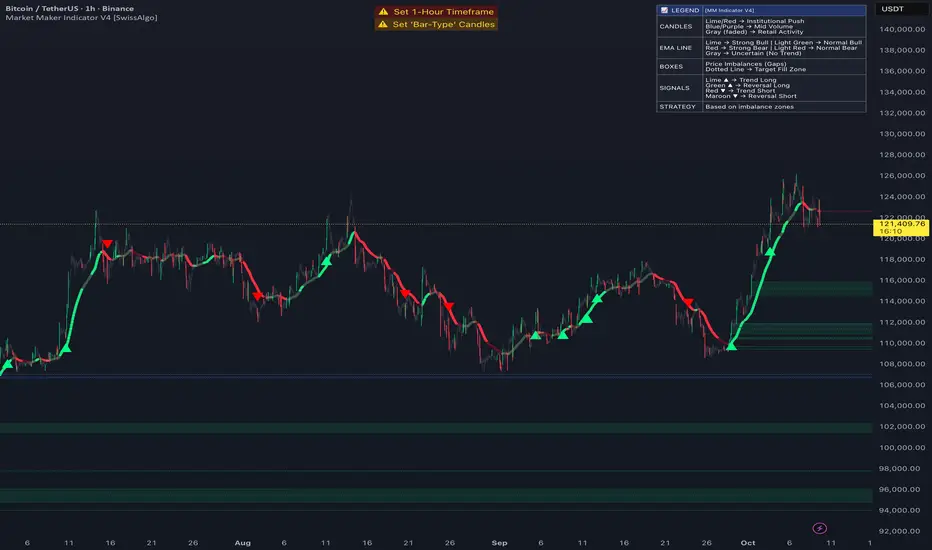
Market Maker Indicator V2 [tecnocrypto]This indicator is based on the idea that prices are generated by the interaction between a Market Maker on one side (sometimes also called the "Composite Man") and Retail Traders on the other side (Retail Traders include simple retail, professional traders, whales, institutions...as a single entity). These two opposite entities "play" the trading game on trading platforms/exchanges (crypto), which are neutral to the game.
Market makers are liquidity providers, and make profits either by charging a spread between buy and sell prices, and (also) by trapping retail traders into specific positions.
Trading is a "zero sum" game in the sense that it generates a transfer of resources between these two specific players, which are indeed the Market Maker and Retail Traders. If Retail Traders are in profit, Market Maker is (temporarily) in loss, and viceversa. Market Maker goal is to squeeze profits out of Retail Traders, by inducing them to take wrong positions.
The Market Maker Method Indicator executes the following:
1) Identifies and plots candles that are generated by the Market Maker's moves (called "Shift Candles"); shift candles are "artificial" price/volumes moves, generated to induce retail traders into specific zones which are, essentially, traps. They are called Shift Candles as they generate abnormal (and mostly unexpected) price movements in either direction. They move the price from one zone to the next to execute the Market Maker strategy. Observe how often sudden (apparent) prices increases are followed by price crashes (stop hunt rise, drop); and observe how often sudden (apparent) price collapses are followed by price uptrends (stop hunt low, rise); sometimes these movements are made in progressive steps (generally, 3).
2) Plots open long/open short alerts based on the assumption that when Market Maker plots upwards shift candles, vivid green color, they are preparing for an upcoming price reversal (down); same, but opposite sign, for downwards shift candles. This is a counterintuitive logic for Retail Traders, that generally open long when price is rising, and open shorts when price is falling - jumping into Market Makers traps.
3) Plots the areas where price is expected to return (upwards or downwards) based on previous shift candles (called "Recovery Zones")
You can use this indicator on any timeframe and for any asset.
The Market Maker indicator V2 provides long / short entry signals based upon the market maker manipulative moves described above.
Long alerts are triggered by manipulative price push-downs by the marker maker, which will be followed by price increases (while price was decreasing, market maker was purchasing from retail). Additional factors are taken into consideration to plot long entry signals, , mainly volume build up and mean reversion, around this basic concept.
Short alerts are triggered by manipulative price push-ups by the marker maker, which will be followed by price drops (while price was increasing, market maker was selling to retail). Additional factors are taken into consideration to plot short entry signals, mainly volume build up and mean reversion, around this basic concept.
The indicator is based on the Traders Reality indicator, but improved with alerts, that can be used with trading bots, and additional possibilities to customize the behavior of the indicator.
A strategy associated with this indicator is also available.
Best results on the 1H timeframe.
Contact me for further info.
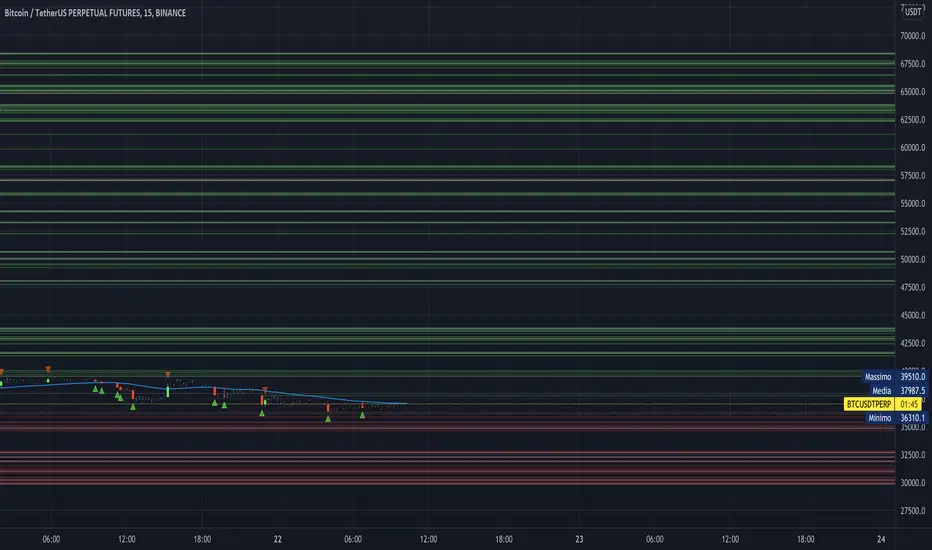
MarketMaker Method [ShiftCandles]This indicator is based on the idea that prices are generated by the interaction between a Market Maker on one side (sometimes also called the "Composite Man") and Retail Traders on the other side (Retail Traders include simple retail, professional traders, whales, institutions...as a single entity).
These two opposite entities "play" the trading game on trading platforms/exchanges (crypto), which are neutral to the game.
Market makers are liquidity providers, and make profits either by charging a spread between buy and sell prices, and (also) by trapping retail traders into specific positions.
Trading is a "zero sum" game in the sense that it generates a transfer of resources between these two specific players, which are indeed the Market Maker and Retail Traders. If Retail Traders are in profit, Market Maker is (temporarily) in loss, and viceversa. Market Maker goal is to squeeze profits out of Retail Traders, by inducing them to take wrong positions.
The Market Maker Method Indicator executes the following:
1) Identifies and plots candles that are generated by the Market Maker's moves (called "Shift Candles"); shift candles are "artificial" price/volumes moves, generated to induce retail traders into specific zones which are, essentially, traps. They are called Shift Candles as they generate abnormal (and mostly unexpected) price movements in either direction. They move the price from one zone to the next to execute the Market Maker strategy. Observe how often sudden (apparent) prices increases are followed by price crashes (stop hunt rise, drop); and observe how often sudden (apparent) price collapses are followed by price uptrends (stop hunt low, rise); sometimes these movements are made in progressive steps (generally, 3).
2) Fires open long/open short alerts based on the assumption that when Market Maker plots upwards shift candles, vivid green color, they are preparing for an upcoming price reversal (down); same, but opposite sign, for downwards shift candles. This is a counterintuitive logic for Retail Traders, that generally open long when price is rising, and open shorts when price is falling - jumping into Market Makers traps.
3) Plots the areas where price is expected to return (upwards or downwards) based on previous shift candles (called "Recovery Zones")
The script will be further developed to prevent early open long/open short alerts, trying to catch the Market Makers cycles in a more detailed way (to account for situations where artificial price moves are executed in consecutive steps, instead of single candles).
You can use this indicator on any timeframe and for any asset.
You can connect the open long/open short alerts to trading bots to execute automatic trades.
Buy / Sell indicator light version [Crypto_BCT]The indicator is based on the search for the lowest bars in a given period (can be customized).
You can add a search for the highest bars to determine the closed order points.
You can add a filter by the value of the RSI (you can customized it separately for buying and selling).
Alerts for buying and selling are set.
It can be used to work with bots, for example 3COMMAS DCA bot.
--------------------------
Signal Condition Settings:
(Buy) Lowest Bar
The closing of the current bar is lower than the closing of the bars back in this range
(Buy) RSI value <
The RSI index is below this value
(Sell) Highest Bar
The closing of the current bar is higher than the closing of bars in this range
(Sell) RSI value >
The RSI index is higher than this value

MoonFlag AI Cloud (JWTainsh)This is a cloud that is based on a novel overshoot algo and also provides a 'central line' which represents to some degree an average moving in the direction of the trade (as indicated by the cloud).
Most indicators are based on moving averages which lag the price action.
This indicator uses a predictive overshoot algo that is different to a moving average. The algo overshoots the price action by following momentum. The cloud is made from multiple overshoot algo's all at different lengths (number of lookback bars).
In comparison to a moving average, the moving average will never give a reading greater than the price action in an up-trend. A moving average will lag the price action and eventually the price will come down and intersect with the moving average. In this overshoot algo (that forms the cloud), the parts of the algo with the shorter length will shoot way above the price action as the uptrend weakens.
The cloud is made from multiple overshoots algo's all with a different length. So when an uptrend weakens, the overshoot algo's with the longer length will still be below the price action and the price action will dip below the base of cloud - thus indicating an end to the uptrend - and possibly the start of a downwards momentum if the price action persists into the red.
So, when the price action dips below the cloud, it forms a line whereby below the line the cloud is colored red - indicating a possible downturn in the trend as the up momentum has receded. There is still a green part to the cloud above the lower line, as the up momentum could re-establish if the price action stays about the red.
Similarly, if in a down trend (price action in a red part of the cloud) and the price action breaks above the top of the cloud, the cloud will go green - until the price action falls below the cloud again.
There is also a half-way average line (although this is not entirely correct - it does describe what the mid-line does with some understanding). This mid-line only moves up when in an upward momentum. Similarly, the mid-line only moves down in a down momentum. Its interesting to see when the price action crosses the mid-line as this can indicate a change in momentum early on.
For example, if the price action remains above the mid-line, this can show a pump is still in progress.
If the price action just bounces above the cloud, then below, then above - it means the could length is not great enough - and the price action is probably governed more by RSI on a relatively fast timeframe.
When the cloud gets thin - this generally means the price action is in line with a steady momentum and has been for a while. This can be thought of as all the moving averages converging and this sometimes can indicate a biggish move is about to happen (and thus throw the cloud into a wider state - and get all the traders excited).
I started coding this cloud when trying to intersect with the start of shorts or to locate the end of a long trend cycle. Shorts generally happen on a faster timeframe than longs so I generally use separate cloud timeframes (or lengths) for longs or shorts.
I also find that market conditions change considerably every few weeks or months - so the cloud is best reliable on recent data.
Also use in conjunction with other indicators such as OCC, 1D ATR Trend or VRSI/MACD Confluence - as this is a predictive indicator based on price action overshoot from momentum information. This is not - a moving average - this cloud does not lag price action - it kind of predicts where the price action will go if the present momentum remains - and then detects when a change in this momentum occurs due to price action intersection.
Please get in touch for more information or, if you would like to see the webhooks bot strategy I linked to the code.
Sincerely,
Moonflag (Josef Tainsh PhD)
