Daily & Weekly False-Breakout DetectorDaily & Weekly Lines
We retrieve previous day/week’s High and Low.
lookahead=barmerge.lookahead_on means we see the “final” daily/weekly bar values intraday, so it may repaint in real‐time.
False Breakout Logic
Intraday crosses of close above the previous high (PDH or PWH).
By the end of the daily/weekly bar, close is back below that high.
Similarly for false breakdowns below PDL or PWL.
Shape/Alert
Each time an intraday bar crosses up or down, if the final daily/weekly close reverts back inside the prior range, a label is drawn and an alert is triggered.
Because we are “peeking” at the daily/weekly close, these signals can appear or disappear in real‐time.
If you only want a confirmed signal after the period’s close, switch to lookahead_off, which will finalize them at the next day or next week.
Cerca negli script per "breakout"

Advanced 1-Minute Open Range Breakout IndicatorThis indicator is designed for the market on a 1-minute chart. It calculates the open range based on the first 5 minutes after the market open (09:30 – 09:35) and plots the high and low of this period as the daily resistance and support levels respectively. Additionally, the indicator displays the previous day’s high and low as blue horizontal lines, providing extra reference levels.
Trade signals are generated only during the active trading session (09:35 – 16:00). The advanced trade logic works as follows:
• For long entries:
- When the price first breaks above the open range high, the indicator enters a “breakout” state.
- If the price then retraces to (or below) the open range high, it moves to a “retest” state.
- Finally, if the price breaks above the open range high again, a long signal is issued.
• For short entries:
- When the price first breaks below the open range low, the indicator enters a “breakdown” state.
- If the price then retraces to (or above) the open range low, it moves to a “retest” state.
- Finally, if the price breaks below the open range low again, a short signal is issued.
All signals and the open range lines are only displayed during the trading session (09:35 to 16:00).
Use this indicator to help identify high-probability breakout setups in the early part of the trading day.

Market StructureThis is an advanced, non-repainting Market Structure indicator that provides a robust framework for understanding market dynamics across any timeframe and instrument.
Key Features:
- Non-repainting market structure detection using swing highs/lows
- Clear identification of internal and general market structure levels
- Breakout threshold system for structure adjustments
- Integrated multi-timeframe compatibility
- Rich selection of 30+ moving average types, from basic to advanced adaptive variants
What Makes It Different:
Unlike most market structure indicators that repaint or modify past signals, this implementation uses a fixed-length lookback period to identify genuine swing points.
This means once a structure level or pivot is identified, it stays permanent - providing reliable signals for analysis and trading decisions.
The indicator combines two layers of market structure:
1. Internal Structure (lighter lines) - More sensitive to local price action
2. General Structure (darker lines) - Shows broader market context
Technical Details:
- Uses advanced pivot detection algorithm with customizable swing size
- Implements consecutive break counting for structure adjustments
- Supports both close and high/low price levels for breakout detection
- Includes offset option for better visual alignment
- Each structure break is validated against multiple conditions to prevent false signals
Offset on:
Offset off:
Moving Averages Library:
Includes comprehensive selection of moving averages, from traditional to advanced adaptive types:
- Basic: SMA, EMA, WMA, VWMA
- Advanced: KAMA, ALMA, VIDYA, FRAMA
- Specialized: Hull MA, Ehlers Filter Series
- Adaptive: JMA, RPMA, and many more
Perfect for:
- Price action analysis
- Trend direction confirmation
- Support/resistance identification
- Market structure trading strategies
- Multiple timeframe analysis
This open-source tool is designed to help traders better understand market dynamics and make more informed trading decisions. Feel free to use, modify, and enhance it for your trading needs.

Candlestick DataCandlestick Data Indicator
The Candlestick Data indicator provides a comprehensive overview of key metrics for analyzing price action and volume in real-time. This overlay indicator displays essential candlestick data and calculations directly on your chart, offering an all-in-one toolkit for traders seeking in-depth insights.
Key Features:
Price Metrics: View the daily high, low, close, and percentage change.
Volume Insights: Analyze volume, relative volume, and volume buzz for breakout or consolidation signals.
Range Analysis: Includes closing range, distance from low of day (LoD), and percentage change in daily range expansion.
Advanced Metrics: Calculate ADR% (Average Daily Range %), ATR (Average True Range), and % from 52-week high.
Moving Averages: Supports up to four customizable moving averages (EMA or SMA) with distance from price.
Market Context: Displays the sector and industry group for the asset.
This indicator is fully customizable, allowing you to toggle on or off specific metrics to suit your trading style. Designed for active traders, it brings critical data to your fingertips, streamlining decision-making and enhancing analysis.
Perfect for momentum, swing, and day traders looking to gain a data-driven edge!

Birdies [LuxAlgo]The Birdies indicator uses a unique technique to provide support/resistance curves based on a circle connecting the last swing high/low.
A specific, customizable part of this circle acts as a curve of interest, which can trigger visual breakout signals.
🔶 USAGE
The script projects a bird-like pattern when a valid Swing point is found. Multiple customization options are included.
🔹 Trend & Support/Resistance Tool
The color fill patterns and the wing boundaries can give insights into the current trend direction as well as serve as potential support/resistance areas.
In the example above, "Birdies" coincide with pullback and support/resistance zones.
🔹 Swing Length & Buffer
Besides the "Swing Length", with higher values returning longer-term Swing Levels, the script's behavior can be fine-tuned with filters ("Settings" - "Validation").
🔹 Validation
To minimize clutter, three filters are included:
Minimum X-Distance: The minimum amount of bars between subsequent Swings
Minimum Y-Distance: The minimum amount of bars between subsequent Swings
Buffer (Multiple of ATR)
The "Minimum X/Y-Distance" creates a zone where a new Swing is considered invalid. Only when the Swing is out of the zone, can it be considered valid.
In other words, in the example above, a Swing High can only be valid when enough bars/time have passed, and the difference between the last Swing and the previous is more than the ATR multiplied by the "Minimum Y-Distance" factor.
The "Buffer" creates a line above/below the "Birdy", derived from the measured ATR at the conception of the "Birdy" multiplied with a factor ("Buffer").
When the closing price crosses the "Birdy", it must also surpass this buffer line to produce a valid signal, lowering the risk of clutter as a result.
🔶 DETAILS
Birdies are derived from a circle that connects two Swing points. The left-wing curve originates from the most recent "Swing point" to the last value on the circle before crossing its midline. The mirror image of the left wing creates the right wing.
Enabling "Origine" will draw a line from the last Swing to the first.
🔹 Style
The publication includes a style setting with four options.
The first, "Birdy," shows a bird-like shape derived from a circle connecting the last Swing High and Swing Low.
The second option holds everything from the first option but connects both wingtips, providing potential horizontal levels of interest.
When setting "Birdy" to "None", the visual breakout signals will not defer from previous settings, but the focus is shifted towards the fill color, which can help detect potential trend shift.
A fourth setting, "Left Wing", will only show the left part of the "Birdy" pattern, removing the right part from the equation. This will change the visual breakout signals, providing alternative signals.
🔶 SETTINGS
Swing Length: The period used for swing detection, with higher values returning longer-term Swing Levels.
🔹 Validation
Minimum X-Distance: The minimum amount of bars between subsequent Swings
Minimum Y-Distance: The minimum amount of bars between subsequent Swings
Buffer (Multiple of ATR)
🔹 Style
Bullish Patterns: Enable / color
Bearish Patterns: Enable / color
Buffer Zone: Show / Color
Color Fill: Show color fill between two Birdies (if available)
Origine: Show the line between both Swing Points
🔹 Calculation
Calculated Bars: Allows the usage of fewer bars for performance/speed improvement

High & Low Of Custom Session - Breakout True Open [cognyto]This indicator is based on the High & Low Of Custom Session - OpeningRange Breakout (Expo) created by Zeiierman.
It adds new functionality and enhances existing settings, targeting ES, NQ, and YM:
Manages session defaults to 12:00 to 13:00
New true opening fully customizable (default 13:00)
Manages timeframe visualization (default 15m and below)
Manages session draw length until the end of the current session (default NY)
Manages previous sessions, allowing the to be hidden
Improves timezone selection (default NY)
Following the strategy called Paradox detailed by DayTradingRauf, it works with indices like ES, NQ, and YM.
The rules consider three possible profiles:
First
AM session as consolidation (08:00-12:00)
Lunch hour range as consolidation (less than 100 points)
PM session breaking either side of the session range
Second
AM session trending lower (08:00-12:00)
Lunch hour range as consolidation (less than 100 points)
PM session trending higher
Third
AM session trending higher (08:00-12:00)
Lunch hour range as consolidation (less than 100 points)
PM session trending lower
After the session ends, the opening price at 13:00 is automatically drawn as it is a key point for the entry strategy.
The strategy can be monitored using a 5-minute or 15-minute timeframe as follows:
- Wait for a liquidity hunt (either the high or low of the lunch session range or AM is taken).
- If liquidity is taken, switch to the 1-minute timeframe and wait for a CISD (change in the state of delivery), where the price closes below an OB, or consider a breaker block or iFVG to enter the trade.
- Bullish entries should happen below the opening price at 13:00, and bearish entries should happen above.
- Consider a 1:2 reward ratio. However, runners can target the opposite side of the range that was not yet taken.
This indicator is for informational purposes only and you should not rely on any information it provides as legal, tax, investment, financial or other advice. Nothing provided by this indicator constitutes a solicitation, recommendation, endorsement or offer by cognyto or any third party service provider to buy or sell any securities or other financial instruments in this or any other jurisdiction in which such solicitation or offer would be unlawful under the securities laws of such jurisdiction.

First 12 Candles High/Low BreakoutThis indicator identifies potential breakout opportunities based on the high and low points formed within the first 12 candles after the market opens on a 5-minute timeframe. It provides visual cues and labels to help traders make informed decisions.
Features:
Market Open High/Low: Marks the highest and lowest price of the first 12 candles following the market open with horizontal lines for reference.
Breakout Signals: Identifies potential buy or sell signals based on the first 5-minute candle closing above the open high or below the open low.
Target and Stop-Loss: Plots horizontal lines for target prices (100 points by default, adjustable) and stop-loss levels (100 points by default, adjustable) based on the entry price.
Visual Cues: Uses green triangles (up) for buy signals and red triangles (down) for sell signals.
Informative Labels: Displays labels with "Buy" or "Sell" text, target price, and stop-loss price next to the entry signals (optional).
Customization:
You can adjust the target and stop-loss point values using the provided inputs.
How to Use:
Add the script to your TradingView chart.
The indicator will automatically plot the open high, open low, potential entry signals, target levels, and stop-loss levels based on the first 12 candles after the market opens.
Use the signals and price levels in conjunction with your own trading strategy to make informed decisions.

ATR Extension [QuantVue]The Moving Average ATR Extension Indicator offers a powerful blend of two key market elements: the Average True Range (ATR) and Moving Averages (MA), capturing the dynamics of market momentum and trend direction.
This indicator is used to measure market extension from a user-selected moving average based on multiples of the Average True Range (ATR). By doing this, it becomes remarkably straightforward to spot strength at breakout points or exhaustion near the end of a run.
As a market breaks out the extension indicates a surge in buying pressure, while an extension after a sizeable move can often be an indication of market exhaustion. This extended position essentially reflects over-enthusiastic buying and could be an early warning sign of a potential trend reversal.
Breakout Strength:
Exhaustion:
Give this indicator a BOOST and COMMENT your thoughts!
We hope you enjoy.
Cheers.

Relative Daily Change% by SUMIT
"Relative Daily Change%" Indicator (RDC)
The "Relative Daily Change%" indicator compares a stock's average daily price change percentage over the last 200 days with a chosen index.
It plots a colored curve. If the stock's change% is higher than the index, the curve is green, indicating it's doing better. Red means the stock is under-performing.
This indicator is designed to compare the performance of a stock with specific index (as selected) for last 200 candles.
I use this during a breakout to see whether the stock is performing well with comparison to it`s index. As I marked in the chart there was a range zone (red box), we got a breakout with good volume and it is also sustaining above 50 and 200 EMA, the RDC color is also in green so as per my indicator it is performing well. This is how I do fine-tuning of my analysis for a breakout strategy.
You can select Index from the list available in input
**Line Color Green = Avg Change% per day of the stock is more than the Selected Index
**Line Color White = Avg Change% per day of the stock is less than the Selected Index
If you want details of stocks for all index you can ask for it.
Disclaimer : **This is for educational purpose only. It is not any kind of trade recommendation/tips.

Days in rangeThis script is a little widget that I made to do some homework on the VIX.
As you can see in the chart I was analyzing the 2008 market crash and the stats that followed it after until the market started to recover.
You can see that theory in my "Ideas" tab.
This is an interactive set of lines that you can use to count the the bars inside and outside of your chosen range, and the percentage outside that range.
You should initially enter the price range of your product in the menu and set some arbitrary dates that you can easily see on your chart.
Drag and drop the lines around to suit what price and the dates you are analyzing.
The table will display the bar count inside and outside of the range, the total bars, and the percentage outside that range.
I personally used this as a tool to study the overall average of the product, compared with the behavior during major market events.
It is currently my opinion that post 2020 analysis needs to take into account the behavior of any given product prior to 2020 when the
VIX was in its comfort zone. Not to say that a price valuation hasn't been set, but that the movement to that price was outside of "Normal Market Conditions,"
and the time factor to return to that value might be skewed. Other factors would need to be considered at that point pertaining to your specific product or corelating indicator.
I could see this tool being useful to Forex and commodities traders. But that isn't my field so that that for what it is. I do think it would perform best on something that is more
pegged to a price range. I personally would use it on product's, like the VIX, that I use as an indicator product. That is what it was designed for.
But I suppose it could be used for Mean price and time related analysis, maybe with a Vwap, SMA or other breakout style indicators.
Volume analysis might be pretty sporty. Possibly time patterns... the possibilities could be endless. Or... limited.
I am publishing this for my trade group so that it can be tinkered with to find other helpful ways to use it.
If anyone finds something interesting with other indicators, please drop a comment below and I could consider creating a script to integrate with this tool.

Pivot Trendlines with Breaks [HG]🧾 Pivot Trendlines and Breaks
A script meant to debut and provide an example usage of the Simple Trendlines library using Pine Script's built-in pivot system.
In under 50 lines of code, with inputs, plots, styling, and alerts included we're able to create trendlines with a breakout system.
▶️ How it works
Calculating pivot points helps traders identify moments at which the market's attitude can shift from bullish to bearish. In the background, the script tracks pivot events for trendlines and uses a system that prevents any leakage between the trendlines before they are drawn.
⚫️ Settings
Pivot Length
Color Adjustments
⚫️ Alerts

Drip's 11am rule breakout/breakdown (OG)This indicator is based on Drippy2hard's 11:30 am (EST) rule.
In simple terms the rule states that:
If a trending stock makes a new high after 11:15-11:30am EST, there is a 75% chance of closing within 1% of High of day (HOD). Same applies for downtrend.
Please note:
Not all stocks will abide by this, this is backtested on stocks with avg daily volume > 2M and mostly mega cap stocks which have liquid option chains. The backtesting results show very promising results on $SPY/ $SPX so it is advised to trade $SPY/ $SPX using this indicator over any other stocks.
Although the name suggests 11 AM rule, the backtesting shows higher win rate for 11:30 AM so please select that option in the settings.
As always, no indicator is perfect and please follow your risk management and understand that indicators are tools to aid your trading and by no means they are supposed to work as intended in all scenarios
How the script works
1. A HOD/LOD zone is identified based on regular session (9:30am-11:30am) EST. Users can select cut off time to 11AM in the settings. These will be indicated on chart after 11/11:30pm depending on what user selected
2. If the stock breaks above the HOD and the ADX is showing strong momentum to upside then the candlesticks will start showing neon color, if the trend based on moving averages and candle closing is also bullish then the indicator will show trend arrows under the candle indicating to stay in the trade. Same applies for break below LOD, only the colors will change to represent downtrend.
3. An optional cloud is also shown if the trend is developed. The cloud can be used as trail stop or re entry point as long as it is displayed on chart
How to use the indicator in trading
In general, there are three scenarios which are trade worthy
1. If the stocks breaks out above the HOD zone and up trend develops or the stocks breaks below the LOD zone and downtrend develops. See images below
2. You can also use the LOD/HOD zone as demand/ supply if the Price action is range bound like this example below
Thanks for reading, please give thumbs up if you like using it! Please post comments on how to use it.

HMA Breakout Buy/Sell indicator for Scalping & Intraday - ShyamHi All,
This is a very simple indicator which provides the buy signal, when the moving average lines turns Green and sell signal, when the moving average signal turns red. This can be used for both intraday and scalping method with different timeframes. But best time frame is 5 minutes.
Buy Signal >>> Line turns GREEN (Use trailing SL to cover maximum profit)
Sell Signal >>> Line turns RED (Use trailing SL to cover maximum profit)
No trade >>> Line turns GRAY
Best timeframe >>> 5 minutes
Thanks,
Shyam

three bar breakout diegothree bar breakout linda
this indicator ienables me to see this chart pattern, inside day within two previous bars
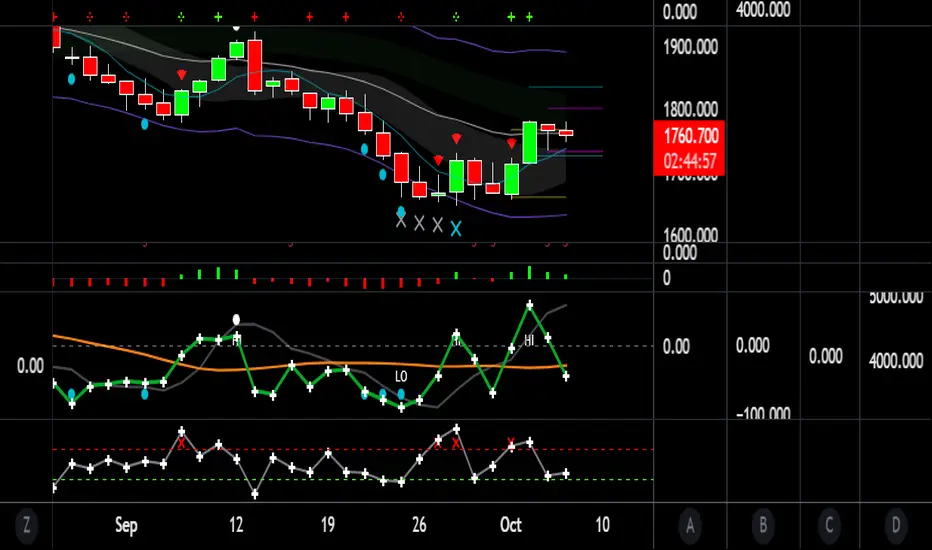
Pivot Average [Misu]█ This Indicator is based on Pivot Points.
It aggregates closed Pivot Points to determine a " Pivot Average " line.
Pivot Points here refer to highs and lows.
█ Usages:
Pivot Average can be used as resistance or breakout area.
It is also very usefull to find battle zones.
It can also be used as a trend indicator: when the price is below, trend is down, when price is above, trend is up.
Mixed with momentum/volatility indicator it is very powerfull.
█ Parameters:
Deviation: Parameter used to calculate pivots.
Depth: Parameter used to calculate pivots.
Length: History Lenght used to determine Pivot Average.
Smoothing MA Lenght: MA lenght used to smooth Pivot Average.
Close Range %: Define price percentage change required to determine close pivots.
Color: Color of the Pivot Average.

Inside Bar SetupScript Details
- This script plots Inside Bar for given day in selected time-frame (applicable only for Timeframes < Day)
- Basis plotted inside bar, relevant targets are marked on the chart
- Targets can be customised from script settings. Example, if range of mother candle is 10 points, then T1 is 10 * x above/below mother candle and T2 is 10 * y above/below mother candle. This x & y are configured via script settings
How to use this script ?
- This script works well on 10-15 mins timeframe for stocks, 15/30 mins timeframe for nifty index and 30/60 mins time frame for bank nifty index
- If mother candle high is broken, take long trade with SL of mother candle low and if low is broken, take short trade with SL of mother candle high
Remember:
1. Above logic is to be combined with support/resistances i.e. price action. This script is an add-on to price action analysis giving you more conviction.
2. If range of mother candle is very high, it is recommended to avoid the trade.
3. Basis inside bar formed on higher time frame, take trade on basis of lower time frame i.e if inside bar is formed on 60 mins, take trade on the basis of 10-15 mins time frame
Example:
1. As seen in the chart, Nifty is near it's resistance and we are seeing Inside Bar being formed, In such scenario, even if High of Mother Candle is broken, we should be more interested to short as we are near resistance and probability of getting our targets in long side is less.
2. So, if I see breakdown of mother candle i.e. price going below low of mother candle, we will short with SL of high of mother candle.
3. As seen in the chart, both the targets are achieved.
Additional Info:
1. Targets on Long/Short Side can be configured via settings. For indices 1 times/1.5 times the range works well.
2. This script plots targets basis the first inside bar formed in the day for selected time frame.
3. Inside bars formed through out the day are coloured separately but lines are plotted only on the basis of 1st formed inside bar as this strategy works well for the first formed inside bar)
4. Don't forget to check volume in case of breakout/breakdown.
Note:
1. Mother Candle - First Candle of Inside Bar
2. Child Candle - Candle formed inside Mother Candle (Second Candle of Inside Bar)
Happy Trading :)

Crypto Breakout IndicatorHey Guys,
The idea of the script is that accumalation and small pumps do happen before the big ones, therefore, i tried to create a breakout indicator that can tell that:
the script components are:
1- Price to consolidate within 15% range between the highest of 6 candles and lowest of 6 candles
2- Price needs to breakout with minimum of 1% and maximum of 20%
3- Price needs to have sufficient volume, hence volume of current bar needs to be higher than previous one with 10% at least
4- RSI needs to be between 50 and 75
5- Bollinger Bands Percentage needs to be equal or lower than 1
6- Price is closing above EMA200
I tried to make all these numbers to be available for you guys through settings so you can tell me about any better settings!

Qullamaggie Daily with ADR% and Compression RangeQullamaggie Daily
This Indicator is a Combination of Moving Averages (Simple and Exponential) as definied from Qullamaggie and used in his TC2000 Setup
Moving Averages:
- The Moving Averages are Guidelines for the current Trend and are not decive for the Entry
- They shall be a quick view and visual assistance to find strong momentum stock that are currently in a Phase of a "Flag Pattern"
ADR% 20 Day:
- Average Daily Range in % should indicate the Momentum of the Stock. It is similar but still works different as the Volalitily indicators.
- A stock is recommend to a have a ADR% above 5-6 to be considered a Momentum Leading Stock.
Consolidation Range:
- This Indicator should help to define Ranges in which the Volumen get compressed(increase) while the price movement is minimal
- A strong breakout is to be expected. The Range should be easier to be identified with this indication.

LNL Squeeze ArrowsIf you struggle with the entries, low % win rate or trading the squeeze setup overall, this indicator is for you!
If you look closely at your losing trades, chances are the losers have one thing in common = inverse momentum. I created this tool after I found out that Stacked EMAs and picture perfect trend is not the only thing you need for a squeeze setup. Squeeze arrows pinpoint the exact moment where the squeeze momentum change happens (momentum change is absolutely crucial for the squeeze setup). These arrows will help you stay out of "everything was aligned but still failed" type of setups.
Squeeze Arrows:
1. Momentum Arrows (cyan blue/red) - Showing the best possible moment for an entry during the squeeze (after you see one, you can expect the squeeze to fire soon).
2. Slingshot Arrows (yellow) - Even though you can trade off of them, these arrows work mostly as a confirmation & caution tool. If an inverse slingshot arrow is plotted during a squeeze that means caution = you should wait because momentum is not on your side thus there there is a quite high probability that the squeeze can fire the other direction.
Squeeze Dots Trigger:
Represents the number of red dots (squeeze) after which the arrows should plot. Default = 5 (only after 5 red dots, arrows will appear), some traders like to set it on 3 or even 1.
Tips & Tricks:
1.Breakout or Bailout Mentality
- The big advantage of the arrows is the fact that they either work straight away or they don't. This is where you can apply the breakout or bailout mentality and really focus exclusively on the breakout part of the whole squeeze move. You can minimize the risk by putting mental stops just a few points below the last low of the candle where the arrows appeared. That way you can be stopped out even during the squeeze = won't hurt as much as when the squeeze fire the opposite direction. Reward may be the same but the risk is lower.
2. Yellow Flags
- Use the slingshot arrows as a caution tool. Even if all your squeeze criteria are met. Yellow inverse arrow = caution (wait for the true momentum change). Once the slingshot arrow appears in the conext of the trend, you are good to go.
3. Last Arrow Rule
- Sometimes you will see a lot of arrows during the longer squeezes. This is where the last arrow rule come in handy. The last arrow you see on chart can be canceled anytime by a new one. The last arrow is the valid one!
Hope you can squeeze from these squeeze arrows as much as there is to squeeze so you can finally trade the squeeze with ease.
Hope it helps.

StockBee 4% BreakoutThe Stockbee 4% Breakout script is a study tool for users who wants to do a deep dive on StockBee's 4% Breakout momentum burst method. This script will assist a specific group of traders who trade this method easily find historical momentum bursts. This script finds and colors red any candle body that meets the following criteria:
1. Volume of the candle is greater than the previous candle volume.
2. The percent change of candle's price is greater than 4% from the previous candle close.
3. Current candle close is less than 30% from candle's high.
This script also filters out any candle that gaps up and breaks down with a close above 4% the previous candle (Eliminates gap-ups that fade). This tool is meant to find and filter possible candidates. Not every marked candle is a great momentum burst trade.
This is very helpful for Trading View users trading this specific setup.

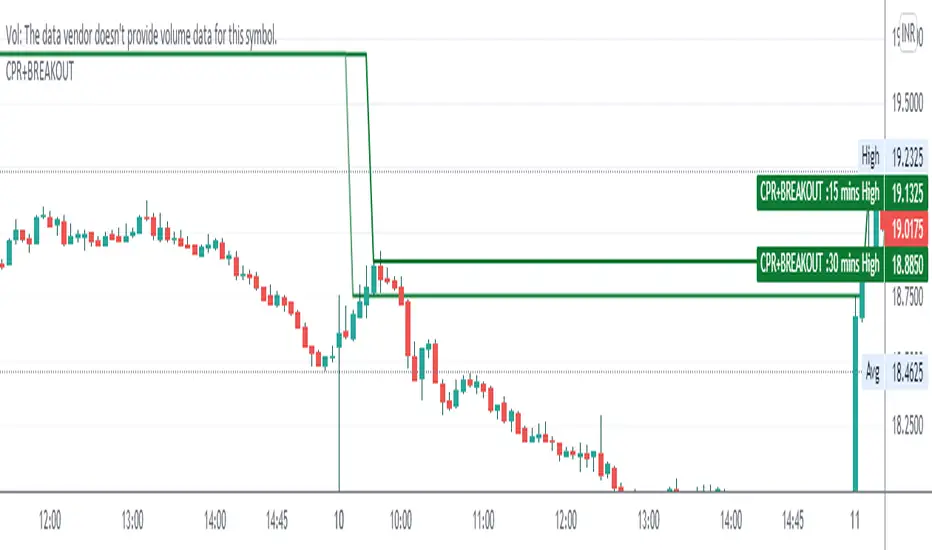
CPR WITH BREAKOUTCPR with 10-30 mins Breakout
This indicator includes CPR with 15-30 mins breakout, resistance, support, previous day low, previous day high, day low and day high etc,
please backtest before use
regards
The Malayali Trader
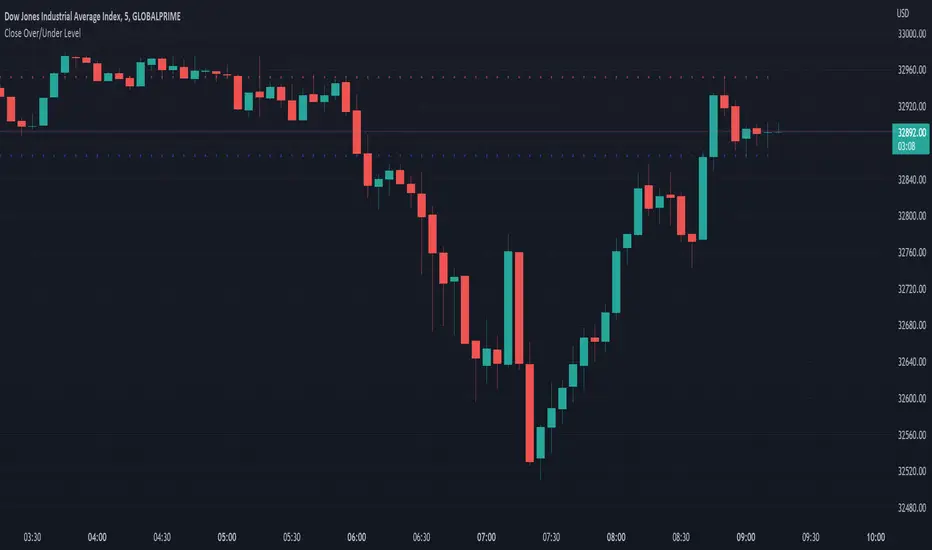
Close Over/Under LevelIf you want to be alerted when a price closes above or below a given level(s), then this indicator is for you! 😁 Whether you're looking for a breakout, or some change of structure, etc, this should come in handy.
Usage:
Just add a level(s) (anything above 0).
Optionally plot lines.
Set alerts as normal.
Enjoy!