Low Volatility Breakout + TP/SL Levels█ OVERVIEW
"Low Volatility Breakout + TP/SL Levels" is a breakout indicator designed to detect and trade breakouts from periods of low volatility (consolidation). Unlike classic strategies based on fixed support/resistance levels, this indicator dynamically identifies consolidations characterized by small candle bodies and only generates a signal when the breakout occurs with a large, decisive candle. It also automatically plots 3 Take Profit levels and a Stop Loss (with two calculation modes), making it a complete breakout trading tool.
█ CONCEPTS
The strongest market moves most often start after a prolonged period of very low volatility — when candles become small and the market "falls asleep". The indicator first detects such consolidations (small bodies for at least X bars), draws a box around them, and then waits for a breakout with a candle significantly larger than the average. Additional filters (e.g., the box height cannot exceed the average candle body by too much) eliminate false consolidations and volatility traps. Immediately after the breakout, TP1, TP2, TP3, and SL levels are plotted.
█ FEATURES
Dynamic detection of low-volatility consolidations
- candles with small bodies (< average body × consolidationMultiplier)
- minimum number of bars in consolidation: confirmBars (default 5)
Automatic drawing of consolidation boxes
- green (bullish) or red (bearish) with transparent background (85)
- adjustable border thickness (border_width 1–5)
- box height filter (boxHeightMultiplier, default 6.0 × average body) – removes overly stretched/false consolidations
Breakout conditions
- current candle must be larger than average body × threshold (default 1.5)
- must be the largest candle in the entire consolidation
- must close above the highest high (long) or below the lowest low (short)
Breakout signals
- small green triangles below the bar (long)
- small red triangles above the bar (short)
Automatic Take Profit and Stop Loss levels (drawn 5 bars forward)
- two calculation modes:
• Candle Multiplier – based on average true range (high-low) over tp_sl_length period
• Percentage – fixed percentage from breakout close price (percentages must be manually adjusted to the asset and timeframe)
- 3 TP levels (default 2×, 3×, 4× or 2%, 3%, 4%)
- 1 SL level (default 2× or 1.5%)
Live TP/SL price table (top-right corner)
- displays exact current values of SL, TP1, TP2, TP3 immediately after each new signal
- colors identical to drawn lines (red background for SL, green for TP levels)
- updates automatically with every new breakout
Built-in alerts
- “Bullish Breakout Alert” and “Bearish Breakout Alert”
█ HOW TO USE
Add the indicator to your TradingView chart → Indicators → search “Low Volatility Breakout + TP/SL Levels”.
After each valid breakout you will immediately see:
- the colored box
- signal triangle
- horizontal TP/SL lines
- updated table in the top-right corner showing precise price levels for the current trade
Key settings to adjust:
Consolidation Settings
- Volatility Window (length) – period for average body calculation (default 20)
- Consolidation Multiplier – how small bodies must be to count as consolidation (default 2.0)
- Breakout Multiplier – minimum size of breakout candle (default 1.5)
- Box Height Multiplier – maximum allowed box height (default 6.0)
- Min Consolidation Bars – minimum bars required (default 5)
Risk Management Settings
- Choose TP/SL mode: Candle Multiplier or Percentage
- Adjust TP1–3 and SL multipliers/percentages to match your risk management style
Signal interpretation:
- Green triangle below bar + green box + green TP levels in table = long signal
- Red triangle above bar + red box + red SL level in table = short signal
- Boxes remain on chart until broken — they highlight accumulation/distribution zones
█ APPLICATIONS
- Trading breakouts from consolidation on all markets and timeframes
- Recommended to trade in the direction of the higher-timeframe trend or with additional confirmations (e.g., key level breaks). Aggressive mode (trading both directions) is also possible — provided box and TP/SL settings are properly optimized
- Experiment with different TP/SL ratios — higher reward-to-risk setups (e.g., SL 1×, TP3 6–8×) with lower win rate are often more profitable in the long run
- Strongly encourage testing various box parameters (consolidationMultiplier, boxHeightMultiplier, confirmBars) — small changes can dramatically affect signal frequency and quality
█ NOTES
Always test and optimize parameters for the specific instrument and timeframe.
Cerca negli script per "breakout"

ORB Breakout Strategy w/ Filters - Dynamic Sizing - MTFHere is a comprehensive description of the strategy, written in a clear and structured format. You can use this for your script's "how-to-use" guide or documentation.
---
## 📈 Opening Range Breakout (ORB) Strategy
This is a comprehensive, multi-timeframe strategy built for trading opening range breakouts. It is designed with a "filters-first" approach, allowing you to validate a breakout with trend, volume, and volatility.
The strategy's core power comes from its flexibility. You can trade on a low timeframe (like a 1-minute chart) while basing your breakout levels on a higher timeframe's opening bar (e.g., the first 15-minute bar). It includes dynamic position sizing based on risk and a wide array of advanced exit management options.
### Key Features
* **Multi-Timeframe Opening Range:** The core of the strategy. You can define the "Opening Range" timeframe (5, 10, 15, 30, or 60 min) *independently* of your chart timeframe.
* **Custom Trading Session:** Define the exact session (e.g., "0930-1600" in "America/New_York") you want to trade.
* **One Trade Per Session:** The strategy will only take the *first valid breakout* signal per day to avoid over-trading.
---
### 🚦 Entry Signals & Filters
A trade is only initiated when the price closes above the Session High or below the Session Low **AND** all active filters are passed.
* **Trend Filter:** (Optional) Requires price to be above a long-term MA (e.g., 100 EMA) for long trades and below it for short trades.
* **Volume Filter:** (Optional) Requires the breakout bar's volume to be a specified multiplier (e.g., 1.5x) of the recent average volume.
* **Volatility Filter:** (Optional) Requires the current ATR to be higher than its long-term average, ensuring you only trade during periods of expanding volatility.
* **Direction Filter:** Allows you to isolate the strategy to **Long Only**, **Short Only**, or **Both**.
---
### 💰 Dynamic Position Sizing
The strategy includes a robust "Risk %" sizing model.
* **Risk-Based Sizing:** Instead of fixed contracts, it calculates the position size based on your **Account Size**, **Risk % per Trade**, and the **Stop Loss distance**.
* **Auto-Detect Point Value:** It automatically detects the correct point value for popular futures contracts (ES, NQ, MES, MNQ) and provides a manual override for other assets.
---
### 📤 Exit & Risk Management
This strategy features a multi-layered exit system, giving you complete control over how trades are managed.
#### 1. Stop Loss (SL)
Your initial stop loss can be calculated using a fixed **Tick** offset or an **ATR** multiplier. It can be anchored from two different points:
* **Breakout Level:** The stop is placed relative to the `sessionHigh` or `sessionLow` level.
* **Entry Bar:** The stop is placed relative to the high/low of the bar that *triggered* the entry.
#### 2. Take Profit (TP)
A standard Take Profit can be set using a fixed **Tick** offset or an **ATR** multiplier.
#### 3. Advanced Exit Logic
These options override the standard Take Profit to allow for more dynamic trade management:
* **Trailing Take Profit (TTP):**
* **Fixed/ATR Trail:** A standard trailing stop that activates after price moves a certain amount in your favor.
* **MA Price Cross:** Exits the trade as soon as the price closes across a fast-moving average (e.g., 9-EMA).
* **MA Crossover:** Exits the trade as soon as a fast MA crosses below a slow MA (for longs) or above (for shorts).
* **Close on Reversal:** (Optional) Exits immediately if the **very next bar** after entry closes back *inside* the opening range (a "failed breakout" signal).
* **Close on Opposite Range Cross:** (Optional) Exits a long trade if the price ever closes below the `sessionLow` (and vice-versa for shorts).
* **End of Session Exit:** All open positions are automatically closed at the end of the defined trading session.

STEVEN Breakout Scalper (M1/M5)# ✅ Checklist for Trading with the Breakout Indicator + VWAP
> **Designed for scalping/M5 in crypto using your breakout indicator and VWAP**
> Objective: trade only valid breakouts with confirmation and discipline
---
## 🕒 PRE-MARKET / PRE-SESSION
**General context**
* ☐ Identified major trend (H1 / M15)
* ☐ Reviewed relevant news
* ☐ Price relative to VWAP:
* ☐ Above → LONG bias
* ☐ Below → SHORT bias
* ☐ DO NOT trade if the price is “crushed” above the VWAP with no direction
* ☐ Marked supports and resistances for the day
* ☐ Identified liquidity zones / swings
---
## 🎯 ENTRY SETUP (Breakout Setup)
**Indicator Conditions**
* ☐ Breakout signal appears
* ☐ Previous marked line (light blue) was broken with a strong candle
* ☐ It is not a false breakout (long wick without body)
**Additional Confirmation (minimum 2 of these)**
* ☐ Candle close outside the level
* ☐ Retest at broken level (pullback)
* ☐ Increasing volume
* ☐ RSI > 50 for long / < 50 for short
* ☐ Trade in favor of VWAP (NOT against VWAP trend)
**VWAP Rules**
* ☐ Do not trade breakouts against VWAP
* ☐ If breakout coincides with bounce in VWAP = strong entry
* ☐ Price far from VWAP = take more aggressive partial
**Initial Management**
* ☐ Stop Loss placed below/above the broken level
* ☐ Minimum TP 1:1.5
* ☐ Calculated position size
* ☐ No FOMO — if it breaks without me, I let it go
---
## 📈 DURING THE TRADE
* ☐ I keep the stop until I see a clear structure
Translated with DeepL.com (free version)

Killzone Session High/Low Levels [SmartFoxy]Killzone Session High/Low Levels
The Killzone Session High/Low Levels indicator by SmartFoxy provides a complete intraday framework for understanding session-based liquidity, market structure rotation, and breakout behavior across global trading sessions.
It automatically plots the High/Low ranges for each selected session, highlights session killzones, and tracks breakout events with optional alerts.
This tool is designed for traders who rely on session dynamics (Asia, Frankfurt, London, New York) to identify liquidity targets, sweep zones, key ranges, and continuation/reversal opportunities.
________________________________________
How It Works
The indicator detects the active trading sessions for each day and builds structural High/Low ranges for them:
• Asia Session Range (High/Low);
• Frankfurt Session Range;
• London Session Range;
• New York Session Range;
• Optional custom session (NY Open, or any killzone).
For each session, the script can display:
• Session box or column;
• High/Low levels;
• Labels for every range (H/L);
• True session boundaries using user-defined timezone;
• Auto-extended levels up to the latest candle;
• Break levels after a breakout;
• Conditional removal or recoloring after a level is breached.
This gives traders a clean visual map of session liquidity and how price interacts with it throughout the day.
________________________________________
Key Features
1. Multiple Global Sessions •➤ Asia, Frankfurt, London, New York, plus one custom session for advanced killzone mapping.
2. Session High/Low Liquidity Levels •➤ Automatic plotting of every session’s High and Low, with optional labels and price markers.
3. Session Boxes or Columns •➤ Two display modes allow traders to visualize the session either as a filled box or a clear vertical column.
4. Breakout Logic & Temporary Levels .
When price breaks a session High/Low:
• Levels can be extended for a selected number of bars
• Or removed instantly after a breakout
• Or recolored to highlight the sweep event
This enables clean identification of liquidity grabs, breakouts, and continuation setups.
5. Alerts for Session Breakouts .
Set alerts when price breaks:
• Any session level
• Only levels formed on the current day
Perfect for traders who want real-time notifications of sweeps or key structure breaks.
6. Full Customization
You can configure:
• Session times;
• Timezone;
• Colors;
• Labels;
• Line styles and widths;
• Breakout behavior;
• Killzone range handling.
Everything is adjustable to match any trading style.
________________________________________
How to Use
1. Enable the sessions you want to track •➤ Asia, Frankfurt, London, New York, or custom.
2. Choose display mode
Box mode for visual range blocks;
Column mode for clean vertical alignment.
3. Enable High/Low Levels .
These act as liquidity magnets and key rejection zones.
4. Turn on Breakout Levels (optional)
Useful for spotting sweeps and continuation setups.
5. Turn on Alerts if you want notifications when price breaks levels.
6. Use session levels as liquidity reference points .
They work exceptionally well with smart money concepts (SMC), ICT, and intraday structure analysis.
________________________________________
Why This Indicator Is Useful
Shows exactly where liquidity is placed each session;
Highlights market structure transitions as sessions hand over control;
Helps identify stop hunts, sweeps, reversals, and continuation patterns;
Provides real-time alerts for structural breaks;
Organizes the chart and reduces noise;
Works with any intraday timeframe and any market.
This makes it valuable for scalpers, day traders, and SMC/ICT-style analysts.
________________________________________
Summary
Killzone Session High/Low Levels delivers a complete, highly customizable intraday mapping system based on global trading sessions.
It clarifies the session structure, reveals liquidity targets, and empowers traders to make confident trading decisions using clean, objective market data.

London Breakout Structure by Ale 2This indicator identifies market structure breakouts (CHOCH/BOS) within a specific London session window, highlighting potential breakout trades with automatic entry, stop loss (SL), and take profit (TP) levels.
It helps traders focus on high-probability breakouts when volatility increases after the Asian session, using price structure, ATR-based volatility filters, and a custom risk/reward setup.
🔹 Example of Strategy Application
Define your session (e.g. 04:00 to 05:00).
Wait for a CHOCH (Change of Character) inside this session.
If a bullish CHOCH occurs → go LONG at candle close.
If a bearish CHOCH occurs → go SHORT at candle close.
SL is set below/above the previous swing using ATR × multiplier.
TP is calculated automatically based on your R:R ratio.
📊 Example:
When price breaks above the last swing high within the session, a “BUY” label appears and the indicator draws Entry, SL, and TP levels automatically.
If the breakout fails and price closes below the opposite structure, a “SELL” signal will replace the bullish setup.
🔹 Details
The logic is based on structural shifts (CHOCH/BOS):
A CHOCH occurs when price breaks and closes beyond the most recent high/low.
The indicator dynamically detects these shifts in structure, validating them only inside your chosen time window (e.g. the London Open).
The ATR filter ensures setups are valid only when the range has enough volatility, avoiding false signals in low-volume hours.
You can also visualize:
The session area (purple background)
Entry, Stop Loss, and Take Profit levels
Direction labels (BUY/SELL)
ATR line for volatility context
🔹 Configuration
Start / End Hour: define your preferred trading window.
ATR Length & Multiplier: adjust for volatility.
Risk/Reward Ratio: set your desired R:R (default 1:2).
Minimum Range Filter: avoids signals with tight SLs.
Alerts: receive notifications when breakout conditions occur.
🔹 Recommendations
Works best on 15m or 5m charts during London session.
Designed for breakout and structure-based traders.
Works on Forex, Crypto, and Indices.
Ideal as a visual and educational tool for understanding BOS/CHOCH behavior.

Momentum Breakout Filter + ATR ZonesMomentum Breakout Filter + ATR Zones - User Guide
What This Indicator Does
This indicator helps you with your MACD + volume momentum strategy by:
Filtering out fake breakouts - Shows ⚠️ warnings when breakouts lack confirmation
Showing clear entry signals - 🚀 LONG and 🔻 SHORT labels when all conditions align
Automatic stop loss & profit targets - Based on ATR (Average True Range)
Visual trend confirmation - Background color + EMA alignment
Signal Types
🚀 LONG Entry Signal (Green Label)
Appears when ALL conditions met:
✅ MACD crosses above signal line
✅ Volume > 1.5× average
✅ Price > EMA 9 > EMA 21 > EMA 200 (bullish trend)
✅ Price closes above recent 20-bar high
🔻 SHORT Entry Signal (Red Label)
Appears when ALL conditions met:
✅ MACD crosses below signal line
✅ Volume > 1.5× average
✅ Price < EMA 9 < EMA 21 < EMA 200 (bearish trend)
✅ Price closes below recent 20-bar low
⚠️ FAKE Breakout Warning (Orange Label)
Appears when price breaks high/low BUT lacks confirmation:
❌ Low volume (below 1.5× average), OR
❌ Wick break only (didn't close through level), OR
❌ MACD not aligned with direction
Hover over the warning label to see what's missing!
ATR Stop Loss & Targets
When you get a signal, colored lines automatically appear:
Long Position
Red solid line = Stop Loss (Entry - 1.5×ATR)
Green dashed lines = Profit Targets:
Target 1: Entry + 2×ATR
Target 2: Entry + 3×ATR
Target 3: Entry + 4×ATR
Short Position
Red solid line = Stop Loss (Entry + 1.5×ATR)
Green dashed lines = Profit Targets:
Target 1: Entry - 2×ATR
Target 2: Entry - 3×ATR
Target 3: Entry - 4×ATR
The lines move with each bar until you exit the position.
Chart Elements
Moving Averages
Blue line = EMA 9 (fast)
Orange line = EMA 21 (medium)
White line = EMA 200 (trend filter)
Volume
Yellow bars = High volume (above threshold)
Gray bars = Normal volume
Background Color
Light green = Bullish trend (all EMAs aligned up)
Light red = Bearish trend (all EMAs aligned down)
No color = Neutral/mixed
MACD (Bottom Pane)
Green/Red columns = MACD Histogram
Blue line = MACD Line
Orange line = Signal Line
Info Dashboard (Bottom Right)
ItemWhat It ShowsVolumeCurrent volume vs average (✓ HIGH or ✗ Low)MACDDirection (BULLISH or BEARISH)TrendEMA alignment (BULL, BEAR, or NEUTRAL)ATRCurrent ATR value in dollarsPositionCurrent position (LONG, SHORT, or NONE)R:RRisk-to-Reward ratio (shows when in position)
How To Use It
Basic Workflow
Wait for setup
Watch for MACD to approach signal line
Volume should be building
Price should be near EMA structure
Get confirmation
Wait for 🚀 LONG or 🔻 SHORT label
Check dashboard shows "✓ HIGH" volume
Verify trend is aligned (green or red background)
Enter the trade
Enter when signal appears
Note your stop loss (red line)
Note your targets (green dashed lines)
Manage the trade
Exit at first target for partial profit
Move stop to breakeven
Trail remaining position
What To Avoid
❌ Don't trade when you see:
⚠️ FAKE labels (wait for confirmation)
Neutral background (no clear trend)
"✗ Low" volume in dashboard
MACD and Trend not aligned
Settings You Can Adjust
Volume Sensitivity
High Volume Threshold: Default 1.5×
Increase to 2.0× for cleaner signals (fewer trades)
Decrease to 1.2× for more signals (more trades)
Fake Breakout Filters
You can toggle these ON/OFF:
Volume Confirmation: Requires high volume
Close Through: Requires candle close, not just wick
MACD Alignment: Requires MACD direction match
Tip: Turn all three ON for highest quality signals
ATR Stop/Target Multipliers
Default settings (conservative):
Stop Loss: 1.5×ATR
Target 1: 2×ATR (1.33:1 R:R)
Target 2: 3×ATR (2:1 R:R)
Target 3: 4×ATR (2.67:1 R:R)
Aggressive traders might use:
Stop Loss: 1.0×ATR
Target 1: 2×ATR (2:1 R:R)
Target 2: 4×ATR (4:1 R:R)
Conservative traders might use:
Stop Loss: 2.0×ATR
Target 1: 3×ATR (1.5:1 R:R)
Target 2: 5×ATR (2.5:1 R:R)
Example Trade Scenarios
Scenario 1: Perfect Long Setup ✅
Stock consolidating near EMA 21
MACD curling up toward signal line
Volume bar turns yellow (high volume)
🚀 LONG label appears
Red stop line and green target lines appear
Result: High probability trade
Scenario 2: Fake Breakout Avoided ✅
Price breaks above resistance
Volume is normal (gray bar)
⚠️ FAKE label appears (hover shows "Low volume")
No entry signal
Price falls back below breakout level
Result: Avoided losing trade
Scenario 3: Premature Entry ❌
MACD crosses up
Volume is high
BUT trend is NEUTRAL (no background color)
No signal appears (trend filter blocks it)
Result: Avoided choppy/sideways market
Quick Reference
Entry Checklist
🚀 or 🔻 label on chart
Dashboard shows "✓ HIGH" volume
Dashboard shows aligned MACD + Trend
Colored background (green or red)
ATR lines visible
No ⚠️ FAKE warning
Exit Strategy
Target 1 (2×ATR): Take 50% profit, move stop to breakeven
Target 2 (3×ATR): Take 25% profit, trail stop
Target 3 (4×ATR): Take remaining profit or trail aggressively
Stop Loss: Exit entire position if hit
Alerts
Set up these alerts:
Long Entry: Fires when 🚀 LONG signal appears
Short Entry: Fires when 🔻 SHORT signal appears
Fake Breakout Warning: Fires when ⚠️ appears (optional)
Tips for Success
Use on 5-minute charts for day trading momentum plays
Only trade high volume stocks ($5-20 range works best)
Wait for full confirmation - don't jump early
Respect the stop loss - it's calculated based on volatility
Scale out at targets - don't hold for home runs
Avoid trading first 15 minutes - let market settle
Best during 10am-11am and 2pm-3pm - peak momentum times
Common Questions
Q: Why didn't I get a signal even though MACD crossed?
A: All conditions must be met - check dashboard for what's missing (likely volume or trend alignment)
Q: Can I use this on any timeframe?
A: Yes, but it's designed for 5-15 minute charts. On daily charts, adjust ATR multipliers higher.
Q: The stop loss seems too tight, can I widen it?
A: Yes, increase "Stop Loss (×ATR)" from 1.5 to 2.0 or 2.5 in settings.
Q: I keep seeing FAKE warnings but price keeps going - what gives?
A: The filter is conservative. You can disable some filters in settings, but expect more false signals.
Q: Can I use this for swing trading?
A: Yes, but use larger timeframes (1H or 4H) and adjust ATR multipliers up (3× for stops, 6-9× for targets).

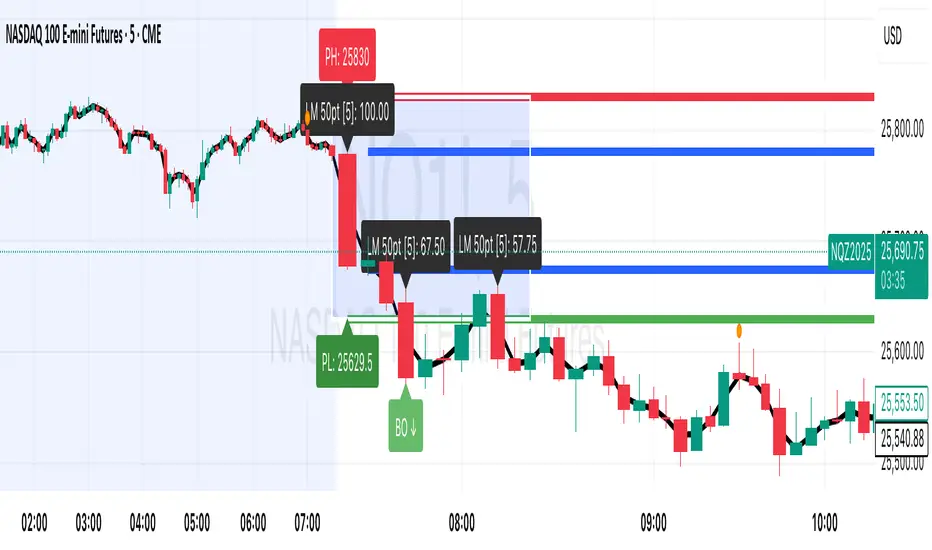
Session Breakout, Retest, Reversal + Large Move Alert# Script Description for Publication
## Script Name
**Session Breakout, Retest, Reversal + Large Move Alert**
## Short Description
A professional trading indicator that identifies session breakouts, failed retests, and large intraday price movements across any futures contract with real-time alerts and visual markers.
## Long Description
This comprehensive indicator combines session analysis with dynamic move detection, designed for active traders monitoring ES, NQ, GC, CL, and other futures contracts.
**Core Features:**
**Session Tracking:**
Automatically identifies and marks daily session breakouts and failed retests based on user-defined session times and timezones. The indicator draws visual boxes showing session highs (PH) and lows (PL), with labels marking breakout (BO) and retest failure (RF) points.
**Dynamic Large Move Detection:**
Monitors candles on any chart interval for significant price movements. The threshold is fully customizable per futures contract (default 15 points for ES/NQ/GC). When a candle closes with a move exceeding the threshold, the indicator displays a "BO" label with the exact move size and current chart timeframe.
**Real-Time Alerts:**
Triggers active alerts whenever large moves are detected, allowing traders to receive instant notifications via TradingView's alert system for timely entry or exit opportunities.
**Multi-Timeframe Compatible:**
Works seamlessly on any chart interval (1-minute through daily and beyond) without manual adjustments. The detection threshold automatically applies to the current chart's candles, with labels displaying the active timeframe.
**Universal Futures Support:**
Configurable for any futures contract by adjusting the point threshold input parameter based on each contract's typical volatility.
## Key Inputs
| Input | Default | Purpose |
|-------|---------|---------|
| Session Time | 0400-0930 | Defines trading session hours (pre-market session) |
| Session Timezone | America/New_York | Sets timezone for session detection |
| Point Move Threshold | 15.0 | Minimum point move to trigger alert (adjust per futures: ES=15, GC=15, CL=1.5) |
## How to Use
1. **Add to Chart:** Search for this indicator in TradingView and add it to your futures chart (ES, NQ, GC, CL, etc.)
2. **Configure Inputs:**
- Set session start/end times for your preferred trading session
- Adjust point threshold based on your futures contract
- Verify timezone matches your trading location
3. **Create Alerts:**
- Click "Create Alert" on the chart
- Select "Large Move Alert" from the condition dropdown
- Choose notification method (push, email, or SMS)
- Set desired frequency
4. **Monitor Moves:**
- Watch for "BO" labels appearing on confirmed candles
- Each label shows the threshold value and actual move size
- Combine with your existing trading strategy for confirmation
## Visual Elements
- **Session Box:** Blue shaded area showing session high/low range
- **PH Label:** Green label marking session high (pivot high)
- **PL Label:** Red label marking session low (pivot low)
- **BO ↑/↓ Labels:** Lime/red labels marking session breakouts
- **RF Labels:** Yellow/orange labels marking failed retests
- **Large Move Labels:** Green (bullish) or red (bearish) labels showing threshold breaches with move size
## Ideal For
- Scalpers monitoring quick intraday moves
- Day traders tracking pre-market breakouts
- Futures traders on ES, NQ, GC, CL, and other contracts
- Multi-timeframe traders watching various chart intervals simultaneously
- Alert-based automated trading systems
## Technical Details
- **Pine Script Version:** 5
- **Overlay:** Yes (displays on price chart)
- **Historical Buffer:** 5000 bars (supports 1-minute and lower timeframes)
- **Compatibility:** All futures contracts and chart intervals
## Disclaimer
This indicator is provided for educational and informational purposes only. It is not financial advice. Users should conduct their own research and consult with financial professionals before making trading decisions. Past performance does not guarantee future results.
---
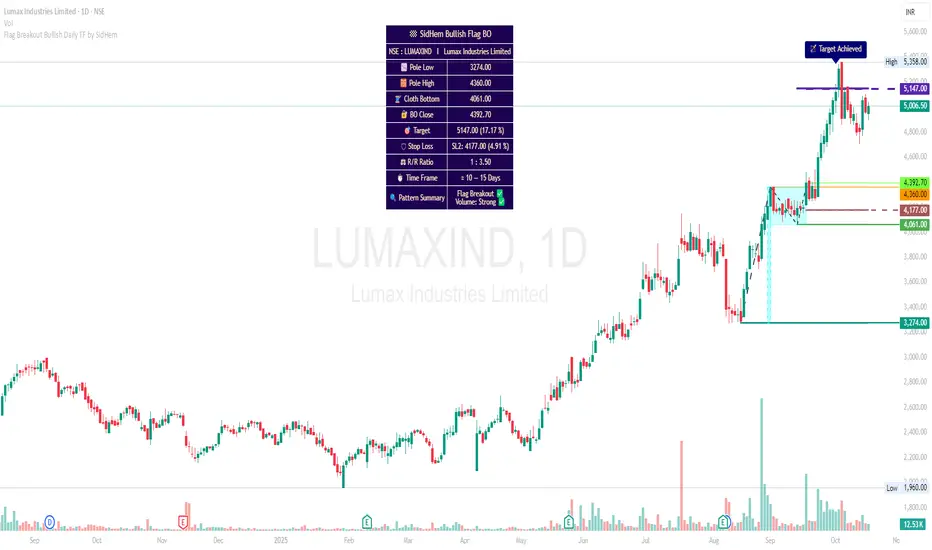
Flag Breakout Bullish Daily TF by SidHemFlag Breakout Bullish Daily TF by SidHem
Overview:
This indicator helps analyze Bullish Flag Breakouts (Rectangle) on the Daily Time Frame, providing a clear visual and tabular summary of key levels, stop-loss zones, expected pattern target and metrics. Traders can quickly assess breakout validity, risk/reward, and target achievement without manual calculations.
Please Note:
Flags are not auto-detected. Traders input four key dates: Pole start, Pole high, Cloth bottom, and Breakout candle. The indicator then calculates and plots all essential levels—including Pole, Cloth, Breakout Open/Close/Mean, Stop Loss, and Expected Pattern Target prices. This allows users who understand flag patterns but are unsure how to calculate targets or SL to efficiently work with the pattern.
Features:
Visualization: Highlights Pole, Cloth, and Breakout candles with horizontal rays, optional diagonal Pole lines, V-Arms, and filled boxes for clarity.
Dynamic Table Summary:
Displays symbol, Pole Low/High, Cloth Bottom, Breakout Open/Close/Mean, Expected Pattern Target, Stop Loss (3 methods, preferably on closing basis), Pole Height, Risk/Reward Ratio, Bars to Breakout, Estimated Time Frame, Pattern Summary, Flag Breakout status, and Volume strength.
Target & SL Labels: Plots target and SL lines on the chart with Expected Pattern Target, Target Achieved, and SL labels.
Customizable Appearance: Adjustable table rows, label sizes, colors, styles, widths, and transparency.
Purpose:
Accurately analyzes Bullish Flag Breakouts by entering only the four required dates; all plotting, calculation, and table generation are automated.
High Breakout Strategy SmartMoney// --- 1. INPUTS & CONFIGURATION ---
// Breakout
breakout_lookback = input.int(52, title="Breakout Lookback Period", minval=1)
// Trend & Trailing Stop Filter
ema_length = input.int(15, title="Stop EMA Length", minval=1)
// Risk Management
risk_percent = input.float(6.0, title="Risk Stop-Loss (%)", minval=0.1)
Institutional Compression Breakout (ICBO Algo) [@darshakssc]The ICBO Algo is a smart intraday trading tool that detects institutional compression zones followed by breakout confirmation. It combines candle range analysis, volume compression, EMA filtering, and ATR-based Risk/Reward zones to highlight high-probability trade setups with visual clarity.
This script is designed for educational and research purposes only, fully aligned with TradingView’s Pine Script policy and publishing guidelines.
🔍 Key Features
🌀 Compression Zone Detection
Identifies low-range, low-volume candles often formed before institutional breakouts.
📈📉 Breakout Signals
Triggered after confirmed price + EMA breakout post-compression.
📊 Dashboard Panel
Displays breakout phase, current R:R ratio, and zone status in real-time.
🟢🔴 Buy/Sell Labels with Emojis
Clean and non-intrusive labels for immediate action recognition.
🔔 Alerts Included
Receive real-time push, email, or webhook alerts for breakout signals.
⚙️ How It Works
Compression Phase:
When the candle range and volume are significantly lower than the moving average, the script flags it as a compression zone.
Breakout Confirmation:
A breakout signal is confirmed when the price breaks the previous high/low and is above/below the trend EMA.
Entry Logic:
📈 Buy: Price > previous high + above EMA after compression
📉 Sell: Price < previous low + below EMA after compression
⚠️ Disclaimer
This script is intended for educational and research purposes only. It does not constitute financial advice or recommendations of any kind. Always use proper risk management. Past performance does not guarantee future results.


Professional Multi-Coin Breakout Scanner [Blofin Perpetuals]Professional Multi-Coin Breakout Scanner
The **Professional Multi-Coin Breakout Scanner ** is a sophisticated technical analysis tool designed to monitor multiple cryptocurrency perpetual contracts simultaneously on the Blofin exchange. It identifies high-probability breakout opportunities using a confluence-based approach that combines multiple proven technical indicators.
This scanner employs a **multi-indicator confluence system** that generates trading signals only when multiple technical conditions align. This approach significantly reduces false signals and increases the probability of successful trades. The scanner operates on **hourly timeframes (H1)**, 15 mins, 4hour & Daily. I personally experience 1 hour and 4hour timeframe with good results, providing a balance between signal frequency and reliability.
#### Why It's Effective:
- **Institutional Activity**: High volume often indicates institutional participation
- **Breakout Validation**: Real breakouts typically have volume support
- **Liquidity Confirmation**: Ensures sufficient market interest in the move
### Signal Strength Levels:
1. **NEUTRAL** (Default State)
- Insufficient confluence of indicators
- Mixed or conflicting signals
- Market in consolidation
2. **BUY/SELL** (Normal Signal)
- Minimum 2 indicators confirming direction
- Clear directional bias
- Moderate confidence level
3. **STRONG BUY/SELL** (High Conviction)
- 3 or more indicators aligned
- Strong momentum confirmation
- High probability setup
---
## 📋 Display Components
### 1. **Scanner Table**
- **Real-time Overview**: Shows all monitored perpetual contracts
- **Price & Change**: Current price and percentage change
- **Signal Status**: LONG/SHORT/NEUTRAL positions
- **Indicator Status**: Individual indicator confirmations (↑/↓/•)
- **Score**: Numerical representation of signal strength
### 2. **On-Chart Labels**
- Appears when viewing a scanned symbol
- Shows signal type and strength
- Displays confluence score (e.g., "3/4")
- Positioned above/below price for visibility
### 3. **Market Overview Panel**
- **Active Contracts**: Number of monitored symbols
- **Market Bias**: Overall bullish/bearish sentiment
- **Signal Distribution**: Count of long vs short signals
- **Strong Signals**: Number of high-conviction setups
### 4. **Visual Elements**
- **Moving Averages**: 20 and 50-period MAs for trend context
- **Background Tinting**: Subtle green/red based on market sentiment
- **Color Coding**:
- Green: Bullish/Long signals
- Red: Bearish/Short signals
- Orange: Strong signals
- Gray: Neutral state
---
## 🎯 Trading Application
### Entry Strategy:
1. **Wait for Signal**: Monitor table for BUY/SELL signals
2. **Confirm Strength**: Prioritize STRONG signals (3+ indicators)
3. **Check Volume**: Ensure volume spike confirmation
4. **Verify Trend**: Use MA lines for trend context
5. **Execute Trade**: Enter position in signal direction
### Risk Management:
- **Stop Loss**: Use ATR value for volatility-adjusted stops
- **Position Sizing**: Stronger signals (higher scores) = larger positions
- **Multiple Timeframes**: Confirm H1 signals with H4/D1 trends
- **Correlation**: Monitor overall market bias from scanner
### Best Practices:
1. **Focus on Strong Signals**: Higher confluence = higher probability
2. **Trade with Trend**: Use MAs to confirm overall direction
3. **Volume Confirmation**: Prioritize signals with volume spikes
4. **Market Context**: Consider overall scanner bias (bullish/bearish)
5. **Risk Control**: Never risk more than 1-2% per trade
This scanner combines four powerful technical indicators into a unified system that identifies high-probability breakout opportunities across multiple perpetual contracts. By requiring confluence between indicators, it significantly reduces false signals while capturing strong trending moves. The visual presentation and alert system enable traders to monitor multiple markets efficiently and act quickly on opportunities.
**Key Advantages:**
- Multi-indicator validation reduces false signals
- Automatic scanning saves time and captures opportunities
- Professional visualization aids quick decision-making
- Adaptable parameters suit different trading styles
- Proven technical analysis principles ensure reliability
The scanner is particularly effective for:
- Swing traders seeking hourly breakouts
- Day traders monitoring multiple contracts
- Systematic traders requiring objective signals
- Risk-conscious traders preferring confluence confirmation

Trendline Breakouts With Targets [ omerprıme ]Indicator Explanation (English)
This indicator is designed to detect trendline breakouts and provide early trading signals when the price breaks key support or resistance levels.
Trendline Detection
The indicator identifies recent swing highs and lows to construct dynamic trendlines.
These trendlines act as support in an uptrend and resistance in a downtrend.
Breakout Confirmation
When the price closes above a resistance trendline, the indicator generates a bullish breakout signal.
When the price closes below a support trendline, it generates a bearish breakout signal.
Filtering False Signals
To reduce false breakouts, additional conditions (such as candle confirmation, volume filters, or price momentum) can be applied.
Only significant and confirmed breakouts are highlighted.
Trading Logic
Buy signals are triggered when the price breaks upward through resistance with confirmation.
Sell signals are triggered when the price breaks downward through support with confirmation.

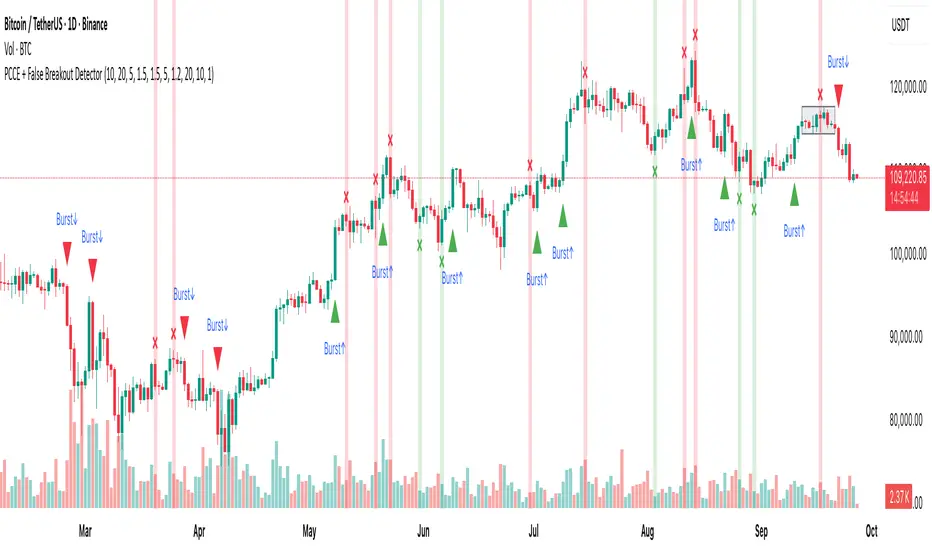
PCCE + False Breakout DetectorPCCE + False Breakout Detector
Type: Invite-Only Indicator (closed source)
Purpose : Detect price compression and the first expansion after it, while flagging failed breakouts (bull/bear traps) for risk control.
1) What’s original here!
This tool integrates three behaviour-driven tests that work in a single decision flow:
A compression score built from:
(a) monotonic body shrink,
(b) wick-dominance, and
(c) relative range contraction versus history.
This is not a bands/oscillator port; it’s a structure-first filter that isolates coils.
A thrusted expansion requirement that combines real-body impulse and relative-volume participation (+ optional EMA alignment) to qualify a breakout beyond the coil envelope.
An immediate post-breakout failure test (trap logic) that checks whether the breakout re-enters the prior swing range within a short window.
Used together, these steps turn raw breaks into contextual, risk-aware events: setup → trigger → validation. That is the value of the combination.
⸻
2) Concepts behind the calculations:
Let body_t = |close_t − open_t|,
uw_t = high_t − max(open_t, close_t) (upper wick),
lw_t = min(open_t, close_t) − low_t (lower wick),
R_t(k) = highest(high, k)_t − lowest(low, k)_t (range over k bars),
MA_body(k) = SMA(body, k), MA_vol(k) = SMA(volume, k).
2.1 Compression (coil) detection
We evaluate within a window k = coilLength:
• Body shrink count: number of consecutive steps where body_(t−i) < body_(t−i−1).
• Wick dominance: AvgWickBody = avg( (uw + lw) / body ) over the window; require AvgWickBody > wickRatioMin.
• Relative range contraction: current R_t(k) must be less than α × avg( R_(t−j)(k) ) computed over a lookback of rangeWindow windows, with α < 1 (tight market).
When all three are true, we mark a coil zone; the coil bounds are High_coil = highest(high, k), Low_coil = lowest(low, k).
2.2 Expansion (“Burst”) confirmation
A breakout is only qualified when all hold on bar close:
• Direction: close > High_coil → up; close < Low_coil → down.
• Body thrust: body_t > MA_body(k) × bodyMult.
• Participation: volume_t > MA_vol(k) × volumeMultiplier.
• Trend alignment (optional): close_t > EMA(emaLen) for up / < EMA for down.
• Cooldown: t − lastSignal > cooldownBars.
If satisfied, print Burst↑ or Burst↓ on that bar.
2.3 Failed breakout (trap) detection
Let H_s and L_s be the prior swing high/low from a lookback rangeLookback (excluding the current bar). Define:
• Bull break attempt: a bar that closed above H_s.
Bull trap: within fakeoutBars bars after that attempt, any close returns below H_s. Mark ❌ red above that bar.
• Bear break attempt: a bar that closed below L_s.
Bear trap: within fakeoutBars bars after that attempt, any close returns above L_s. Mark ❌ green below that bar.
Alerts fire on bar close only.
⸻
3) What you’ll see on the chart
• Coil box: shaded envelope (tight-range bounds).
• Burst labels: Burst↑ / Burst↓ only when thrust + volume (and optional EMA) confirm the break.
• Trap markers: ❌ red (failed bullish breakout) / ❌ green (failed bearish breakout).
• Alerts: “Burst Up” and “Burst Down” (close-based).
⸻
4) How to use it
1. Preparation : When a coil box appears, mark the bounds; expect expansion risk to rise.
2. Trigger : Act only on Burst labels (they already encode body/volume thrust and optional trend).
3. Validation : If a ❌ trap prints shortly after a breakout, treat it as a warning/exit event; breakouts that re-enter the prior swing range are statistically fragile.
4. Context : Works well on 15m–4H where structure is visible. Combine with your own higher-timeframe bias, S/R, liquidity pools, and risk rules.
5. Tuning :
• Tighten/loosen coil sensitivity via coilLength, wickRatioMin, and the range contraction factor.
• Use larger bodyMult / volumeMultiplier to demand stronger breaks.
• cooldownBars controls clustering in fast sessions.
• rangeLookback and fakeoutBars control how strict the trap check is.
⸻
5) Repainting, scope, and limitations
• Burst and trap labels are evaluated on bar close; once printed, they do not repaint. Coil boxes can update while forming; they stabilize once conditions are met.
• Sudden news/illiquid periods can defeat filters; adjust multipliers and cooldown for your instrument.
• This is an indicator, not a strategy; it does not publish PnL, win-rate, or forward promises.
Trendline Breakout Strategy [KedArc Quant] Description
A single, rule-based system that builds two trendlines from confirmed swing pivots and trades their breakouts, with optional retest, trend-regime gates (EMA / HTF EMA), and ATR-based risk. All parts serve one decision flow: structure → breakout → gated entry → managed risk.
What it does (for traders)
Draws Up line (teal) through the last two Higher Lows and Down line (red) through the last two Lower Highs, then extends them forward.
Long when price breaks above red; Short when price breaks below teal.
Optional Retest entry: after a break, wait for a pullback toward the broken line within an ATR-scaled buffer.
Uses ATR stop and R-multiple target so risk is consistent across symbols/timeframes.
Labels HL1/HL2/LH1/LH2 so non-coders can verify which pivots built each line.
Why these components are combined
Pure breakout systems on trendlines suffer from three practical issues:
False breaks in chop → solved by trend-regime gates (EMA / HTF EMA) that only allow trades aligned with the prevailing trend.
Uneven volatility across markets/timeframes → solved by ATR-based stop/target, normalizing distance so R-multiples are comparable.
First break whipsaws near wedge apices → mitigated by the optional retest rule that demands a pullback/hold before entry.
These modules are not separate indicators with their own signals. They are support roles inside one method.
The pivot engine defines structure, the breakout detector defines signal, the regime gates decide if we’re allowed to take that signal, and the ATR module sizes risk.
Together they make the trendline breakout usable, testable, and explainable.
How it works (mechanism; each component explained)
1) Pivot engine (structure, non-repainting)
Swings are confirmed with ta.pivotlow/high(L, R). A pivot only exists after R bars (no look-ahead), so once plotted, the line built from those pivots will not repaint.
2) Trendline builder (geometry)
Teal line updates when two consecutive pivot lows satisfy HL2.price > HL1.price (and HL2 occurs after HL1).
Red line updates when two consecutive pivot highs satisfy LH2.price < LH1.price.
Lines are extended right and their current value is read every bar via line.get_price().
3) Breakout detector (signal)
On every bar, compute:
crossover(close, redLine) ⇒ Long breakout
crossunder(close, tealLine) ⇒ Short breakdown
4) Regime gates (trend filters, not separate signals)
EMA gate: allow longs only if close > EMA(len), shorts only if close < EMA(len).
HTF EMA gate (optional): same rule on a higher timeframe to avoid fighting the larger trend.
These do not create entries; they simply permit or block the breakout signal.
5) Retest module (optional confirmation)
After a breakout, record the line price. A valid retest occurs if price pulls back within an ATR-scaled buffer toward that broken line and then closes back in the breakout direction.
This reduces first-tick fakeouts.
6) Risk module (position exit)
Initial stop = ATR(len) × atrMult from entry.
Target = tpR × (ATR × atrMult) (e.g., 2R).
This keeps results consistent across instruments/timeframes.
Entries & exits
Long entry
Base: close breaks above red and passes EMA/HTF gates.
Retest (if enabled): after the break, price pulls back near the broken red line (within the ATR buffer) and holds; then enter.
Short entry
Mirror logic with teal (break below & gates), optionally with a retest.
Exit
strategy.exit places ATR stop & R-multiple target automatically.
Optional “flip”: close if the opposite base signal triggers.
How to use it (step-by-step)
Timeframe: 1–15m for intraday, 1–4h for swing.
Start defaults: Pivot L/R = 5, EMA len = 200, ATR len = 14, ATR mult = 2, TP = 2R, Retest = ON.
Tune sensitivity:
Faster lines (more trades): set L/R = 3–4.
Fewer counter-trend trades: enable HTF EMA (e.g., 60-min or Daily).
Visual audit: labels HL1/HL2 & LH1/LH2 show which pivots built each line—verify by eye.
Alerts: use Long breakout, Short breakdown, and Retest alerts to automate.
Originality (why it merits publication)
Trades the visualization: many “auto-trendline” tools only draw lines; this one turns them into testable, alertable rules.
Integrated design: each component has a defined role in the same pipeline—no unrelated indicators bolted together.
Transparent & non-repainting: pivot confirmation removes look-ahead; labels let non-coders understand the setup that produced each signal.
Notes & limitations
Lines update only after pivot confirmation; that lag is intentional to avoid repainting.
Breakouts near an apex can whipsaw; prefer Retest and/or HTF gate in choppy regimes.
Backtests are idealized; forward-test and size risk appropriately.
⚠️ Disclaimer
This script is provided for educational purposes only.
Past performance does not guarantee future results.
Trading involves risk, and users should exercise caution and use proper risk management when applying this strategy.

Volatility Cone Forecaster Lite [PhenLabs]📊 Volatility Cone Forecaster
Version: PineScript™v6
📌Description
The Volatility Cone Forecaster (VCF) is an advanced indicator designed to provide traders with a forward-looking perspective on market volatility. Instead of merely measuring past price fluctuations, the VCF analyzes historical volatility data to project a statistical “cone” that outlines a probable range for future price movements. Its core purpose is to contextualize the current market environment, helping traders to anticipate potential shifts from low to high volatility periods (and vice versa). By identifying whether volatility is expanding or contracting relative to historical norms, it solves the critical problem of preparing for significant market moves before they happen, offering a clear statistical edge in strategy development.
This indicator moves beyond lagging measures by employing percentile analysis to rank the current volatility state. This allows traders to understand not just what volatility is, but how significant it is compared to the recent past. The VCF is built for discretionary traders, system developers, and options strategists who need a sophisticated understanding of market dynamics to manage risk and identify high-probability opportunities.
🚀Points of Innovation
Forward-Looking Volatility Projection: Unlike standard indicators that only show historical data, the VCF projects a statistical cone of future volatility.
Percentile-Based Regime Analysis: Ranks current volatility against historical data (e.g., 90th, 75th percentiles) to provide objective context.
Automated Regime Detection: Automatically identifies and labels the market as being in a ‘High’, ‘Low’, or ‘Normal’ volatility regime.
Expansion & Contraction Signals: Clearly indicates whether volatility is currently increasing or decreasing, signaling shifts in market energy.
Integrated ATR Comparison: Plots an ATR-equivalent volatility measure to offer a familiar point of reference against the statistical model.
Dynamic Visual Modeling: The cone visualization directly on the price chart provides an intuitive guide for future expected price ranges.
🔧Core Components
Realized Volatility Engine: Calculates historical volatility using log returns over multiple user-defined lookback periods (short, medium, long) for a comprehensive view.
Percentile Analysis Module: A custom function calculates the 10th, 25th, 50th, 75th, and 90th percentiles of volatility over a long-term lookback (e.g., 252 days).
Forward Projection Calculator: Uses the calculated volatility percentiles to mathematically derive and draw the upper and lower bounds of the future volatility cone.
Volatility Regime Classifier: A logic-based system that compares current volatility to the historical percentile bands to classify the market state.
🔥Key Features
Customizable Lookback Periods: Adjust short, medium, and long-term lookbacks to fine-tune the indicator’s sensitivity to different market cycles.
Configurable Forward Projection: Set the number of days for the forward cone projection to align with your specific trading horizon.
Interactive Display Options: Toggle visibility for percentile labels, ATR levels, and regime coloring to customize the chart display.
Data-Rich Information Table: A clean, on-screen table displays all key metrics, including current volatility, percentile rank, regime, and trend.
Built-in Alert Conditions: Set alerts for critical events like volatility crossing the 90th percentile, dropping below the 10th, or switching between expansion and contraction.
🎨Visualization
Volatility Cone: Shaded bands projected onto the future price axis, representing the probable price range at different statistical confidence levels (e.g., 75th-90th percentile).
Color-Coded Volatility Line: The primary volatility plot dynamically changes color (e.g., red for high, green for low) to reflect the current volatility regime, providing instant context.
Historical Percentile Bands: Horizontal lines plotted across the indicator pane mark the key percentile levels, showing how current volatility compares to the past.
On-Chart Labels: Clear labels automatically display the current volatility reading, its percentile rank, the detected regime, and trend (Expanding/Contracting).
📖Usage Guidelines
Setting Categories
Short-term Lookback: Default: 10, Range: 5-50. Controls the most sensitive volatility calculation.
Medium-term Lookback: Default: 21, Range: 10-100. The primary input for the current volatility reading.
Long-term Lookback: Default: 63, Range: 30-252. Provides a baseline for long-term market character.
Percentile Lookback Period: Default: 252, Range: 100-1000. Defines the period for historical ranking; 252 represents one trading year.
Forward Projection Days: Default: 21, Range: 5-63. Determines how many bars into the future the cone is projected.
✅Best Use Cases
Breakout Trading: Identify periods of deep consolidation when volatility falls to low percentile ranks (e.g., below 25th) and begins to expand, signaling a potential breakout.
Mean Reversion Strategies: Target trades when volatility reaches extreme high percentile ranks (e.g., above 90th), as these periods are often unsustainable and lead to contraction.
Options Strategy: Use the cone’s projected upper and lower bounds to help select strike prices for strategies like iron condors or straddles.
Risk Management: Widen stop-losses and reduce position sizes when the indicator signals a transition into a ‘High’ volatility regime.
⚠️Limitations
Probabilistic, Not Predictive: The cone represents a statistical probability, not a guarantee of future price action. Extreme, unpredictable news events can drive prices outside the cone.
Lagging by Nature: All calculations are based on historical price data, meaning the indicator will always react to, not pre-empt, market changes.
Non-Directional: The indicator forecasts the *magnitude* of future moves, not the *direction*. It should be paired with a directional analysis tool.
💡What Makes This Unique
Forward Projection: Its primary distinction is projecting a data-driven, statistical forecast of future volatility, which standard oscillators do not do.
Contextual Analysis: It doesn’t just provide a number; it tells you what that number means through percentile ranking and automated regime classification.
🔬How It Works
1. Data Calculation:
The indicator first calculates the logarithmic returns of the asset’s price. It then computes the annualized standard deviation of these returns over short, medium, and long-term lookback periods to generate realized volatility readings.
2. Percentile Ranking:
Using a 252-day lookback, it analyzes the history of the medium-term volatility and determines the values that correspond to the 10th, 25th, 50th, 75th, and 90th percentiles. This builds a statistical map of the asset’s volatility behavior.
3. Cone Projection:
Finally, it takes these historical percentile values and projects them forward in time, calculating the potential upper and lower price bounds based on what would happen if volatility were to run at those levels over the next 21 days.
💡Note:
The Volatility Cone Forecaster is most effective on daily and weekly charts where statistical volatility models are more reliable. For lower timeframes, consider shortening the lookback periods. Always use this indicator as part of a comprehensive trading plan that includes other forms of analysis.

CIAN - Breakout Auto Entry v2.0📌 Indicator Description — CIAN - Breakout Auto Entry
CIAN - Breakout Auto Entry is a script designed to automatically detect entry opportunities during breakouts from consolidation zones, based on professional technical criteria used by momentum and breakout traders. This tool clearly visualizes the entry level, Stop Loss (SL) and Take Profit (TP) zones, helping you maintain a structured and disciplined trading plan.
🧠 What does this indicator do?
It detects breakouts from prior bases when the following key conditions are met:
Price is above the 8, 21, and 50 EMAs.
Volume is above the average (i.e. greater than the 20-period SMA).
Candle closes above the high of the last 10 days.
It then automatically draws:
📦 Green TP zone (based on configurable R/R).
📦 Red SL zone (set at the previous candle’s low).
📘 Precise entry level at the breakout point.
It also deletes previous boxes when a new signal appears, keeping the chart clean.
Includes an integrated alert that notifies you as soon as a valid breakout is detected.
🛠️ Configurable Parameters:
Fast, medium, and slow EMAs (default: 8, 21, 50).
Risk/Reward Ratio (TP/SL), default value: 1.2.
Visual duration of boxes (default: 5 bars).
🎯 Ideal for:
Swing Traders
Breakout Traders
Users of 1D or 4H timeframes as their main setup

Guardian Breakout System with Trailing Stop AlertGuardian Breakout System (v5) Smart Trend & Breakout Indicator
Take your trading to the next level with the Guardian Breakout System , a smart, all-in-one indicator designed to spot high-probability bullish breakouts while keeping risk under control. Perfect for Daily, Weekly, and Monthly charts, this tool combines trend analysis, volume, RSI, doji detection, and ATR-based trailing stops into one powerful system.
Why traders love it:
Spot Uptrends Early: Tracks the 20-day and 50-day SMAs to identify strong bullish trends.
Smart Pullback Entries: Detects minor pullbacks with bullish doji signals near the 20-day SMA.
Breakouts with Confidence: Confirms signals with volume spikes, RSI < 63, and 10-day SMA direction.
Dynamic ATR Trailing Stops: Automatically adjusts stop levels to lock in profits as the price moves higher.
Next-Bar Entry Option: Safer entries on higher timeframes like daily or weekly charts.
Visual Markers & Alerts: Green arrows mark entries, red arrows and dots mark stop hits, with built-in alerts for breakouts and stop triggers.
How it works:
1. Identify a bullish trend.
2. Watch for pullbacks with doji candles near the 20-day SMA.
3. Enter on breakout above the doji high, or on the next bar’s open.
4. Use ATR-based trailing stops to protect profits.
The Guardian Breakout System gives traders a clear, visual, and reliable way to enter trending markets with confidence while managing risk automatically.
Opening Range BreakoutsOpening Range Breakouts (ORB) Indicator
This is a powerful trading range breakout indicator, specifically designed to capture breakout opportunities across different trading sessions.
Key Features
1. Multi-session Monitoring
• Opening Range (default 06:00–06:30)
• Asian Session Range (default 08:00–08:30)
• European Session Range (default 15:30–16:00)
• U.S. Session Range (default 21:30–22:00)
2. Range Display
• High, Low, and Midpoint lines for each session
• Range boxes with different fill colors
• Fully customizable colors and transparency for each session
• Option to show/hide historical data
3. Breakout Targets
• Set target levels as a percentage of the range
• Supports Adaptive or Extension display modes
• Customizable target line styles and colors
• Choose between Close Price or High/Low as trigger conditions
4. Smart Gap Handling
• Option to ignore price gaps
• Smart calculation of ranges in gap scenarios
5. Flexible Time Zone Settings
• Supports all major global time zones
• Ensures accurate display across different markets
Usage Tips
1. Select appropriate timeframes based on the instrument traded; sub-daily timeframes are recommended.
2. Enable/disable trading sessions according to your trading style.
3. Adjust target percentages to fit the volatility profile of different instruments.
4. Combine with other technical indicators to validate breakout signals.
Notes
1. Timeframe must be lower than Daily.
2. It is recommended to combine with volume or other indicators in live trading.
3. Session times may need to be adjusted for different markets.
4. Target line settings should reflect actual market volatility.
This indicator is particularly suitable for intraday traders who want to capture breakout opportunities during key trading sessions. It visualizes the price ranges of major sessions, helping traders better seize market opportunities.

Rapid ORB Pro – Breakout & Fakeout Detector (Multi Sessions)"Multi-session ORB tool with breakout confirmation, fakeout detection, and volume filter for true momentum trades. DLS confusion proof"
Description
The Rapid ORB Pro indicator is designed to identify opening range breakouts (ORB) across multiple sessions and confirm whether the move is valid or a likely fakeout. This tool works on any asset and timeframe where range trading is relevant. Also coded in a way to tackle daylight saving issue around the world.
Core Concepts
1. Opening Range Breakout (ORB):
The indicator marks the defined opening range for each session and tracks when price breaks above or below this range.
2. Confirmation Rules:
A breakout is only confirmed when:
The breakout candle shows a strong body (momentum candle), not just a wick.
The candle closes beyond the prior candle’s high or low, ensuring follow-through.
The structure aligns with market flow (Higher High / Higher Low in bullish context, Lower High / Lower Low in bearish context).
These conditions help filter weak breakouts and highlight true momentum moves.
3. Fakeout Detection (FO):
If price breaks out but the very next candle closes back inside the opening range, an FO marker is plotted. This helps traders exit limit orders quickly and avoid false signals.
4. 7-Bar Check:
If no valid breakout occurs within 7 candles after the range, the indicator prints a “7” on the chart. This signals a likely choppy session where breakout trades have lower probability.
5. Volume State Table:
A table on the chart compares the breaker candle’s volume with the highest volume candle inside the opening range. This provides a quick assessment of whether the breakout was backed by strong participation (High Volume) or weaker flow (Low Volume).
Use Cases
Works on forex, indices, commodities, and crypto.
Useful for scalpers looking to catch the first breakout of the day.
Helps swing traders filter false moves in volatile sessions.
Can be applied to any range trading strategy, not limited to session opens
.
Trading Tip
Trend is your friend, with trend behind the signal probability goes high.
Check the previous session or prior day stab (PD stab).
Watch for SMT divergence forming across correlated pairs.
If SMT lines up with a signal, the breaker confirmation is stronger.
Both SMT alignment and trend behind valid breakout candle increase the probability of a sustained move.
Always start with lower time frame and go up the time frame ladder. Depending on the market you can catch move earlier within lower time frame.
Note: Each input option in this indicator includes a tooltip with detailed explanations. We recommend experimenting with the settings and backtesting to discover what aligns best with your trading style and comfort zone. By default, the confirmation filters are set to what we have found to be the most effective combinations.
Disclaimer
This indicator is for educational and informational purposes only. It does not provide financial advice or guarantee results. Trading involves significant risk, and you should carefully consider your objectives and risk tolerance before using this tool in live markets. Always conduct your own research and backtesting.

SmartPlusSmartPlus
Overview
The SmartPlus indicator is a complete framework for intraday traders. It combines key market reference points (VWAP, moving averages, and the first 15-minute high/low range) with predictive levels based on historical daily moves. Together, these elements allow traders to build directional bias, spot breakouts, and manage risk throughout the session.
Key Features
1. VWAP (Volume-Weighted Average Price)
- Plots the intraday VWAP in real time.
- VWAP acts as a central “fair value” reference point for institutional order flow.
- Price trading above VWAP generally suggests bullish bias, while below VWAP leans bearish.
2. Exponential Moving Averages (EMAs)
- Two configurable EMAs are included:
- Fast EMA (default: 21 periods)
- Slow EMA (default: 34 periods)
- Each EMA is plotted with a single, user-selectable color for clarity.
- Crossovers or alignment between price, VWAP, and EMAs help define market structure.
3. Smart Bar Coloring
- Candles automatically change color when conditions align:
- Bull Zone: Price above VWAP, Fast EMA, and Slow EMA.
- Bear Zone: Price below VWAP, Fast EMA, and Slow EMA.
- Fluorescent bar coloring helps highlight momentum zones visually without additional analysis.
4. First 15-Minute High/Low/Mid (Automatic)
- Automatically detects the first 15 minutes of each new trading day (no manual input required).
- Plots horizontal lines for:
- First 15-Minute High (green)
- First 15-Minute Low (red)
- Midpoint of that range (gray)
- Once the initial 15-minute window ends, these levels remain projected throughout the session as breakout or support/resistance zones.
- Alerts trigger when price breaks above the high or below the low after the window.
5. Daily Support/Resistance Forecast
- Uses a rolling lookback of recent daily ranges (default: 126 days).
- Tracks average up moves and down moves from the daily open.
- Optionally incorporates standard deviation for wider confidence bands.
- Plots forecast levels above/below the current day’s open for reference.
Trading Logic (How to Use)
- Bullish Bias:
- Price is above VWAP, above both EMAs, and ideally above the first 15-minute high.
- This setup suggests trend continuation or breakout opportunities on the long side.
- Bearish Bias:
- Price is below VWAP, below both EMAs, and ideally below the first 15-minute low.
- This setup suggests downward pressure or breakout opportunities on the short side.
- Neutral / Caution Zone:
- Price caught between VWAP, EMAs, or inside the 15-minute range often signals indecision.
- Best to wait for confirmation or breakout before committing to trades.
Expectations After Using It
- The script provides context and structure, not trading signals.
- It highlights where price is relative to meaningful market levels so traders can act with greater confidence.
- Combining VWAP, EMAs, and the 15-minute breakout framework helps traders stay aligned with the market’s natural rhythm.
Disclaimer
This script is a tool for market analysis and educational purposes only.
It does not constitute financial advice, trading recommendations, or guaranteed profitability.
Markets are inherently risky, and past patterns do not ensure future results.
Always combine this tool with sound risk management, personal research, and professional guidance before making any trading decisions.

Smart Bar Coloring: Tight Closes & Volume BreakoutsAdvanced Bar Coloring Indicator for Price Action and Volume Analysis
This sophisticated indicator automatically colors price bars based on two key market conditions: tight closing ranges and significant volume activity, helping traders quickly identify consolidation periods and potential breakout setups.
Key Features:
Tight Close Detection:
ATR-Based Analysis: Uses 14-period ATR to define "tight" price movement
Dual-Bar Confirmation: Requires both current and previous bar to have closing ranges ≤ 20% of ATR
Consolidation Identification: Highlights periods of reduced volatility that often precede significant moves
Customizable Color: Default amber/orange highlighting for easy visual identification
Volume Breakout Detection:
Multi-Criteria Volume Analysis: Triggers when volume exceeds any of three thresholds:
150% of 20-period volume SMA
150% of recent 3-bar average volume
150% of 50-period volume SMA
Price Action Filter: Requires bullish price action (close > previous close OR close in upper 75% of range)
Smart Volume Handling: Automatically detects and works only with instruments that have volume data
Customizable Color: Default teal highlighting for volume-driven moves
Technical Analysis Applications:
Consolidation Patterns: Identify tight trading ranges before potential breakouts
Volume Confirmation: Spot high-volume moves with supportive price action
Entry Timing: Use tight closes to identify potential accumulation zones
Breakout Validation: Volume-colored bars confirm legitimate breakout attempts
Risk Management: Tight closes often indicate lower immediate volatility
How to Use:
Amber/Orange Bars: Indicate tight closing ranges - potential accumulation or consolidation
Teal Bars: Show significant volume with bullish price action - potential breakout confirmation
Normal Bars: Standard market conditions without special highlighting
Pattern Recognition: Look for clusters of tight closes followed by volume breakouts
Technical Requirements:
Works on any timeframe
Automatically adapts to instruments with or without volume data
Compatible with all chart types and drawing tools

Nifty Smart Zones & Breakout Bars(5min TF only) by Chaitu50cNifty Smart Zones & Breakout Bars is a purpose-built intraday trading tool, tested extensively on Nifty50 and recommended for Nifty50 use only.
All default settings are optimised specifically for Nifty50 on the 5-minute timeframe for maximum accuracy and clarity.
Why Last Bar of the Session Matters
The last candle of a trading session often represents the final battle between buyers and sellers for that day.
It encapsulates closing sentiment, influenced by end-of-day positioning, profit booking, and institutional activity.
The high and low of this bar frequently act as strong intraday support/resistance in the following sessions.
Price often reacts around these levels, especially when combined with volume surges.
Core Features
Session Last-Candle Zones
Plots a horizontal box at the high and low of the last candle in each session.
Boxes extend to the right to track carry-over levels into new sessions.
Uses a stateless approach — past zones reappear if relevant.
Smart Suppression System
When more than your Base Sessions (No Suppression) are shown, newer zones overlapping or within a proximity distance (in points) of older zones are hidden.
Older zones take priority, reducing chart clutter while keeping critical levels.
Breakout Bar Coloring
Highlights breakout bars in four categories:
Up Break (1-bar)
Down Break (1-bar)
Up Break (2-bar)
Down Break (2-bar)
Breakouts use a break buffer (in ticks) to filter noise.
Toggle coloring on/off instantly.
Volume Context (User Tip)
For best use, pair with volume analysis.
High-volume breakouts from last-session zones have greater conviction and can signal sustained momentum.
Usage Recommendations
Instrument: Nifty50 only (tested & optimised).
Timeframe: 5-minute chart for best results.
Approach:
Watch for price interaction with the plotted last-session zones.
Combine zone breaks with bar color signals and volume spikes for higher-probability trades.
Use suppression to focus on key, non-redundant levels.
Why This Tool is Different
Unlike standard support/resistance plotting, this indicator focuses on session-closing levels, which are more reliable than arbitrary highs/lows because they capture the final market consensus for the session.
The proximity-based suppression ensures your chart stays clean, while breakout paints give instant visual cues for momentum shifts.
