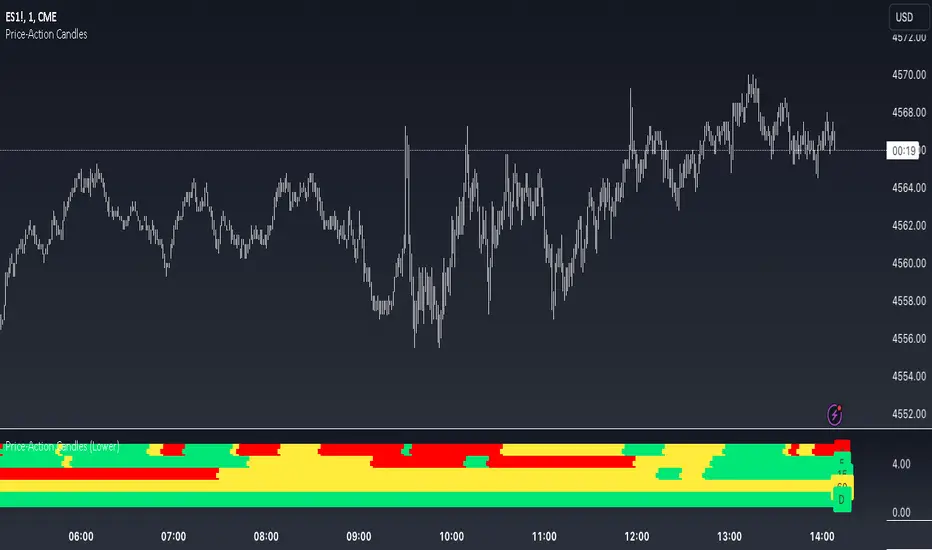
Price-Action Candles (Lower)What is a swing high or swing low?
Swing highs and lows are price extremes. For example say we set our swing length to 5. A candle that is a swing high with a swing length of 5 will have 5 bars to the left that are lower and 5 bars to the right that are lower. A candle that is a swing low with a swing length of 5 will have 5 bars to the left that are higher and 5 bars to the right that are higher.
How is the trend coloring calculated?
The trend coloring is calculated the exact same way as our trend candles study... by storing and comparing historical swing lows and swing highs.
The pinescript code goes as follows:
The pinescript code goes as follows:
var int trend = na
trend := ((hh and high >= psh) or close > csh) ? 1 : ((ll and low <= psl) or close < csl) ? -1 : lh or hl ? 0 : trend
What does that gibberish mean?
-Trend can be GREEN IF
- We have a higher high (current swing high is greater than the previous swing high) and the high is greater than the previous swing high
- OR The current close is greater than the current swing high
-Trend can be RED IF
- We have a lower low (current swing low is less than the previous swing low) and the low is less than the previous swing low
- OR The current close is less than the current swing low
-Trend can be YELLOW IF
- We have a new swing high and the new swing high is less than the previous swing high
- OR We have a new swing low and the new swing low is greater than the previous swing low
If none of the conditions above are true then we continue with whatever color the previous bar was.
What is repainting?
Repainting is "script behavior causing historical vs realtime calculations or plots to behave differently." That definition comes directly from Tradingview. If you want to read the full explanation you can visit it here www.tradingview.com . The price-action candles use swing highs and swing lows which need bars to the left (past) and bars to the right ("future") in order to confirm the swing level. Because of the need to wait for confirmation for swing levels the plot style can be repainting. The Price-Action Candles (Lower) indicator, or this indicator, has no repainting anywhere. We opt to not shift back the candle coloring which causes the repainting, but it is relevant to discuss since this indicator's sibling (Price-Action Candles) can have repainting labels.
Repaint
Here the labels are shifted back the price-action length. Repainting is not present in the Price-Candles (Lower) study, but can be found in this indicator's sibling (Price-Action Candles).
Non-Repaint
Here the labels are not shifted back or "repainted". Repainting is not present in the Price-Candles (Lower) study, but can be found in this indicator's sibling (Price-Action Candles).
Multi-timeframe Analysis
The users can view multi-timeframe historical price action trend via this lower study. Each timeframe is plotted as its own on the lower pane and you can determine what timeframe it is by the label next to the plot.
More examples
Pair the Price-Action Candles (Lower) indicator with our main price indicator that colors candles based on trend and can show price action labels.
Cerca negli script per "candle"
Price-Action CandlesWhat is a swing high or swing low?
Swing highs and lows are price extremes. For example say we set our swing length to 5. A candle that is a swing high with a swing length of 5 will have 5 bars to the left that are lower and 5 bars to the right that are lower. A candle that is a swing low with a swing length of 5 will have 5 bars to the left that are higher and 5 bars to the right that are higher.
How are the trend candles calculated?
The trend candles are calculated by storing and comparing historical swing lows and swing highs.
The pinescript code goes as follows:
The pinescript code goes as follows:
var int trend = na
trend := ((hh and high >= psh) or close > csh) ? 1 : ((ll and low <= psl) or close < csl) ? -1 : lh or hl ? 0 : trend
What does that gibberish mean?
-Candle can be GREEN IF
- We have a higher high (current swing high is greater than the previous swing high) and the high is greater than the previous swing high
- OR The current close is greater than the current swing high
-Candle can be RED IF
- We have a lower low (current swing low is less than the previous swing low) and the low is less than the previous swing low
- OR The current close is less than the current swing low
-Candle can be YELLOW IF
- We have a new swing high and the new swing high is less than the previous swing high
- OR We have a new swing low and the new swing low is greater than the previous swing low
If none of the conditions above are true then we continue with whatever color the previous bar was.
What is repainting?
Repainting is "script behavior causing historical vs realtime calculations or plots to behave differently." That definition comes directly from Tradingview. If you want to read the full explanation you can visit it here www.tradingview.com . The price-action candles use swing highs and swing lows which need bars to the left (past) and bars to the right ("future") in order to confirm the swing level. Because of the need to wait for confirmation to for swing levels the plot style can be repainting. With the price-action candles indicator the only repainting part of the indicator is the labels. The price-action candles themselves WILL NOT REPAINT. The labels however can be set to repaint or not depending on the user preference. If the user opts to use repainting then the label location is shifted back by the length of the price-action. So if the "Price-Action Length" input is set to 10, and the user wants repainting, the swing high/low label will be shifted back 10 bars. If the user opts for no repainting, the label will not be shifted and instead show on the exact bar the swing level was confirmed.
Examples Below.
Repaint
Here the labels are shifted back the price-action length.
Non-Repaint
Here the labels are not shifted back because the input setting is set to not repaint.
Multi-timeframe Analysis
The users can view the trend from multiple different timeframes at once with a table displayed at the bottom of their charts. The timeframe can be lower or higher than the chart timeframe.
More examples
Be on the lookout for the Price Action Candles (Lower) indicator where you can view the multi-timeframe labels on a lower price grid in order to see the history over time!

LTF Candle Insights (Zeiierman)█ Overview
The LTF Candle Insights indicator allows traders to explore the finer details of the market by integrating lower time frame (LTF) data into their current chart, offering a more detailed and nuanced view of price movements. This comprehensive visual tool is crucial for traders who want to investigate complex market trends without the constant need to switch between different chart timeframes.
In essence, this indicator overlays the smaller details into the broader frame, enabling traders to grasp the fine points while examining the larger market picture.
█ How It Works
The LTF Candle Insights indicator easily puts LTF candles onto the current chart, allowing traders to see both the current timeframe and the chosen lower timeframe candles at the same time. This dual view helps traders see the main market trends and important price levels, helping them get a better understanding of the little details and complexities of the market.
█ How to Use
Trend Analysis
Traders can use this indicator to look closely at smaller market trends by comparing LTF candles with the candles of the current timeframe. Knowing the trends in LTF helps traders make trades that go along with the small market movements.
Support and Resistance Identification
By looking at the high, low, and middle levels of LTF candles, traders can find possible support and resistance areas. This detailed look helps traders pick the best times to enter or exit trades, set up stop-losses effectively, and manage risk carefully.
█ Settings
Lower Timeframe and Candle Amount
Users can determine the lower timeframe and the number of LTF candles they wish to observe on their current chart.
Range Lines
The high/low range of the illustrated candles and the optional mid-range line can be displayed, granting insights into significant price levels and ranges.
Table Display
A summary table can be displayed, outlining details of the current chart's timeframe and the chosen LTF, providing a succinct overview for traders.
-----------------
Disclaimer
The information contained in my Scripts/Indicators/Ideas/Algos/Systems does not constitute financial advice or a solicitation to buy or sell any securities of any type. I will not accept liability for any loss or damage, including without limitation any loss of profit, which may arise directly or indirectly from the use of or reliance on such information.
All investments involve risk, and the past performance of a security, industry, sector, market, financial product, trading strategy, backtest, or individual's trading does not guarantee future results or returns. Investors are fully responsible for any investment decisions they make. Such decisions should be based solely on an evaluation of their financial circumstances, investment objectives, risk tolerance, and liquidity needs.
My Scripts/Indicators/Ideas/Algos/Systems are only for educational purposes!

All Candlestick Patterns Screener [By MUQWISHI]▋ INTRODUCTION :
The Candlestick Patterns Screener has been designed to offer an advanced monitoring solution for up to 40 symbols. Utilizing a log screener style, it efficiently gathers information on confirmed candlestick pattern occurrences and presents it in an organized table. This table includes essential details such as the symbol name, signal price, and the corresponding candlestick pattern name.
_______________________
▋ OVERVIEW:
_______________________
▋ CREDIT:
Credit to public technical “*All Candlestick Patterns*” indicator.
_______________________
▋ USAGE:
_______________________
▋ Final Comments:
For best performance, add the Candlestick Patterns Screener on active symbol chart like QQQ, SPY, AAPL, BTCUSDT, ES, EURUSD or …etc.
Candlestick patterns are not a major concept to build a trading decision.
Personally, I see candlestick patterns as a means to comprehend the psychology of the market, and help to follow the price action.
Please let me know if you have any questions.
Thank you.

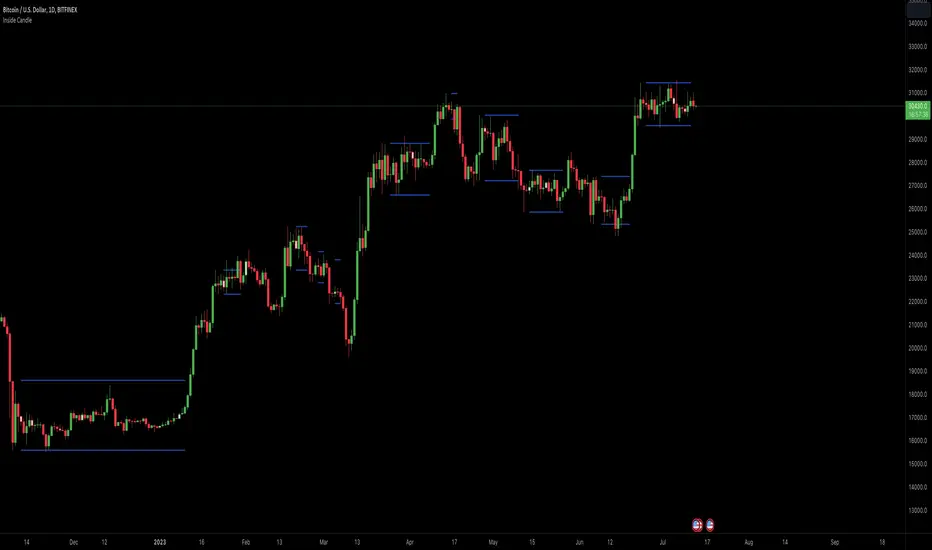
Inside Candle ViewerInside Candle Viewer
What it’s meant for:
- This indicator is used to identify inside candles that might generate an upcoming trading range
- Works best on large timeframe (Suggested from 2 days up to 1 week) and crypto asset (Index don't show much because of daily gaps)
How it works:
- It check for daily close (or the chosen timeframe), highlight inside candles and also plot trading range limits generated by inside pattern
- Trading range limits extend until candle closes are within those limits
- Usually the longer the trading range last, the stronger the following trend is when it break in any direction
Settings:
- Change color of inside bars and enable/disable from chart
- Change color of trading range and enable/disable from chart
Alerts:
- No alerts are defined at the moment
Ravi teja sreevatsav's consecutive candle
When two consecutive same-color candles form, the indicator generates a signal at the bottom of the second green candle and the top of the second red candle.

Volume Candlestick Heatmap Colors [vnhilton]This indicator colours candles based on their volume for a set period of time. The highest volume & lowest volume in this period are set by 2 colours, & any candle with volume inside the range will have a colour based on the gradient created by the 2 colours. Ability to hide the candle body, wick, border if preferred (Hide candlestick body, wick, border, through the settings if applicable). Features 20 pre-set themes + ability to set your own custom theme.
Anamnisar; Aubergine; Between The Clouds; Bichrome
Bora Bora; Candy; Cherryblossoms; Dracula
Dance To Forget; Fresh Turboscent; Friday; Frozen
Miaka; Minnesota Vikings; Misty Meadow; Monochrome
Neon Life; Purple Bliss; Purple Paradise; Sea Blizz
Shore; Sky; Starfall; Superman
Talking To Mice Elf; The Strain; Winter; Vasily
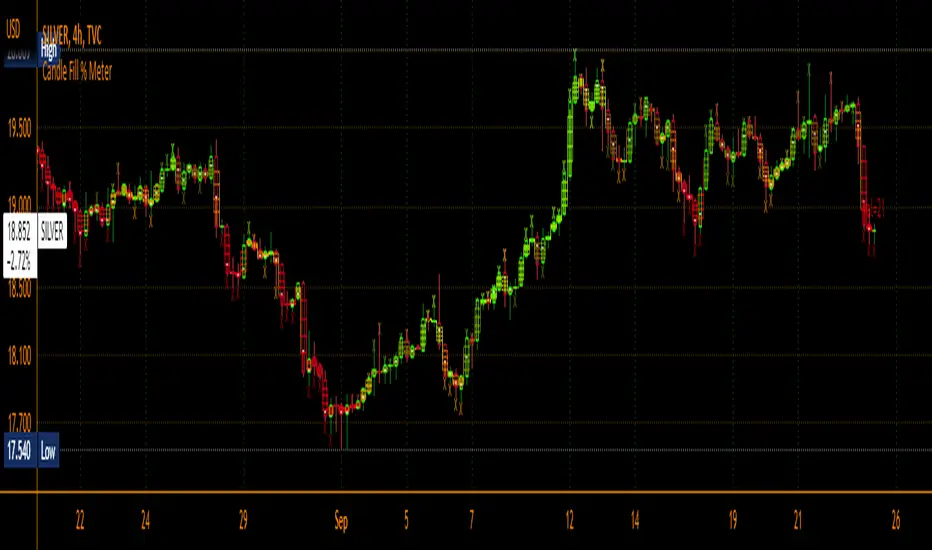
Candle Fill % MeterFor use with Hollow Candles
Fills Candles based on either the value of the RSI or coppock scaled to fit properly between the open and close. Makes for a compact visual with lot's of information given. Toggle bells and whistles in settings such as arrows to indicate the direction of the value being measured, dividing levels, fill from candle open all the time instead of the bottom up and more.
Equivolume - volume as candle widthDo price action and volume really need to be on separate graphs? Why not display them both on a single graph and reduce the clutter? Presenting Equivolume candles here on TradingView - inspired by the NinjaTrader implementation
This indicator allows you to view traditional OHLC candles but with the additional ability to see relative volume through variations of width and/or transparency
Explanation
- Wide and/or full colour candles have the highest volume
- Thin and/or highly transparent candles have the lowest volume
- The following diagram shows the Equivolume indicator as well as a traditional volume graph along the bottom. You can see that when the volume is highest, the candle is widest and also the most intense color.
- The `Lookback candle count` user parameter specifies the number of candles to use in order to locate the highest volume within that range. All other candle widths in the range will be adjusted relative to this highest volume
Tips
- Toggle off the visibility of the original graph for the instrument to get the best view of the candles when using variable transparency
Gotchas
- Due to a Pine Script limitation a maximum of 500 variable width candles can be drawn on the chart
- If `Lookback candle count` is higher than the total number of available candles for the instrument, then the indicator will fail and not display anything. I’m still investigating how to handle this case better
- Be aware if you are using the `High` setting for the `Transparency range` parameter, candles with the lowest volume will be virtually invisible

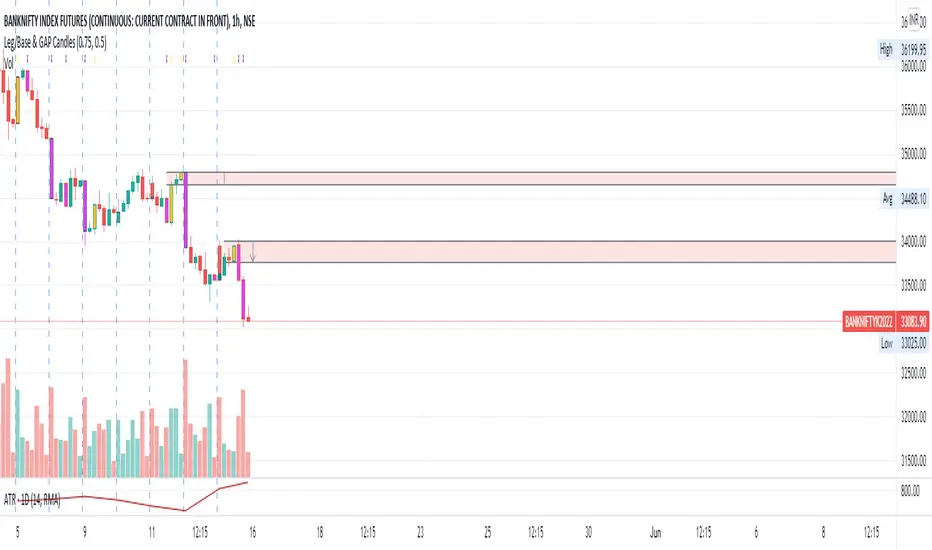
Leg/Base & GAP CandlesThis script, redraws the Minute, Hourly, Daily, Weekly, Monthly candles for gap up and gap down situation. Also this candle marks the LEG candles and BASE Candles with different colors to mark the supply and demand zone.
This script is only for Indian NSE markets (09:15 to 15:30) for GAP up/GAP down redraw.
This script is most beneficial for TradeLegend students.
This script is originally made by me, and no code has been modified or copied from anywhere else except Pinescript documentation.
Dynamic Volume CandlesThese candlesticks fill with opacity based on the significance of the volume compared to the volume's EMA.

Candlestick Patterns by Dipak V2I am really excited to publish my work, I know its at the beginning but there is a lot to come in the future. I am writing a script to identify the candlestick patterns. In this version, I have added Hammer and Hanging Man Pattern in the first version, I know its less but its a beginning, I will keep adding the new information in my script in upcoming versions.
This script is for only learning purpose and not for treading realtime. In this script, it only identifies the pattern and does not check for its confirmation or does not provide any stop-loss, Also it does not check the prior trend before the pattern. These things really matter in the live trade. But in future, I am planning to add these things.
If you like my work, please like or comment your ideas I will try to include those in upcoming versions.
Hanging Man:
Hanging man is a bearish reversal candlestick pattern that signals about the uptrend or advancing phase are over and bulls have lost their control. Color of the candle is not important.
Identity:
1) Comes after a significant up rally or uptrend or advancing phase.
2) Small real body at the top.
3) Long lower shadow at least twice the real body.
4) Very small or no upper shadow.
Confirmation:
Immediate next candle’s close should be below the hanging man’s real body.
StopLoss:
There is a potential resistance level above the top of the hanging man. Stoploss should be above the resistance area or at the high of the hanging man.
Hammer:
Hammer is a bullish reversal candlestick pattern that signals about the downtrend or declining phase are over and bears have lost their control. Color of the candle is not important.
Identity:
1) Comes after significant down rally or downtrend or declining phase.
2) Small real body at the top.
3) Long lower shadow at least twice the real body.
4) Very small or no upper shadow.
Confirmation:
Immediate next candle’s close should be above the hammer’s low.
StopLoss:
There is a potential support level below the low of the hammer. Stoploss should be below the support area or at the low of the hammer.
Note: The candle is the same for Hanging Man and Hammer , Difference is where they appear in the uptrend or in the downtrend that makes the real difference.

counting candles v2This script shows via the oscillator window, how much red and green candles where shown - looking back a given number of candles.
The number of candles to look back is 10 by default, but can be changed in the indicator settings.
The red line indicates the number of red candles, while the green line shows the number of green candles.

Candlestick Trend Indicator v0.5 by JustUncleLRequested Update to this Indicator alert project. In this update I have added the option to be able select which Price Action candles you want included in the display and the generated alarm Alert. Other changes also included in this update:
Also added a Price Action candle for "Last Fractal S/R Break", this also a good continuation indication.
Added option to select a different moving average types for directional MA line.
Modified some default settings, using HullMA instead of Zero Lag EMA and standard MACD settings(12,26,9).
Description:
This is a trend following indicator and alert for Binary Options based on Candlestick patterns and trend line -
NOTE: original system was a forex trading system.
This code combines a number of indicators to create an overall trading strategy.
The indicator recognises and displays some useful candle named defined patterns that are used to support trend continuation:
Bearish + Bullish PinBars
Dark Cloud Cover
Piecing Line
Bullish + Bearish Harami
Bullish + Bearish Engulfing Candle
Bullish + Bearish Last Fractal S/R break
Also recognises main Price Action candles from ChrisMoody (CM), the four(4) price action patterns are colored coded bars:
Yellow = Inside Bar - breakout/continuance
Orange = Outside Bar - breakout/continuance
Aqua/Fuschia = Up/Down Shaved Bars - Buying/Selling pressure
Red/Green = Possible reversal PinBars - Reverse Down / reverse Up
The highlighted candles (maroon and darker green) represent the defined PA patterns that have been confirmed following the current trend direction that is indicated by the Hull MA(20) line (can select a different type of MA, or even disable) and confirmed by MACD direction (can be disabled). The confirmed Alerts are indication by green (buy) and red (sell) dots at the bottom of the chart. An alert is generated from this selection for the alert condition of the alarming system.
The fractal upper/lower break lines are also draw, if the (optional) last fractal break line is broken by a highlighted bar then this indicates a stronger trend conformation.
The MACD indicator MACD DEUTER 2 colour(12,26,9) you can visually see the MACD histogram colours with MACD direction - needs "MACD DEUTER 2 colour" indicator.
This multi-indicator set up is suitable for 1hr, 4hr and daily charts with 1-4 candle expiry.
References and Inspiration from:
Fractal Levels by RicardoSantos
Almost Zero Lag EMA
Candlestick Patterns With EMA by rmwaddelljr
CM_Price-Action-Bars by ChrisMoody
www.forexstrategiesresources.com
"Scalp Jockey - MTF MA Cross Visual Strategizer by JayRogers"

Volume Delta Divergence Candle ColorThis indicator identifies divergences between price action and volume delta, highlighting potential reversal or continuation signals by coloring candles when buyer/seller pressure conflicts with the candle's direction.
**How It Works:**
The indicator analyzes real-time up/down volume data to detect two types of divergences:
🟣 **Seller Divergence (Fuscia)** - Occurs when a candle closes bullish (green) but the volume delta is negative, indicating more selling pressure despite the upward price movement. This suggests weak buying or potential distribution.
🔵 **Buyer Divergence (Cyan)** - Occurs when a candle closes bearish (red) but the volume delta is positive, indicating more buying pressure despite the downward price movement. This suggests weak selling or potential accumulation.
**Features:**
✓ Colors only divergent candles - non-divergent candles maintain your chart's default colors
✓ Uses actual exchange volume delta data (works best with CME futures and other instruments with tick-level data)
✓ Optional triangle markers above/below divergent candles for quick visual identification
✓ Clean, minimal design that doesn't clutter your chart
**Best Used For:**
- Identifying potential reversals or continuations
- Spotting weak price movements that may not follow through
- Confirming price action with underlying volume pressure
- Works on any timeframe with available volume delta data
**Note:** This indicator requires volume data from exchanges that provide tick-level information (CME futures, cryptocurrency exchanges, etc.). Results may vary on instruments with limited volume data.

RTH vs ETH Candle StylingRTH vs ETH Candle Styling — Clean Session-Based Candle Filters
This indicator restyles the chart’s candles based on session type:
🟩 RTH (Regular Trading Hours — 09:30 to 16:00 EST)
RTH candles display normal, full-color price action, showing momentum clearly during the primary US session.
⬛ ETH (Extended Hours Trading)
All ETH candles are converted into hollow, black-outline candles, with:
Transparent bodies
Black borders
Black wicks
This creates an immediate visual separation between overnight price action (ETH) and the high-liquidity RTH session—reducing noise and helping traders focus on true market structure.
🔥 Why Use This?
Cleaner chart during overnight chop
Easy to distinguish RTH orderflow from ETH drift
Enhances gap logic, session deviations, and liquidity mapping
Makes your main RTH setups stand out instantly
⚙ Inputs
Adjustable RTH session (default: 09:30–16:00 EST)
Adjustable timezone (default: America/New_York)
GLOBAL SETTINGS TO CHANGE-Change-settings-symbol-candles-uncheck all

1h Hollow Candle on 5m - SSThis indicator displays 1-hour candles on a 5-minute chart using a clean, minimal visual style designed for intraday traders who want to track higher-timeframe structure without cluttering the chart.
The higher-timeframe (HTF) candles are drawn as hollow outlines, which makes them easy to read while keeping the underlying 5-minute price action fully visible. Each 1-hour candle includes:
Wicks (high & low)
Open/close borders
Color-coded direction (green = bullish, red = bearish)
Transparent body so they never block real candles
This is ideal for traders who want to:
Identify HTF structure during scalping
Spot key reversals inside hourly candles
Track premium/discount zones relative to each 1h candle
Improve top-down analysis without switching timeframes

Apex Edge – HTF Overlay Candles“Trade your 5m chart with the eyes of the 1H — Apex Edge brings higher-timeframe structure and liquidity sweeps directly onto your execution chart.”
Apex Edge – HTF Overlay Candles
The Apex Edge – HTF Overlay Candles indicator overlays higher-timeframe (HTF) candles directly onto your lower-timeframe chart. Instead of flipping between timeframes, you see HTF structure “breathe” live on your execution chart.
What It Does
• HTF Body Boxes → open/close zones drawn as semi-transparent rectangles.
• HTF Wick Boxes → high/low extremes projected as envelopes around each body.
• Midpoint Line → a dynamic equilibrium line that flips bias as price trades above or below.
• Sweep Arrows → one-time markers showing the first liquidity raid at HTF highs or lows.
Under the Hood
This isn’t just a visual overlay — it’s engineered for accuracy and performance in PineScript.
1. HTF Data Retrieval
• Uses request.security() to import open, high, low, close, time from any selected HTF.
• lookahead=barmerge.lookahead_off ensures OHLC values update bar by bar as the HTF
candle builds.
• When the HTF bar closes, boxes and midpoint lock to historical values — matching the
native HTF chart exactly.
2. Box Construction
• Body box: built from HTF open → close.
• Wick box: built from HTF high → low.
• Boxes extend dynamically across each HTF period, updating in real time, then freeze at
close.
3. Midpoint Logic
• (htfOpen + htfClose) / 2 calculates intrabar midpoint.
• Line drawn edge-to-edge across the active HTF body.
• Style, width, color, and opacity are user-controlled.
4. Sweep Detection
• Flags (sweepedHigh / sweepedLow) prevent clutter: only the first tap per side per HTF
candle is marked.
• Lower-timeframe price breaking the HTF high/low triggers the sweep arrow.
• Arrows are offset above/below wick envelopes for clean visuals.
5. Customisation
• Every layer (body, wick, midpoint, arrows) has independent color + opacity settings.
• Arrow size, arrow color, and transparency are adjustable.
• Default HTF = 1H (perfect for 5m/15m traders) but can be switched to 30m, 4H, Daily,
etc.
Why It’s Useful
• HTF intent + LTF execution without chart hopping.
• Liquidity mapping: see where liquidity is swept in real time.
• Bias clarity: midpoint line defines HTF equilibrium.
• Clean signals: only the first sweep prints — no spam.
What Makes It Different
Most MTF overlays just plot candles or single lines. This tool:
• Splits body vs wick zones for institutional precision.
• Updates live intrabar (no repainting).
• Highlights liquidity sweeps clearly.
• Built for readability and professional use — not another retail signal toy.
Cheat-Sheet Playbook
1️⃣ Structure Bias
• Above midpoint line = bullish intent.
• Below midpoint line = bearish intent.
• Chop around midpoint = no clear direction.
2️⃣ Liquidity Sweeps
• ▲ Green up arrow below wick box = sell-side liquidity taken → watch for longs.
• ▼ Red down arrow above wick box = buy-side liquidity taken → watch for shorts.
• First sweep is the cleanest.
3️⃣ Trade Logic
• Body box = where institutions transact.
• Wick box = liquidity traps.
• Midpoint = bias filter.
• Best setups occur when sweep + midpoint flip align.
4️⃣ Example (5m + 1H Overlay)
1. ▲ Green up arrow prints below HTF wick.
2. Price reclaims the body box.
3. Midpoint flips to support.
4. Enter long → stop below sweep → targets = midpoint first, opposite wick second.
In short:
• Boxes = structure
• Wicks = liquidity pools
• Midpoint = bias line
• Arrows = liquidity sweeps
This is your SMC edge on one chart — HTF structure and liquidity fused directly into your execution timeframe.

VWMA CandlesVWMA Candles – Smarter Candle Coloring with Volume Awareness
This indicator enhances your chart candles by showing their relationship to the Volume-Weighted Moving Average (VWMA). It visually integrates the VWMA and price action, making it easier to spot momentum shifts, value zones, and price interaction with volume-weighted levels. I saw this indicator idea from TrendSpider on threads and decided to try and make my own. This is my first publicly shared script so go easy on me!
IN ORDER FOR THE COLOR CODING TO WORK PROPERLY, YOU MUST:
GO TO -> CHART SETTINGS -> SYMBOLS AND DISABLE BODIES, BORDERS, AND WICKS.
How it works:
The VWMA is plotted on your chart with a customizable band around it.
Candles change color depending on their position relative to the VWMA and its band:
Green → Price is above the VWMA (bullish bias).
Orange → Price is near or touching the VWMA/band (potential reaction zone).
Red → Price is below the VWMA (bearish bias).
You can choose between custom candles (full plotcandle styling) or simply recolor your existing chart candles with barcolor.
Customization options:
Select how the band is calculated: by % of VWMA, ATR multiple, or Ticks/Points.
Adjust colors separately for candle body, wick, and border.
Choose to show/hide the VWMA line and the band fill.
Fine-tune transparency for a clean look on any chart background.
Why traders use it:
Quickly spot when price is stretched away from the VWMA (overextended conditions).
Identify when candles are interacting with the VWMA (potential support/resistance).
Add volume-sensitivity to your trend analysis compared to standard moving averages.
Authors Note: The default settings work well with stocks on the weekly timeframe, although this can be used on any timeframe. The settings are highly adjustable for you to tune it to your liking.

HTF Candles [theUltimator5]Overlay higher timeframe candles on any lower timeframe chart with real-time updates.
This indicator displays the full structure of each higher timeframe (HTF) candle—including open-close bodies and full wicks—directly on your current chart. Great for multi-timeframe traders who want to align short-term entries with broader market context.
🔹 Features:
View higher timeframe candles (e.g., 1H, 4H, Daily) on intraday charts
Dynamic candle bodies that update in real-time
Accurate wick representation with auto-redrawing
Customizable bullish/bearish colors and transparency
Efficient object management for minimal clutter
🛠️ How to Use:
Add this indicator to a lower timeframe chart (e.g., 1m, 5m, or 15m).
Select a higher timeframe (must be greater than your chart timeframe).
Customize your candle colors and transparency for better visibility.
Watch as each higher timeframe candle evolves live with every bar.
📌 Example: Use a 5-minute chart with a 1-hour HTF overlay to track hourly market structure without switching timeframes.

Impulsive Candle Detector TRW [3-in-1]Impulsive Candle Detector
Description: professor Michael impulsive candle but 3 -1 code by me
The Impulsive Candle Detector is a powerful tool designed to identify and highlight three different types of impulsive candles on your TradingView chart—all in a single, customizable indicator. Each impulsive candle type uses its own configurable settings, allowing traders to easily visualize various market dynamics without crowding their charts with multiple indicators.
How it works:
The indicator detects “impulsive” candles based on custom thresholds for candle range, volume, and body-to-wick ratio.
Each of the three types is independently configurable with its own parameters (length for averages, size multiplier, volume multiplier, body ratio, and color).
When an impulsive candle is detected, the corresponding bar is colored and can optionally display a label above the candle indicating its type.
Separate alerts can be set for each impulsive candle type, enabling you to react to different market conditions instantly.
Features:
Three independent impulsive candle detection types, all in one indicator
Adjustable settings for each type (range, volume, body ratio, and color)
Clean, uncluttered chart view
Custom bar coloring and optional labels for instant visual recognition
Supports individual alert notifications for each impulsive candle type
Perfect for:
Traders looking to spot strong market moves or volatility spikes
Those who want to monitor multiple impulsive candle patterns without overlapping indicators
Anyone who values clean and customizable charting solutions

Unified Sentiment Candles Overlay (SMA)Unified Sentiment Candles (SMA) Indicator
The Unified Sentiment Candles (SMA) is a custom overlay indicator designed to provide a smoothed visualization of market sentiment by plotting synthetic candles based on the Simple Moving Average (SMA) of open, high, low, and close prices. It helps traders identify trend direction and potential reversals more clearly.
How to Use:
- Observe Candle Colors: Green candles indicate bullish sentiment (close ≥ open), while red candles suggest bearish sentiment (close < open).
- Trend Identification: Consistent green candles point to an uptrend, whereas consistent red candles may signal a downtrend.
- Support & Resistance Zones: The SMA-based candles smooth out short-term volatility, assisting in spotting key support and resistance levels.
- Entry & Exit Signals: Look for color changes or candle pattern formations within the synthetic candles to time entries and exits more effectively.
Settings:
SMA Length : Adjust this parameter to control the smoothing period. A shorter length makes the indicator more responsive, while a longer length smooths out more noise.
This indicator is best used in conjunction with other technical analysis tools to confirm signals and improve trading accuracy.
This script is open-source and licensed under the Mozilla Public License 2.0. Use and modify it at your own discretion.

Engulfing Candles (ATR-Based) with Volume SpikeOverview:
This script is designed to detect high-probability bullish and bearish engulfing patterns — but with a twist: it filters them through ATR-based volatility and confirms strength with volume spikes, all while offering optional trend filtering. It's built for traders who want more than just surface-level candle patterns — it's for those who want contextual confirmation before entering a trade.
What Makes It Different:
Most engulfing candle indicators simply match two candle shapes. This script goes deeper by:
Measuring candle body size relative to recent volatility (via ATR).
Checking for volume confirmation using a dynamic spike threshold.
Filtering based on trend context using SMA-based structure detection.
This tri-layered logic aims to avoid false positives and give traders cleaner, more actionable entries that align with momentum.
Core Concepts:
1. Trend Detection (Optional)
You can choose between two structural filters:
SMA50 only: Looks for price above or below the 50-period SMA to define trend direction.
SMA50 + SMA200 alignment: A stricter rule requiring both fast and slow SMAs to confirm a trend.
Or turn off trend filtering entirely (No detection).
This helps ensure engulfing setups appear in line with the broader trend, increasing the likelihood of continuation.
2. ATR-Filtered Candle Bodies
To eliminate noise:
A candle is only considered a valid engulfing candle if it has a body larger than 1.5× ATR(14).
The previous candle must be a small-bodied candle (less than 0.5× ATR), creating a clear visual engulfing structure.
This method dynamically adjusts for market volatility, so setups are meaningful even during periods of compression or expansion.
3. Volume Spike Confirmation
Not all engulfing candles lead to follow-through. That’s why this script includes a volume confirmation filter:
A 20-period moving average of volume is calculated.
A spike is flagged if the current bar’s volume exceeds 1.5× this average (adjustable).
Patterns with this confirmation are marked with a “*” label (e.g., BU* or BE*) to distinguish volume-backed setups from weaker ones.
Visuals & Alerts:
BU = Bullish engulfing without volume spike
BU* = Bullish engulfing with volume spike
BE = Bearish engulfing without volume spike
BE* = Bearish engulfing with volume spike
A white background highlight is shown behind candles with volume-confirmed engulfing patterns.
Alerts are available for BU* and BE* so you can automate your edge.
How to Use:
Add the indicator to any chart.
Choose your trend filter from the settings panel.
Watch for BU* and BE* labels — these are your highest-conviction signals.
Optional: Combine with support/resistance, Fibonacci zones, or MTF confirmation to refine entries.
Use the included alerts to receive real-time push/email notifications when patterns emerge.
Performance Note:
I’ve found this script to be fairly good when applied to the 1-hour charts of the companies in the US100. The combination of ATR-based filtering and volume confirmation appears to provide clear, high-quality setups with good follow-through potential.
By blending candle patterns, volatility filtering, volume confirmation, and trend context, this script aims to filter out weak signals and highlight the most statistically significant engulfing opportunities.
