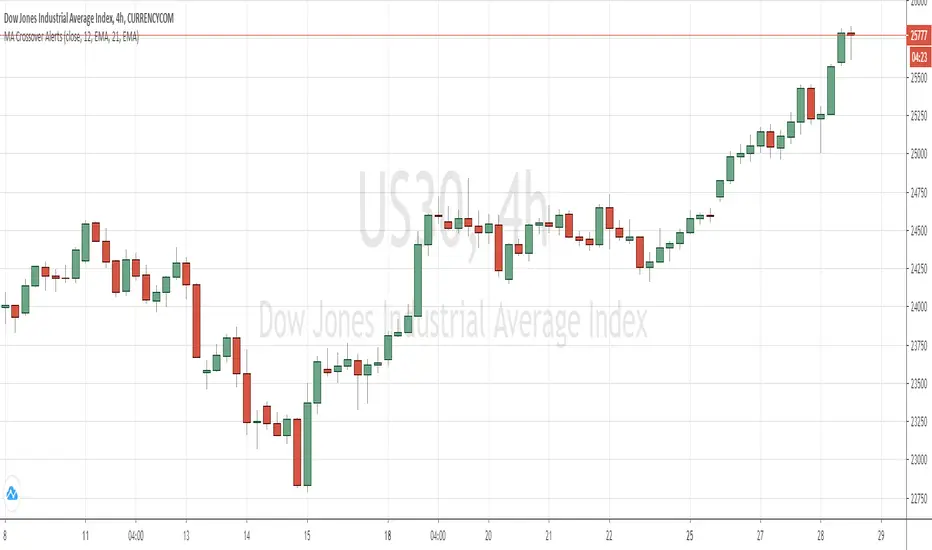
MA Crossover AlertsThis script allows you to configure Create Alert dialogue box for a MA Crossover and send a notification on mobile device.
Cerca negli script per "crossover债券是什么"

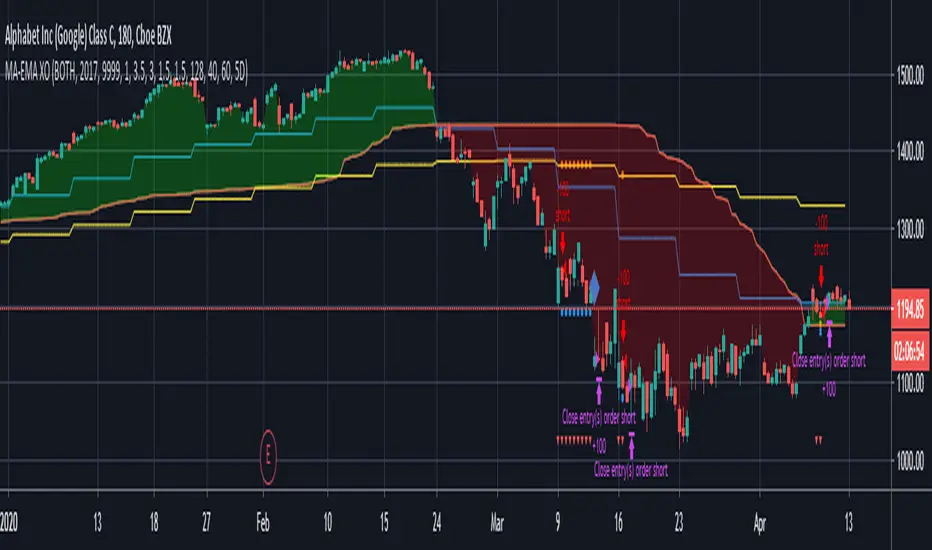
MA-EMA Crossover LTJust a simple strategy based on dynamic zones by Allenster. Still a work in progress.
Modified 3MA cross : Modified 3 moving average crossoverModified 3MA cross : Modified 3 moving average crossover

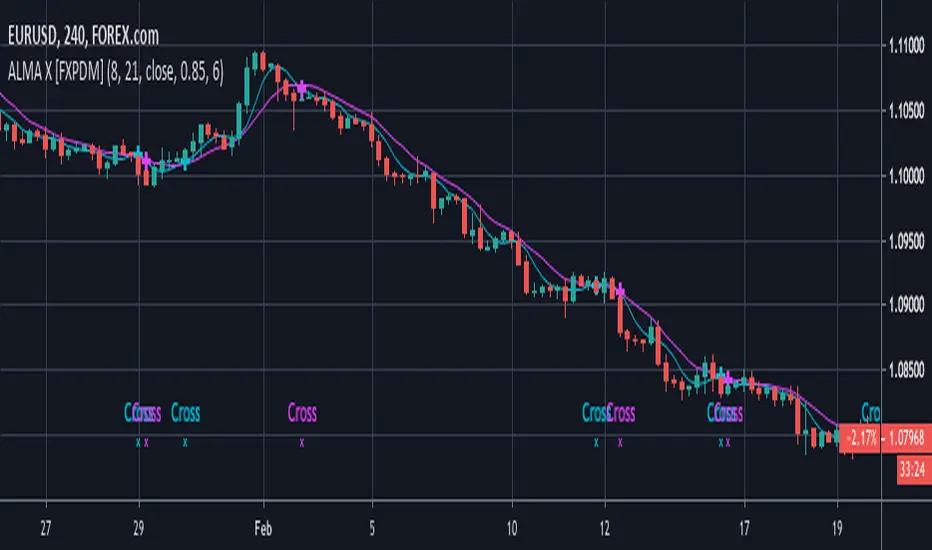
ALMA Crossover [FXPDM]
I created this new version of EMA crossing by replacing it with ALMA, Please take into consideration that the cross signal may occur during the candle. I advise waiting until the candle is close.
I used EMA crossing signals to adapt this code and turn it into an ( Arnaud Legoux Moving Average) ALMA Cross.
I expect it to bring a better signal that an EMA cross, let me know your comments and use under your own risk. this is just an experimental idea.
Long: Get into a long trade when the short moving average crosses up the long moving average.
Short: Get into a short trade when the short moving average crosses down the long moving average.
I recommend using it alongside a volume indicator to avoid sideways trends.
Exit at your own convenience or when the trend direction changes. I recommend using it in 4H and 1D charts.
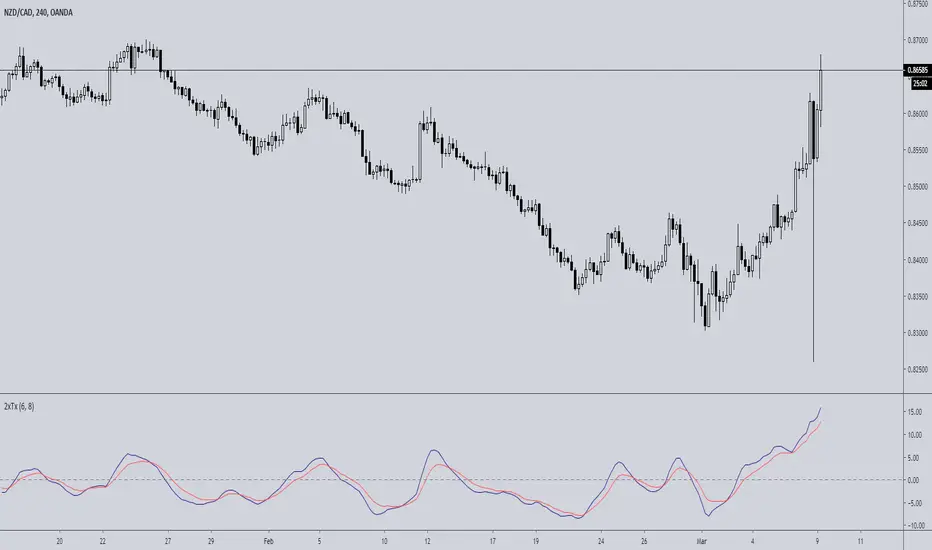
Double TRIX CrossoverTRIX is a great indicator to use on zero cross setups.... know what's even better? TRIX CROSS setups!!!
Faster in-and-out on trends, safer entry and exit signals in chop or consolidation. Base setup is 6 & 8 TRIX for longer time frames such as 4hr or 8hr; ideal or FX, Crypto, or volatile instruments. I haven't experimented with using this on lower time charts and adjusting the trix settings; if you do, drop a comment.
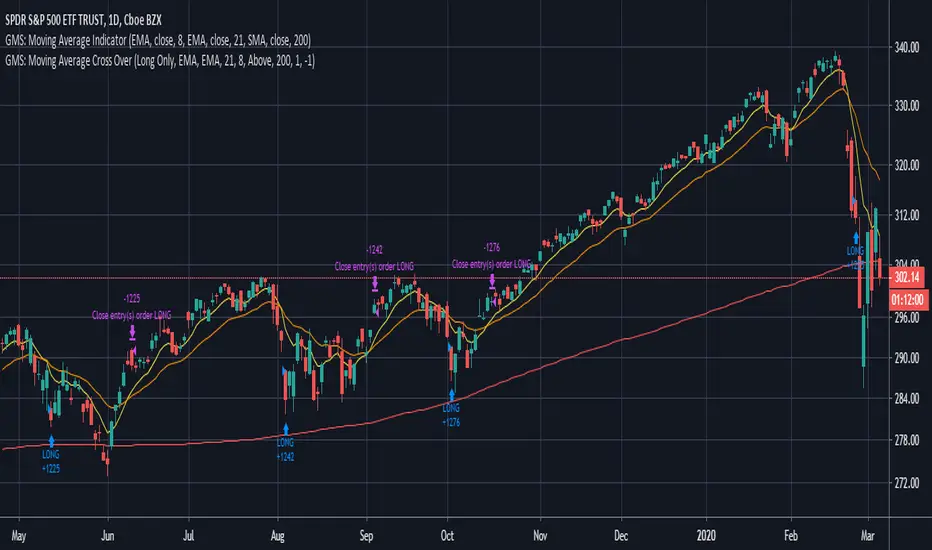
GMS: Moving Average Crossover StrategyThis is a moving average crossover system built the way I would want it to be.
- The moving averages included are SMA, EMA, WMA, VWMA.
- You can select either for the first moving average or the second moving average.
- You can also select to see the Long trades, Short trades, or both at the same time.
- There is also a simple moving average trend filter. When this is selected, it only applies to the entries of a trade and not the exit. There are situations where the entry is above the trend filter and the exit is below.
The source code should be open so feel free to adapt it, make it more efficient, or take some part for your own project!
I hope it helps,
Andre
Simple EMA CrossQuick script I put together to complete the following:
---
- Simple EMA with the option to either display both or consolidate them as one
- Single EMA will change color based on a cross of the two EMA values entered
- Programmed alerts for bullish/bearish crossover
Enjoy!
Jurik Moving Average Crossover Strategy [ChuckBanger]The classic moving average crossover strategy does not work well in markets that, instead of trending, tend to frequently reverse within a trading range. The lag between the actual time the market has reversed direction and when the moving average is signalling a trade, the trend is already over and the market is about to go against your position. In this environment, a more appropriate trading strategy is suggested here using an JMA Keltner Channel.
The idea is to create a channel based of support and resistance. When the market breaks out of the channel, and fails to maintain momentum. It is likely the price will fall back toward the center of the channel. This tendency can be exploited in the following manner.
In the chart above, The aqua and maroon (center line) and the blue lines are part of a channel. The middle line is a slow running JMA of the closing prices, with Length = 30 and phase = 0. The upper blue band is constructed by adding 1.5 times of 30-bar ATR (average true range) to the center JMA line and the lower blue band by deducting the same amount. There is a grey line running through the data- That is a fast running JMA with length = 5 and phase = 100 representing the price.
The red dots indicate that the the price is going back in the channel and the market is retracting from a failed upward breakout, and the green dots mark when price is retracting from a failed downward breakout. These are places where one might want to enter the trade. The orange dots indicate where price crosses the center line, a reasonable place to take profit from or even exit the trade.
The center line also shows the up or down movements if the setting is ticked. This feature is useful to use when exit a trade. For example, you enter a long position on a green dot signal and the color is maroon. You can wait for 3-5 candles (depending of markets). And if the color doesn’t change it can be an indication that the price is going lower. Here it is possible to switch to a short possible or the opposite apply if you enter on a red dot.
The parameter use in this study is for demonstrating purposes only. This is to show how you can use JMA. Do not trade with real money without thoroughly test the strategy. And always use stop-losses.

150MA Cross BuyAndSell Strategy [d3nv3r]This is a Buy And Sell Strategy I haven't seen anywhere so i share mine.
Used on Bitcoin - daily chart - the strategy generate sell and buy indicator on crossover and crossunder the 150 simple moving average.

EMA X BF 🚀EMA Crossover Strategy
A simple EMA cross is a useful indication of a change in direction of a trend and is a very popular tool in trading. It can also be useful to judge price action momentum or severity by looking at the angle of the 2 EMAs, or the distance between them.
There are 2 Exponential Moving Averages, one fast and one slow. When the fast EMA crosses above the slow EMA, this can be considered bullish and may signal an upside move. Conversely, a cross to the downside of the fast EMA under the slow EMA can be considered bearish.
This strategy uses the same principle but uses different sources for the 2 EMAs; instead of using close values, we use ohlc4 values for the fast EMA and hlc3 values for the slow EMA.
The idea is that a trader might enter a long position upon a cross up and reverse position and go short upon the next cross down.
We use a simple 6% stop loss for both long and short positions.
This strategy is tuned to a 6hr chart for Bitcoin USD pairs.
INSTRUCTIONS
Go Long when the background is green
Go short when the background is red
White background means sideways market: a no trade zone

VWAP/MVWAP/EMA CROSSOVEROnly difference in this one is that a EMA is used which should give quicker signals but theres a chance for more false signals as per usual use TA and other indicators to confirm positions. So far I've been liking the Vortex Indicator
When the VWAP (Thick Yellow) AND the two EMA (Orange and thin Yellow) cross above the MVWAP (Purple) then you will be in a uptrend that could possibly continue upwards. The opposite is true if you are looking a short opportunity, wait for the three other lines to cross under the MVWAP and you should be in a downtrend that could possibly continue downwards
Of course as with all indicators not every signal will be 100% accurate there is no way to predict human emotions when it comes to trading but based on the VWAP strategy used in other markets this is the closest I could get.
Note: Don't relay completely on this indicator to think for you. Use other forms of TA to confirm all positions before entering. And if the candles start trending the opposite direction after a lets say a mini pump/dump then the signal was false.
Finally this was made according to the 15 minute chart. I did not plan on remaking it for any other timeframes as I have left the code open for you to tweak and the setting are free to adjust aswell.
Q/A
Q: Does it repaint?
A: No, this is based on moving averages as far as I know they don't repaint.
Q: How did you come up with this indicator?
A: Went on youtube looking for trading strategies other and the usual EMA crosses and found a VWAP & EMA strat. I added the MVWAP and played with the numbers until I found something that I liked.
Q: How long have you been trading/learning pinescript?
A: Been trading less than a two months and pinescript about a month and a half.

VWAP/MVWAP/SMA CROSSOVERTo use this indicator is simple.
When the VWAP (Thick Yellow) AND the two SMA (Orange and thin Yellow) cross above the MVWAP (Purple) then you will be in a uptrend that could possibly continue upwards. The opposite is true if you are looking a short opportunity, wait for the three other lines to cross under the MVWAP and you should be in a downtrend that could possibly continue downwards
Of course as with all indicators not every signal will be 100% accurate there is no way to predict human emotions when it comes to trading but based on the VWAP strategy used in other markets this is the closest I could get.
Note: Don't relay completely on this indicator to think for you. Use other forms of TA to confirm all positions before entering. And if the candles start trending the opposite direction after a lets say a mini pump/dump then the signal was false.
Finally this was made according to the 15 minute chart. I did not plan on remaking it for any other timeframes as I have left the code open for you to tweak and the setting are free to adjust aswell.
Q/A
Q: Does it repaint?
A: No, this is based on moving averages as far as I know they don't repaint.
Q: How did you come up with this indicator?
A: Went on youtube looking for trading strategies other and the usual EMA crosses and found a VWAP & EMA strat. I added the MVWAP and played with the numbers until I found something that I liked.
Q: How long have you been trading/learning pinescript?
A: Been trading less than a two months and pinescript about a month and a half.


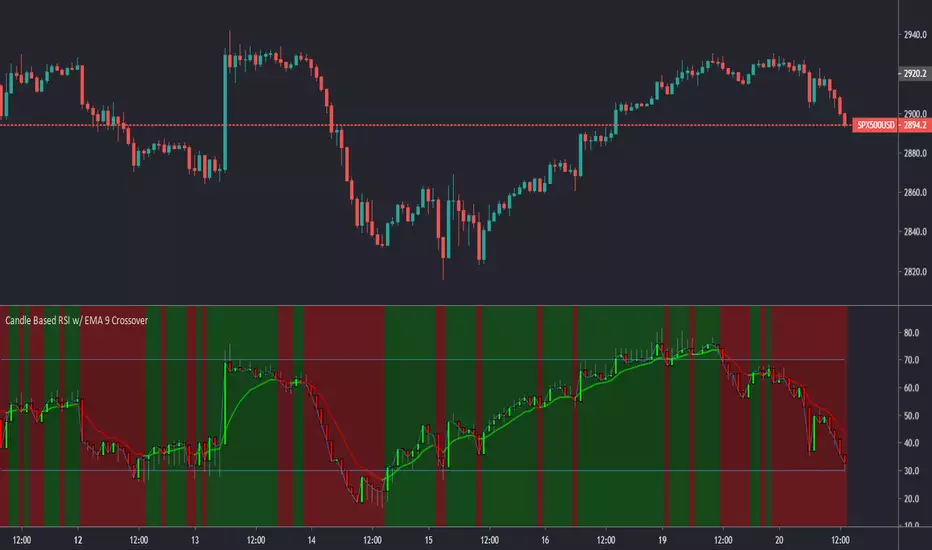
Candle Based RSI w/ EMA 9 CrossoverThis is my first published script. I hope you find it as useful as I have.
This is a modified version of olegnator's RSI script. Enjoy!
4 JMA Crossover Strategy (ps4)This is a PS4 update to my previous 4 JMA strategy that received many likes. In this and several recent strategies I use a simplified strategy setup, featuring trailing stops with very tiny increments. This is done intentionally in order to boost performance to the limit, so that to pinpoint that limit. Strategies with performance of about 90% or above are regarded as viable. Incorporating various overhead factors such as transaction costs, broker's spread, slippage, etc. at this stage creates too much 'noise' with the end result of losing the sight of the forest behind the trees.)) In practice, I disable the 'Use Strategy Setup' option and fine-tune parameters the way I want.
Tested security: EURUSD . Tested TF: 3m


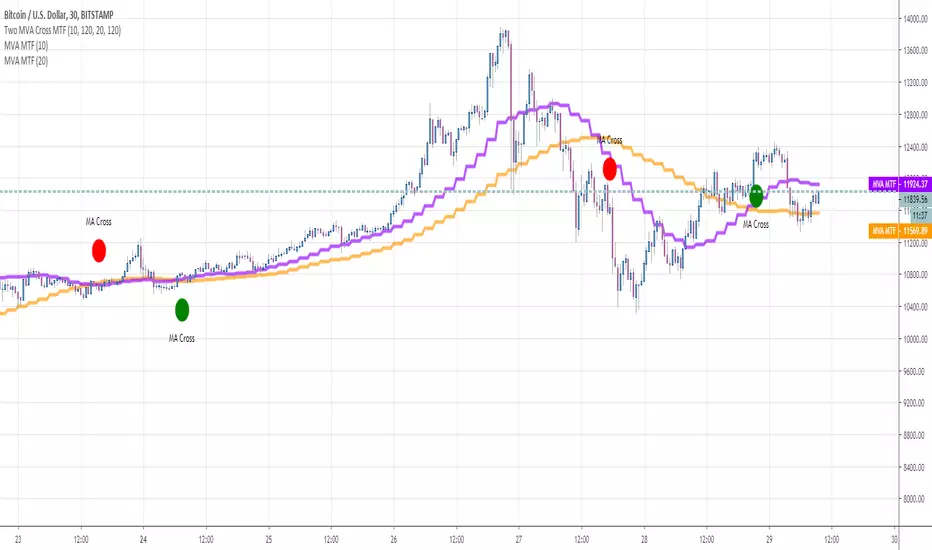
Two MVA Cross MTFHello traders
This is a script to apply the crossover/crossunder of moving average multi-timeframes on a different timeframe chart
In this example, we see two moving averages in the 2H timeframe being detected on a m30 chart
Enjoy
Dave
Two MM CrossHello Traders
This is a script to detect the crossover/crossunder of two moving averages
It's generic as all standard moving averages are accepted and can be crossed between each other
Enjoy
Dave

SMA 10/100 Crossover Strategy intended for BTCUSD on 4 hourlyA really simple trend/momentum following crossover strategy intended for higher timeframes to trade BTCUSD and other crypto pairs.

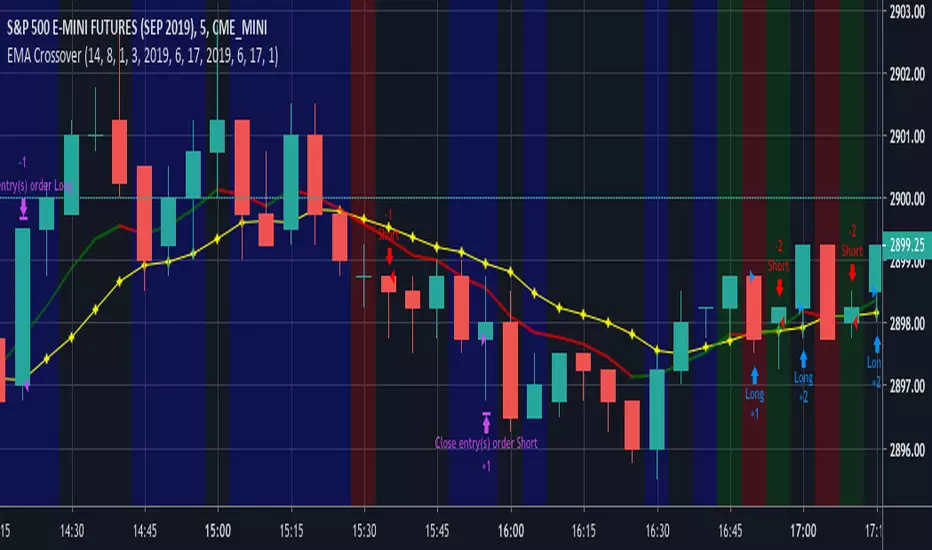
EMA CrossoverEMA Crossover
Input Parameters:
Stop loss (ticks) - define stop loss in unit of ticks (*1 tick = 12.5)
Exit signal - 1: When EMA and price crosses
2: When EMA changes direction
Start year, month, day & Stop year, month, day - define backtest period
You can set Order size, Commission in Settings, Properties tab.
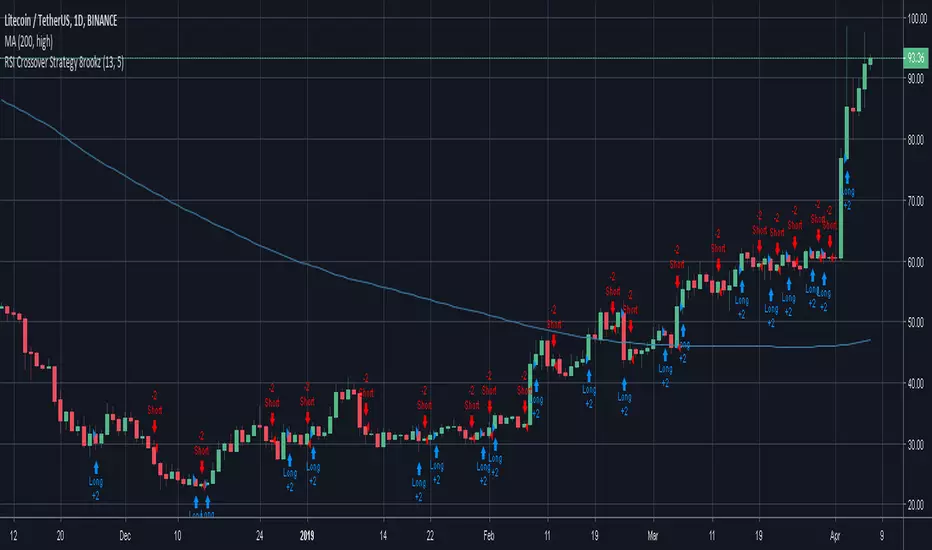
RSI Crossover Strategy 8rookzRSI Crossover Strategy
used to create entry points for increasing relative strength
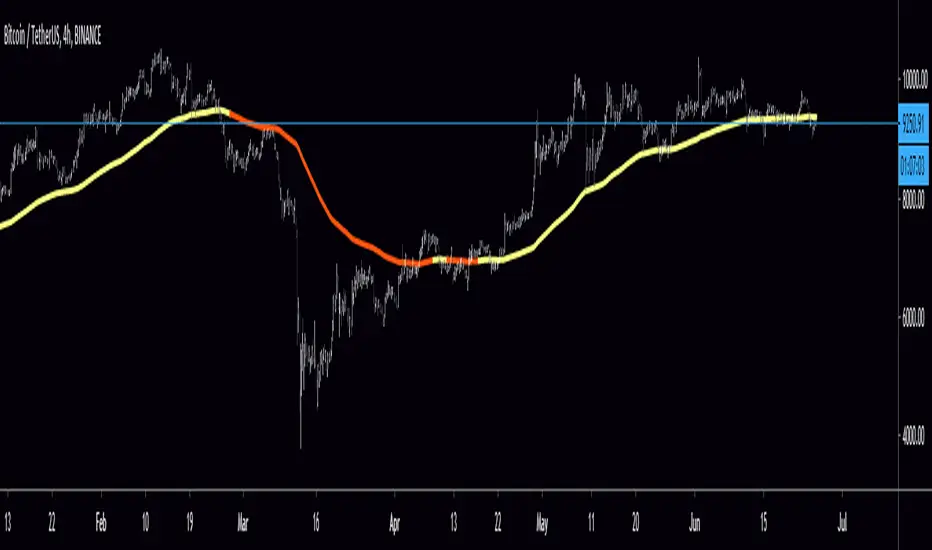
DW-3 EMA Signal LineWhen the EMA is Green the Near EMA is above the Far EMA
When the EMA is Red the EMA Far is above the EMA Near
The color changes when the EMA Near and EMA Far cross
The single line EMA is the EMA Signal line
The EMA Signal line can be set at any look back period.
Changing the EMA Signal will not change when the EMA Near and EMA Far cross, or when the color of the EMA Signal changes
Changing the Look Back Period of the EMA Signal will change how near or far it is from current price
You can change the look back period of any of the EMAs
What this does for you.....
This allows you to implement an EMA Cross while only displaying 1 EMA on the chart.
This means less clutter and allows you to adjust your "warning track" for exit rules.
In other words your EMA for your exit rule does not have to be one of the EMAs crossing.
You can tighten your exit rule EMA closer or give it more room without effecting the cross parameter.
Notice that in these images the point at which the EMA changes color (the crossover) does not change
but the proximity to current price of the EMA Signal line does.
//@version=3
study("DW-3 EMA Signal Line",overlay=true)
//SMAs
// Open Source
//======================================================
EMA_Near = input(defval=8, type=integer)
EMA_Signal = input(defval=14, type=integer)
EMA_Far = input(defval=21, type=integer)
EMAblue = sma(close,EMA_Near)
EMAred = sma(close,EMA_Far)
//color = SMAblue > SMAred ? #6DBEE5 : red
color = EMAblue > EMAred ? lime : red
plot(ema(close,EMA_Signal),color=color,linewidth=4)
