Polynomial Regression Keltner Channel [ChartPrime]Polynomial Regression Keltner Channel
⯁ OVERVIEW
The Polynomial Regression Keltner Channel [ ChartPrime ] indicator is an advanced technical analysis tool that combines polynomial regression with dynamic Keltner Channels. This indicator provides traders with a sophisticated method for trend analysis, volatility assessment, and identifying potential overbought and oversold conditions.
◆ KEY FEATURES
Polynomial Regression: Uses polynomial regression for trend analysis and channel basis calculation.
Dynamic Keltner Channels: Implements Keltner Channels with adaptive volatility-based bands.
Overbought/Oversold Detection: Provides visual cues for potential overbought and oversold market conditions.
Trend Identification: Offers clear trend direction signals and change indicators.
Multiple Band Levels: Displays four levels of upper and lower bands for detailed market structure analysis.
Customizable Visualization: Allows toggling of additional indicator lines and signals for enhanced chart analysis.
◆ FUNCTIONALITY DETAILS
⬥ Polynomial Regression Calculation:
Implements a custom polynomial regression function for trend analysis.
Serves as the basis for the Keltner Channel, providing a smoothed centerline.
//@function Calculates polynomial regression
//@param src (series float) Source price series
//@param length (int) Lookback period
//@returns (float) Polynomial regression value for the current bar
polynomial_regression(src, length) =>
sumX = 0.0
sumY = 0.0
sumXY = 0.0
sumX2 = 0.0
sumX3 = 0.0
sumX4 = 0.0
sumX2Y = 0.0
n = float(length)
for i = 0 to n - 1
x = float(i)
y = src
sumX += x
sumY += y
sumXY += x * y
sumX2 += x * x
sumX3 += x * x * x
sumX4 += x * x * x * x
sumX2Y += x * x * y
slope = (n * sumXY - sumX * sumY) / (n * sumX2 - sumX * sumX)
intercept = (sumY - slope * sumX) / n
n - 1 * slope + intercept
⬥ Dynamic Keltner Channel Bands:
Calculates ATR-based volatility for dynamic band width adjustment.
Uses a base multiplier and adaptive volatility factor for flexible band calculation.
Generates four levels of upper and lower bands for detailed market structure analysis.
atr = ta.atr(length)
atr_sma = ta.sma(atr, 10)
// Calculate Keltner Channel Bands
dynamicMultiplier = (1 + (atr / atr_sma)) * baseATRMultiplier
volatility_basis = (1 + (atr / atr_sma)) * dynamicMultiplier * atr
⬥ Overbought/Oversold Indicator line and Trend Line:
Calculates an OB/OS value based on the price position relative to the innermost bands.
Provides visual representation through color gradients and optional signal markers.
Determines trend direction based on the polynomial regression line movement.
Generates signals for trend changes, overbought/oversold conditions, and band crossovers.
◆ USAGE
Trend Analysis: Use the color and direction of the basis line to identify overall trend direction.
Volatility Assessment: The width and expansion/contraction of the bands indicate market volatility.
Support/Resistance Levels: Multiple band levels can serve as potential support and resistance areas.
Overbought/Oversold Trading: Utilize OB/OS signals for potential reversal or pullback trades.
Breakout Detection: Monitor price crossovers of the outermost bands for potential breakout trades.
⯁ USER INPUTS
Length: Sets the lookback period for calculations (default: 100).
Source: Defines the price data used for calculations (default: HLC3).
Base ATR Multiplier: Adjusts the base width of the Keltner Channels (default: 0.1).
Indicator Lines: Toggle to show additional indicator lines and signals (default: false).
⯁ TECHNICAL NOTES
Implements a custom polynomial regression function for efficient trend calculation.
Uses dynamic ATR-based volatility adjustment for adaptive channel width.
Employs color gradients and opacity levels for intuitive visual representation of market conditions.
Utilizes Pine Script's plotchar function for efficient rendering of signals and heatmaps.
The Polynomial Regression Keltner Channel indicator offers traders a sophisticated tool for trend analysis, volatility assessment, and trade signal generation. By combining polynomial regression with dynamic Keltner Channels, it provides a comprehensive view of market structure and potential trading opportunities. The indicator's adaptability to different market conditions and its customizable nature make it suitable for various trading styles and timeframes.
Cerca negli script per "crossover债券是什么"

MA Optimizer Simplified [CHE]Introduction:
The MA Optimizer Simplified is a powerful tool for traders and analysts who want to compare and optimize various moving averages (MA). This tool is specifically designed to identify the best or worst performers among a variety of moving averages based on their cumulative performance.
Features and Benefits:
1. Versatility:
- Supports multiple types of moving averages, including:
- Simple Moving Average (SMA): A basic MA calculated by averaging the closing prices over a specified period.
- Exponential Moving Average (EMA): Gives more weight to recent prices, making it more responsive to new information.
- Weighted Moving Average (WMA): Assigns more weight to recent data, but in a linear fashion.
- Volume-Weighted Moving Average (VWMA): Averages prices based on volume, giving more importance to periods with higher trading volume.
- Hull Moving Average (HMA): Designed to reduce lag while improving smoothness.
- Smoothed Moving Average (SMMA or RMA): Averages prices over a longer period, providing a smoother line.
- Bollinger Bands: Uses SMA as a basis and adds upper and lower bands based on standard deviations.
- T3: A smoother and less lagging MA that reduces market noise.
- Allows users to easily switch between MA types and test different periods.
2. Performance Evaluation:
- Calculates the cumulative performance of up to ten different MAs.
- Automatically identifies the best or worst performer based on user selection (Best or Worst).
3. Crossover Detection:
- Detects crossovers of prices and MAs to measure performance.
- Provides clear visual signals when the price crosses a moving average.
4. Visual Representation:
- Plots the best MA indicator on the chart, dynamically changing its color based on price movement relative to the MA.
- Table functionality to display the performance of each MA, including the length and achieved performance in percentage.
5. Customizable Settings:
- Customizable settings for table size and position as well as colors for better visualization and user-friendliness.
- Flexibility in selecting the number of candles that must be above or below the MA before a signal is triggered.
Special Features:
1. T3 Indicator:
- The T3 indicator provides a smoother representation and reduces market noise, leading to more precise signals.
2. Crossover and Crossunder Logic:
- The script includes advanced logic for detecting crossover and crossunder events to identify accurate entry points.
3. Dynamic Color Change:
- The best MA indicator changes color based on the number of candles above or below the MA, helping to quickly recognize market sentiment.
4. Comprehensive Performance Analysis:
- The calculation of cumulative performance for each MA allows for detailed analysis and helps identify the most effective trading strategies.
Conclusion:
The MA Optimizer Simplified is an essential tool for any trader looking to analyze and optimize the performance of various moving averages. With its versatile features and user-friendly settings, it offers a comprehensive and efficient solution for technical analysis.
Best regards, Chervolino

Micho 150 SMA indicatorAMEX:SPY NASDAQ:MSFT This Pine Script indicator is designed to assist traders by displaying a 150-day Simple Moving Average (SMA) and a stop loss level based on a user-defined percentage below the 150-day SMA. It also marks significant crossover events with labels and highlights potential trend changes using Golden Cross and Death Cross indicators.
Features:
150-Day Simple Moving Average (SMA):
The script calculates and plots the 150-day SMA of the closing prices. This is a common technical indicator used to determine the overall trend of a security. The 150-day SMA is plotted in gray on the chart.
Stop Loss Price:
Users can define a stop loss percentage through an input field. This percentage is used to calculate a stop loss price that is plotted 1% (or user-defined percentage) below the 150-day SMA. The stop loss line is plotted in red on the chart. This helps traders manage risk by indicating a price level where they might consider exiting a trade to prevent further losses.
Buy and Sell Signals:
The script identifies potential buy and sell signals based on crossovers of the closing price with the 150-day SMA:
Buy Signal: When the closing price crosses above the 150-day SMA.
Sell Signal: When the closing price crosses below the 150-day SMA.
Labels are plotted at the crossover points to indicate "start follow" for buy signals (in green) and "check stoploss" for sell signals (in red).
Golden Cross and Death Cross:
The script also identifies Golden Cross and Death Cross events:
Golden Cross: Occurs when the 50-day SMA crosses above the 200-day SMA. This is generally considered a bullish signal indicating a potential upward trend.
Death Cross: Occurs when the 50-day SMA crosses below the 200-day SMA. This is generally considered a bearish signal indicating a potential downward trend.
These crossover events are marked with labels on the chart: "Golden Cross" (in yellow) and "Death Cross" (in yellow)

Volume Delta [hapharmonic]Volume Delta: Volume Delta is an indicator that simplifies how you analyze trading volumes and the percentage of buy-sell activities effortlessly.
As a trader or market analyst, understanding underlying volume and trade flows is critical. The Volume Delta indicator provides thorough insight into both the total volume and the percentage of buying versus selling within the current candlestick. This information is pivotal for those looking to gauge market momentum and sentiment more effectively.
Additionally, the Volume Delta indicator can plot the candlestick colors based on the percentage of the dominant buying or selling volume. The area between the open and close prices of the candlestick is considered 100% and fills with colors corresponding to the predominant volume at that percentage.
Volume Delta also integrates the concept of Net volume. This component is crucial as it reveals the real market sentiment by calculating the difference between the volume of trades executed at an uptick and those at a downtick.
🟠 Overview
This indicator now displays in two layouts. Recently, Tradingview introduced the "force_overlay=true" function in Pine Script , allowing plots to be moved to the main chart. Thus, all displays are from the same indicator.
🟠 USAGE
From the data displayed in 'plot.style_columns' , the peak area represents the entire volume, accounting for 100%. Within this area, there are two color levels indicating volume. If one type of volume, whether buying or selling, exceeds the other, the larger volume will be positioned behind and the smaller in front. This arrangement prevents the scenario where a higher buying volume obscures the smaller selling volume. Therefore, the two colors can be switched between the front and the back as needed.
As you can see, the 12 and 26-day Exponential Moving Averages (EMAs) are used, with the Volume Confirmation Length set at 6. Therefore, the crossing of the EMAs proceeds normally, but it is highlighted with three triangular arrows to indicate a high likelihood of a valid crossover. However, if the volume is insufficient, these markers won't be displayed, although the EMA crossover will still occur as usual. This can be useful for using volume to verify the significance of the EMA crossover.
🟠 Setting
If you enable the label, please be aware that the chart size will shrink, causing the candlestick display to become unclear. Therefore, you might need to select "Logarithmic" at the bottom right of your screen, or for mobile applications, press and hold on the price scale and choose "Logarithmic" to adjust the scale appropriately.
Enjoy!

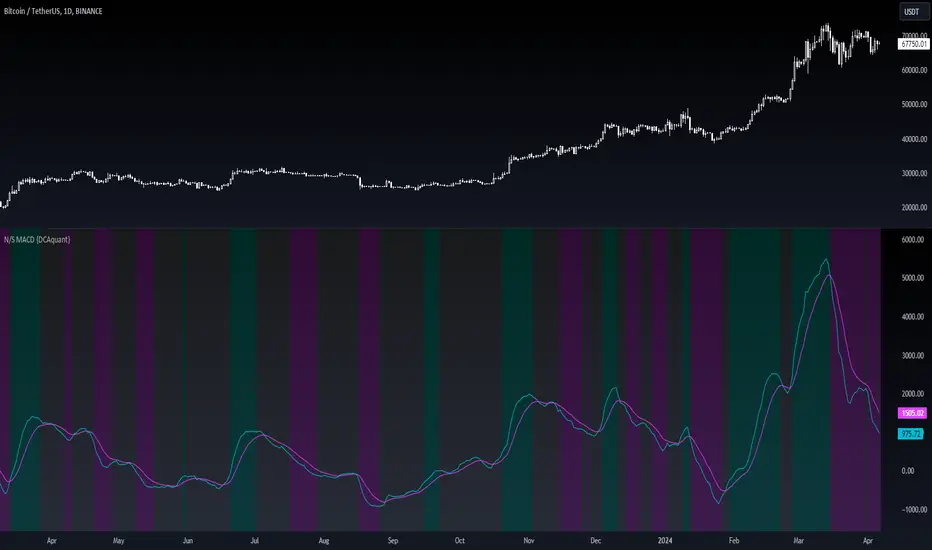
Neutral State MACD {DCAquant}The Neutral State MACD {DCAquant}
The Neutral State MACD {DCAquant} offers a nuanced interpretation of the classic MACD (Moving Average Convergence Divergence) indicator. By focusing on the neutrality of price movements, it serves to identify periods where the market lacks a defined directional bias, often seen as potential phases of accumulation or distribution before a new trend emerges.
Characteristics of the Neutral State MACD {DCAquant}:
Enhanced MACD Formula: Incorporates a neutral zone detection system into the traditional MACD framework to spotlight periods of market equilibrium.
Neutral Zone Threshold: A user-defined parameter that establishes a range within which the MACD and the signal line convergence is considered indicative of a neutral state.
Color-Coded Visualization: Utilizes color variations to illustrate the relationship between the MACD line and the signal line, accentuating the detection of neutral states, bullish crossovers, and bearish crossovers.
Functionality:
MACD and Signal Line Calculation: Employs fast and slow EMA inputs to generate the MACD line, contrasted against a signal line to capture momentum shifts.
Neutral State Detection: Assesses the proximity between the MACD and signal lines relative to the neutral zone threshold, identifying periods where neither bullish nor bearish momentum is dominant.
Background Highlighting: Modifies the chart's background color to reflect the current state of the market—neutral (gray), bullish divergence (teal), or bearish divergence (purple).
Interpretation and Trading Strategy:
Market Phases Identification: Traders can spot periods of equilibrium that may precede significant market moves, aiding in the timing of entry and exit points.
Momentum Analysis: The MACD line's cross above the signal line suggests increasing bullish momentum, whereas a cross below may signal growing bearish momentum.
Trend Confirmation: Acts as a confirmation tool when aligned with trend-following strategies, providing additional validation for trade setups.
Customization and User Guidance:
Adjustable Parameters: Allows for fine-tuning of length settings and the neutral zone threshold to match different trading styles and market conditions.
Complementary Indicator: Can be paired with volume indicators, price action patterns, or other oscillators to form a comprehensive trading system.
Disclaimer:
The Neutral State MACD {DCAquant} is a sophisticated tool meant for educational and strategic development. Traders should integrate it within a broader analytical framework and consider additional market factors. It is not a standalone signal for trades and should be used with caution and proper risk management. Trading decisions should always be made in the context of well-researched strategies and responsible investment practices.
Kzx | RSI + Div + MACDComponents Description:
Relative Strength Index (RSI):
Purpose: Measures the magnitude of recent price changes to evaluate overbought or oversold conditions in the price of a stock or other asset.
Implementation: The script allows users to set the length of the RSI calculation and defines overbought and oversold levels, which can be visually represented on the chart. Additional features include options to fill and/or color the background of the chart when overbought or oversold levels are reached.
Divergence (Div):
Purpose: Identifies instances where the price of an asset is moving in the opposite direction of a momentum indicator, such as the RSI in this script. Divergences can signal potential trend reversals.
Implementation: The script provides options for users to define the conditions under which divergences are identified, including the source of price tops/bottoms, detection limits, and the maximum lookback period for divergence analysis. It visually highlights these divergences on the chart.
Moving Average Convergence Divergence (MACD):
Purpose: Tracks the relationship between two moving averages of a security's price. The MACD is used to identify trend direction, momentum, and potential reversal points through crossovers.
Implementation: The script calculates the MACD line and its signal line. It plots buy or sell markers based on crossovers between these two lines, indicating potential entry or exit points.
Script Category:
Category: Technical Analysis / Indicators and Strategies
Subcategory: Oscillators (for RSI and MACD) and Trend Analysis (for Divergence)
Usage:
The script is designed for traders and analysts who rely on technical analysis to make informed decisions in the financial markets. By integrating RSI, divergence detection, and MACD analysis into a single script, users can gain a more nuanced understanding of market conditions, potentially improving their trading strategies.
Customization and Visualization:
Users can customize various parameters, including lengths for RSI and MACD, overbought/oversold levels, divergence detection criteria, and visual aspects like colors and marker sizes.
The script provides visual cues directly on the price chart, making it easy to spot potential buy/sell signals, overbought/oversold conditions, and divergences without the need to switch between different indicators.

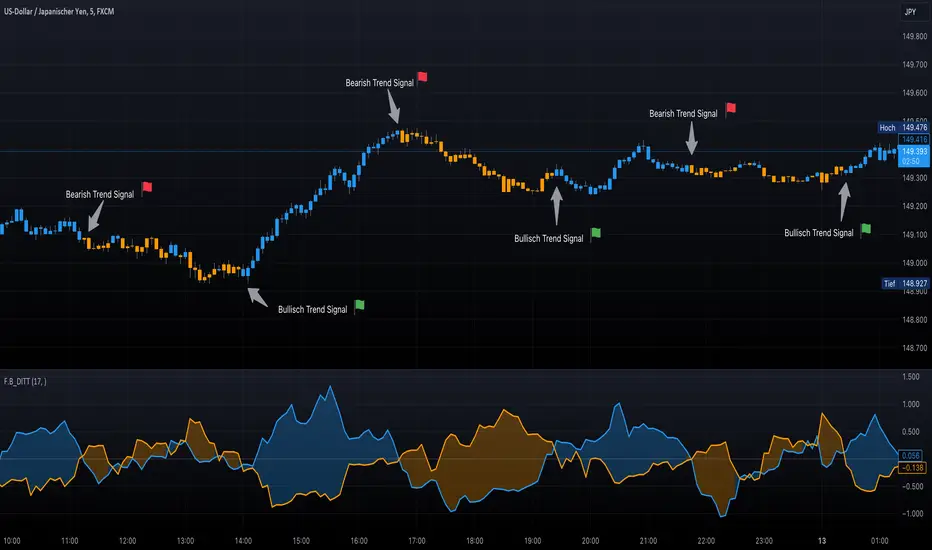
F.B_DI+ DI- Trend TrackerThe F.B_DI+ DI- Trend Tracker is an indicator developed based on Directional Movement and True Range to identify trends in the market and assess their strength. Here is the logic behind the indicator and how to use it for trading:
Direction Determination
Unlike traditional DI+ and DI- based on simple calculations, this indicator utilizes derived versions of these directional indicators. These derived versions offer a more precise measurement of price directional movements by specifically tailoring to market conditions and the chosen time frame.
Trend Strength
The derived directional indicators are generated by dividing smoothed Directional Movements by smoothed True Range and converting them into percentages. These values provide insights into the strength of the trend by considering directional movements relative to market volatility.
Identifying Trend Reversals
To capture changes in trend strength more accurately, the first derivative of DI+ and DI- is computed. A crossover of these derived versions could indicate a potential trend reversal, with a crossover of DI+ over DI- suggesting a possible uptrend and a crossover of DI- over DI+ indicating a potential downtrend.
Making Trading Decisions
Traders can use crossovers between the derived DI+ and DI- to receive signals for potential trend reversals. Additionally, changes in the color of candlesticks or background can be used as confirmation of the trend direction and its strength.
By utilizing these derived directional indicators, the F.B_DI+ DI- Trend Tracker indicator offers more precise trading signals and improved trend analysis, enabling traders to make informed trading decisions.
Goldmine Wealth Builder - DKK/SKKGoldmine Wealth Builder
Version 1.0
Introduction to Long-Term Investment Strategies: DKK, SKK1 and SKK2
In the dynamic realm of long-term investing, the DKK, SKK1, and SKK2 strategies stand as valuable pillars. These strategies, meticulously designed to assist investors in building robust portfolios, combine the power of Super Trend, RSI (Relative Strength Index), Exponential Moving Averages (EMAs), and their crossovers. By providing clear alerts and buy signals on a daily time frame, they equip users with the tools needed to make well-informed investment decisions and navigate the complexities of the financial markets. These strategies offer a versatile and structured approach to both conservative and aggressive investment, catering to the diverse preferences and objectives of investors.
Each part of this strategy provides a unique perspective and approach to the accumulation of assets, making it a versatile and comprehensive method for investors seeking to optimize their portfolio performance. By diligently applying this multi-faceted approach, investors can make informed decisions and effectively capitalize on potential market opportunities.
DKK Strategy for ETFs and Funds:
The DKK system is a strategy designed for accumulating ETFs and Funds as long-term investments in your portfolio. It simplifies the process of identifying trend reversals and opportune moments to invest in listed ETFs and Funds, particularly during bull markets. Here's a detailed explanation of the DKK system:
Objective: The primary aim of the DKK system is to build a long-term investment portfolio by focusing on ETFs and Funds. It facilitates the identification of stocks that are in the process of reversing their trends, allowing investors to benefit from upward price movements in these financial instruments.
Stock Selection Criteria: The DKK system employs specific criteria for selecting ETFs and Funds:
• 200EMA (Exponential Moving Average): The system monitors whether the prices of ETFs and Funds are consistently below the 200-day Exponential Moving Average. This is considered an indicator of weakness, especially on a daily time frame.
• RSI (Relative Strength Index): The system looks for an RSI value of less than 40. An RSI below 40 is often seen as an indication of a weak or oversold condition in a financial instrument.
Alert Signal: Once the DKK system identifies ETFs and Funds meeting these criteria, it provides an alert signal:
• Red Upside Triangle Sign: This signal is automatically generated on the daily chart of ETFs and Funds. It serves as a clear indicator to investors that it's an opportune time to accumulate these financial instruments for long-term investment.
It's important to note that the DKK system is specifically designed for ETFs and Funds, so it should be applied to these types of investments. Additionally, it's recommended to track index ETFs and specific types of funds, such as REITs (Real Estate Investment Trusts) and INVITs (Infrastructure Investment Trusts), in line with the DKK system's approach. This strategy simplifies the process of identifying investment opportunities within this asset class, particularly during periods of market weakness.
SKK1 Strategy for Conservative Stock Investment:
The SKK 1 system is a stock investment strategy tailored for conservative investors seeking long-term portfolio growth with a focus on stability and prudent decision-making. This strategy is meticulously designed to identify pivotal market trends and stock price movements, allowing investors to make informed choices and capitalize on upward market trends while minimizing risk. Here's a comprehensive overview of the SKK 1 system, emphasizing its suitability for conservative investors:
Objective: The primary objective of the SKK 1 system is to accumulate stocks as long-term investments in your portfolio while prioritizing capital preservation. It offers a disciplined approach to pinpointing potential entry points for stocks, particularly during market corrections and trend reversals, thereby enabling you to actively participate in bullish market phases while adopting a conservative risk management stance.
Stock Selection Criteria: The SKK 1 system employs a stringent set of criteria to select stocks for investment:
• Correction Mode: It identifies stocks that have undergone a correction, signifying a decline in stock prices from their recent highs. This conservative approach emphasizes the importance of seeking stocks with a history of stability.
• 200EMA (Exponential Moving Average): The system diligently analyses daily stock price movements, specifically looking for stocks that have fallen to or below the 200-day Exponential Moving Average. This indicator suggests potential overselling and aligns with a conservative strategy of buying low.
Trend Reversal Confirmation: The SKK 1 system doesn't merely pinpoint stocks in correction mode; it takes an extra step to confirm a trend reversal. It employs the following indicators:
• Short-term Downtrends Reversal: This aspect focuses on identifying the reversal of short-term downtrends in stock prices, observed through the transition of the super trend indicator from the red zone to the green zone. This cautious approach ensures that the trend is genuinely shifting.
• Super Trend Zones: These zones are crucial for assessing whether a stock is in a bullish or bearish trend. The system consistently monitors these zones to confirm a potential trend reversal.
Alert & Buy Signals: When the SKK 1 system identifies stocks that have reached a potential bottom and are on the verge of a trend reversal, it issues vital alert signals, aiding conservative investors in prudent decision-making:
• Orange Upside Triangle Sign: This signal serves as a cautious heads-up, indicating that a stock may be poised for a trend reversal. It advises investors to prepare funds for potential investment without taking undue risks.
• Green Upside Triangle Sign: This is the confirmation of a trend reversal, signifying a robust buy signal. Conservative investors can confidently enter the market at this point, accumulating stocks for a long-term investment, secure in the knowledge that the trend is in their favor.
In summary, the SKK 1 system is a systematic and conservative approach to stock investing. It excels in identifying stocks experiencing corrections and ensures that investors act when there's a strong indication of a trend reversal, all while prioritizing capital preservation and risk management. This strategy empowers conservative investors to navigate the intricacies of the stock market with confidence, providing a calculated and stable path toward long-term portfolio growth.
Note: The SKK1 strategy, known for its conservative approach to stock investment, also provides an option to extend its methodology to ETFs and Funds for those investors who wish to accumulate assets more aggressively. By enabling this feature in the settings, you can harness the SKK1 strategy's careful criteria and signal indicators to accumulate aggressive investments in ETFs and Funds.
This flexible approach acknowledges that even within a conservative strategy, there may be opportunities for more assertive investments in assets like ETFs and Funds. By making use of this option, you can strike a balance between a conservative stance in your stock portfolio while exploring an aggressive approach in other asset classes. It offers the versatility to cater to a variety of investment preferences, ensuring that you can adapt your strategy to suit your financial goals and risk tolerance.
SKK 2 Strategy for Aggressive Stock Investment:
The SKK 2 strategy is designed for those who are determined not to miss significant opportunities within a continuous uptrend and seek a way to enter a trend that doesn't present entry signals through the SKK 1 strategy. While it offers a more aggressive entry approach, it is ideal for individuals willing to take calculated risks to potentially reap substantial long-term rewards. This strategy is particularly suitable for accumulating stocks for aggressive long-term investment. Here's a detailed description of the SKK 2 strategy:
Objective: The primary aim of the SKK 2 strategy is to provide an avenue for investors to identify short-term trend reversals and seize the opportunity to enter stocks during an uptrend, thereby capitalizing on a sustained bull run. It acknowledges that there may not always be clear entry signals through the SKK 1 strategy and offers a more aggressive alternative.
Stock Selection Criteria: The SKK 2 strategy utilizes a specific set of criteria for stock selection:
1. 50EMA (Exponential Moving Average): It targets stocks that are trading below the 50-day Exponential Moving Average. This signals a short-term reversal from the top and indicates that the stock is in a downtrend.
2. RSI (Relative Strength Index): The strategy considers stocks with an RSI of less than 40, which is an indicator of weakness in the stock.
Alert Signals: The SKK 2 strategy provides distinct alert signals that facilitate entry during an aggressive reversal:
• Red Downside Triangle Sign: This signal is triggered when the stock is below the 50EMA and has an RSI of less than 40. It serves as a clear warning of a short-term reversal from the top and a downtrend, displayed on the daily chart.
• Purple Upside Triangle Sign: This sign is generated when a reversal occurs through a bullish candle, and the RSI is greater than 40. It signifies the stock has bottomed out from a short-term downtrend and is now reversing. This purple upside triangle serves as an entry signal on the chart, presenting an attractive opportunity to accumulate stocks during a strong bullish phase, offering a chance to seize a potentially favorable long-term investment.
In essence, the SKK 2 strategy caters to aggressive investors who are willing to take calculated risks to enter stocks during a continuous uptrend. It focuses on identifying short-term reversals and provides well-defined signals for entry. While this strategy is more aggressive in nature, it has the potential to yield substantial rewards for those who are comfortable with a higher level of risk and are looking for opportunities to build a strong long-term portfolio.
Introduction to Strategy Signal Information Chart
This chart provides essential information on strategy signals for DKK, SKK1, and SKK2. By quickly identifying "Buy" and "Alert" signals for each strategy, investors can efficiently gauge market conditions and make informed decisions to optimize their investment portfolios.
In Conclusion
These investment strategies, whether conservative like DKK and SKK1 or more aggressive like SKK2, offer a range of options for investors to navigate the complex world of long-term investments. The combination of Super Trend, RSI, and EMAs with their crossovers provides clear signals on a daily time frame, empowering users to make well-informed decisions and potentially capitalize on market opportunities. Whether you're looking for stability or are ready to embrace more risk, these strategies have something to offer for building and growing your investment portfolio.

SMA/EMA/RSImagic 36.963 by IgorPlahutaTwo Elements in this script:
Alerts: These are notifications that draw your attention to specific market conditions. There are two types:
RSI Higher Lows or Lower Highs: This alert triggers when the Relative Strength Index (RSI) forms higher lows or lower highs.
RSI Exiting 30 (Up) or RSI Exiting 70 (Down): These alerts activate when the RSI crosses the 30 threshold upwards or the 70 threshold downwards.
ALL BUY/SELL: to catch both of them with one setting
To Set Up an Alert: To configure an alert, select the one relevant to your trading strategy, choose the "Greater than" option, and input a value of "0" (this essentially activates the alert). Adjust other settings as per your requirements.
Please note that these alerts should be used in conjunction with a system you trust for confirmation.
Moving Averages: This involves monitoring several moving averages:
SMA12, SMA20, EMA12, EMA20: These moving averages are highlighted with background colors to help you quickly identify changes or crossovers. They are superimposed on each other for easy comparison.
SMA 50, SMA200: These moving averages are also highlighted with background colors to spot crossovers, and their lines change color depending on their direction (falling in red or rising in green).
Enjoy using these tools in your trading endeavors!

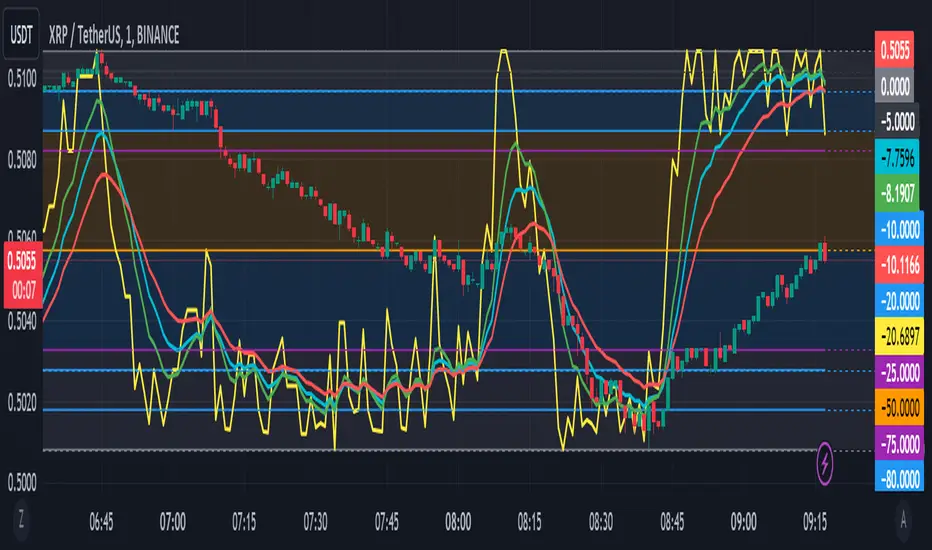
Williams %R with EMA'sThe provided Pine Script code presents a comprehensive technical trading strategy on the TradingView platform, incorporating the Williams %R indicator, exponential moving averages (EMAs), and upper bands for enhanced decision-making. This strategy aims to help traders identify potential buy and sell signals based on various technical indicators, thereby facilitating more informed trading decisions.
The key components of this strategy are as follows:
**Williams %R Indicator:** The Williams %R, also known as the "Willy," is a momentum oscillator that measures overbought and oversold conditions. In this code, the Williams %R is calculated with a user-defined period (default 21) and smoothed using an exponential moving average (EMA).
**Exponential Moving Averages (EMAs):** Two EMAs are computed on the Williams %R values. The "Fast" EMA (default 8) responds quickly to price changes, while the "Slow" EMA (default 21) provides a smoother trend-following signal. Crossovers and divergences between these EMAs can indicate potential buy or sell opportunities.
**Candle Color Detection:** The code also tracks the color of candlesticks, distinguishing between green (bullish) and red (bearish) candles. This information is used in conjunction with other indicators to identify specific trading conditions.
**Additional Upper Bands:** The script introduces upper bands at various levels (-5, -10, -20, -25) to create zones for potential buy and sell signals. These bands are visually represented on the chart and can help traders gauge the strength of a trend.
**Alert Conditions:** The code includes several alert conditions that trigger notifications when specific events occur, such as %R crossing certain levels, candle color changes within predefined upper bands, and EMA crossovers.
**Background Highlighting:** The upper bands and the zero line are visually highlighted with different colors, making it easier for traders to identify critical price levels.
This code is valuable for traders seeking a versatile technical strategy that combines multiple indicators to improve trading decisions. By incorporating the Williams %R, EMAs, candlestick analysis, and upper bands, it offers a holistic approach to technical analysis. Traders can customize the parameters to align with their trading preferences and risk tolerance. The use of alerts ensures that traders are promptly notified of potential trade setups, allowing for timely execution and risk management. Overall, this code serves as a valuable tool for traders looking to make more informed decisions in the dynamic world of financial markets.
Indicator Based Market Exposure (IBME)The Indicator Based Market Exposure (IBME) system was created by Big Wave Chartist as a way to navigate the markets using a confluence of three different signals to determine when the "internals" of the market are in your favor and how heavily invested to be at any point. The idea of the system is also to flash warning signs when the market internals are beginning to deteriorate so as to take a defensive stance. Of course this system can be strictly adhered to, or it can be incorporated into a more discretionary style of trading, and be combined with progressive exposure into (and out of) the market as positions gain (or lose) traction.
The IBME displays a straightforward action signal based on the combination of the 3 separate signals:
Green 🟢 Full size-longs permitted
Yellow 🟡 Pilot positions permitted
Red 🔴 No longs allowed
So let's get into the signals used:
McClellan Summation Index
Net New Highs/Lows
Net New Highs Crossover
McClellan Summation Index (MSI)
The McClellan Summation Index is a long-term version of the McClellan Oscillator, which is a market breadth indicator based on stock advances and declines. Interpretation is similar to that of the McClellan Oscillator, except that it is more suited to intermediate to major trends and related reversals. The McClellan Summation Index can be calculated as the sum of all the daily values of the McClellan Oscillator. This is used along with the 10-sma to watch for a crossover indicating an uptrend or downtrend beginning.
Net New Highs/Lows
This is the net number of stocks making 52-week highs or lows. For instance, if there are 60 new 52-week highs and 20 new 52-week lows, the net number will be 40 net new 52 week highs. This signal is particularly useful in gauging breadth.
Net New Highs Crossover
This is the description of NNHC from the original separate version of this indicator created by HikoStory: "Net New Highs can guide you to increase or decrease your exposure based on the current market health. They are calculated by subtracting the new highs from the new lows, based on all stocks of the...NASDAQ. A positive value shows that the market is doing good, since more stocks are making new highs compared to new lows. A negative value shows that the market is doing bad, since more stocks are making new lows compared to new highs. Combined with a moving average you can see crossovers that can warn you early when there is a change in the current market health."
The default index for the IBME is the Nasdaq.
The IBME is meant to be used on a daily time frame chart, therefore the signal will only show on a daily time frame chart.
Display options include:
Show/hide individual signals
Table background/font color
Table size/placement

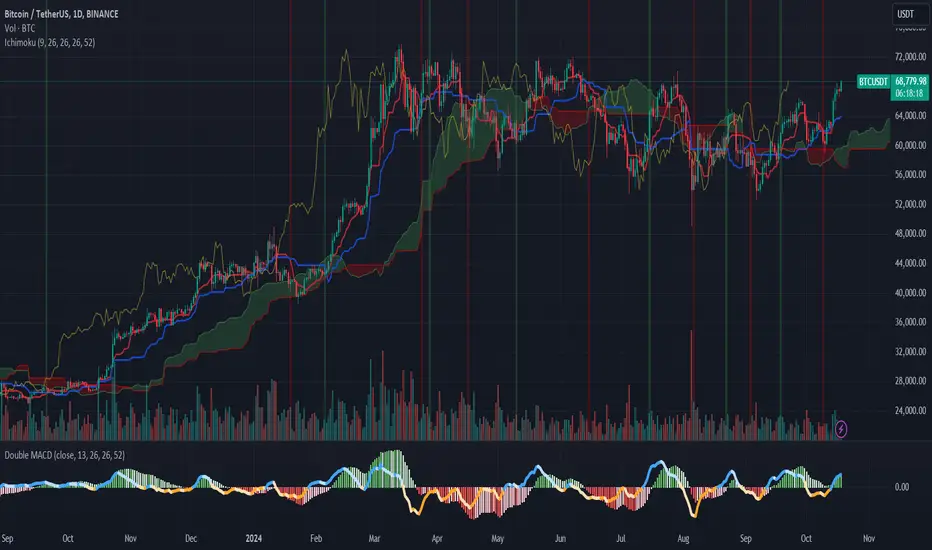
Ichimoku [2022] [v5] [keivanipchihagh]A more personalized ichimoki indicator with more configurations.
This indicator is exactly like the original ichimoku indicator, but with 104 Line (x4 timeframe) , 208 Line (x8 timeframe) , Quality Line and Tenken-sen & Kijun-sen crossovers added as well. The extras added to the indicator can simply be hidden in order to make the chart look less full.
104 Line : The formula is to average the highest and lowest point of the last 104 candles. This is to see the x4 time-frame as well, which shows a strong support and resistance line.
208 Line : The formula is to average the highest and lowest point of the last 208 candles. This is to see the 84 time-frame as well, which shows even a stronger support and resistance line.
Quality Line : It's exactly the same the Kijun-sen but with a positive offset of 26.
Tenken-sen & Kijun-sen Crossoveers : Just to make it easier to see the crossovers.
In future updates, I'm going to add more components and make it more insightful than it currently is. Ideas would be appreciated (:
Indicator Visualizer V1.0This is a script so that you can visualize crossover/under indicators on the chart as zones/boxes or as lines.
By default the source is "Close". When the source is Close and the default RSI is checked, then the indicator will visualize crossover and under from a 14 period RSI as shown in the published chart.
How this indicator works:
Add the indicator you want to visualize to the chart, and this indicator.
Open this indicator and set the source to the indicator you want to visualize, then set the levels you want to visualize the crossovers for.
Using the default as an example
When the RSI crosses above level 1 (default 70) then it will begin plotting a "Cross Over" box.
Each bar that the RSI remains above level 1 it will adjust the top of the box and the right side of the box.
When RSI crosses back below level 1 then the box will stop adjusting and end on that bar.
Using the default as an example
When the RSI crosses below level 2 (default 30) then it will begin plotting a "Cross Under" box.
Each bar that the RSI remains below level 2 it will adjust the bottom of the box and the right side of the box.
When RSI crosses back above level 2 then the box will stop adjusting and end on that bar.
If you want to use lines they will be drawn from the close of the starting bar to the close of the current/end bar.
You are able to set an extension for the lines if you would like them to extend a specific amount past the close bar. (I.E. 1,2,or 3 bars)
If you wish to use the source as close, then you must uncheck the Default RSI box.
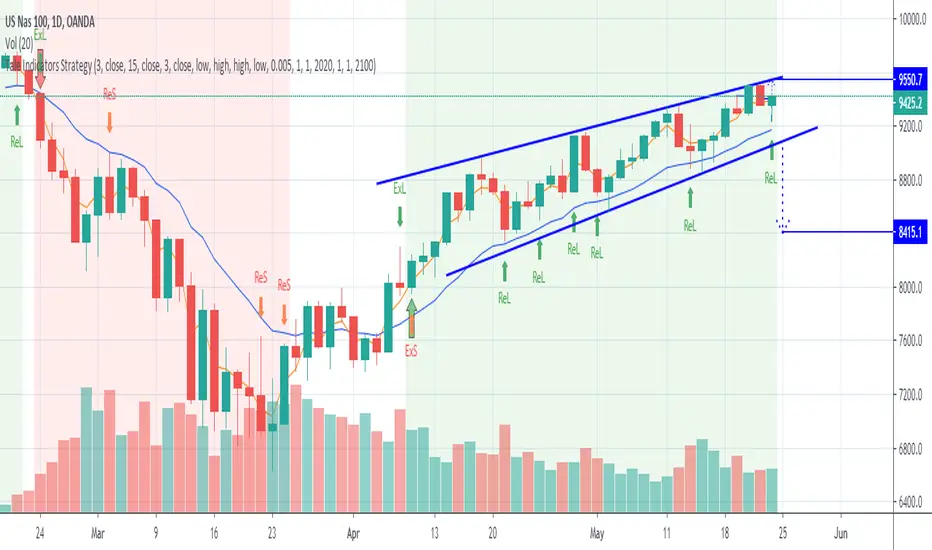
Tale Indicators StrategyThis script provides strategy from @JackBauer007 of the slowMA and fastMA crossovers to determine entry and exit conditions.
The default is set to 3EMA and 15EMA crossovers. With entry and exit for Long positions set to high and for Short positions set to low.
You can enable to run the strategy for a selected time-period to analyse the strategy on your instrument.
Credits to @ECHKAY and @JackBauer007 for their inputs and help
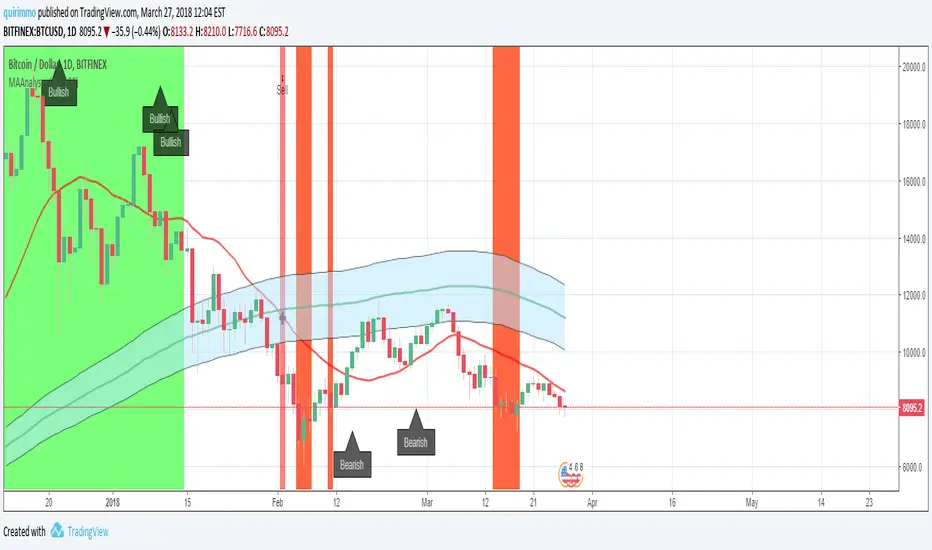
MA AnalysesA script for having two averages at the same time, a fast and a slow one (periods customizable by the user) and in order to analyze all the MA conditions of trend confirmation and crossovers.
The script provide the following information:
1) Buy/Sell alert when the fast MA crosses the slow MA through a cross on the chart and a Buy/Sell arrow on the chart
2) Bullish/Bearish trend confirmation through green/red area
3) Bullish/Bearish price crossovers through a circle on the chart and a Bullish/Bearish label
4) Support/Resistance areas through a blue area drawn on the chart
DecisionPoint Price Momentum Oscillator [LazyBear]The DecisionPoint Price Momentum Oscillator (PMO) is an oscillator based on a Rate of Change calculation that is smoothed twice with custom exponential moving averages. Because the PMO is normalized, it can also be used as a relative strength tool.
PMO can be used in many ways:
- PMO can be used to determine the OB/OS state. While the +2.5 to -2.5 is the usual range for broad stock market indexes, each price index will have its own “signature” range. You may have to tune this for your instrument.
- PMO triggers buy/sell on signal crossovers and ZERO crossovers.
- Common patterns like BullKiss, BearKiss are useful to track. See the link below for more info.
- Divergences.
- Histo-only mode that can be used similar to MACD-Histo.
I have exposed all params as configurable. Have fun tuning :) Don't forget to share what you found for your instrument.
More Info:
stockcharts.com
List of my public indicators: bit.ly
List of my app-store indicators: blog.tradingview.com
Some Sample Charts:
TWTR:
MSFT:
GOOGL:

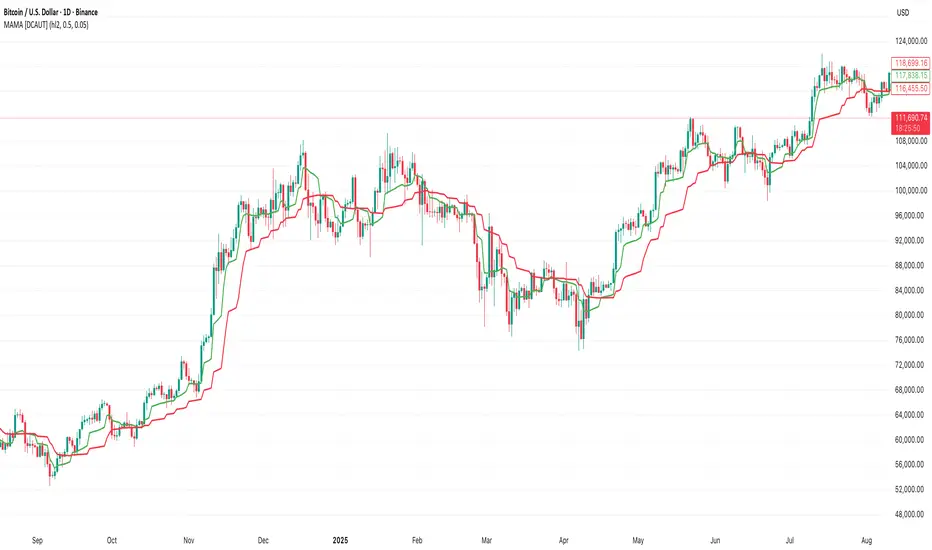
MAMA [DCAUT]█ MAMA (MESA Adaptive Moving Average)
📊 OVERVIEW
The MESA Adaptive Moving Average (MAMA) represents an advanced implementation of John F. Ehlers' adaptive moving average system using the Hilbert Transform Discriminator. This indicator automatically adjusts to market cycles, providing superior responsiveness compared to traditional fixed-period moving averages while maintaining smoothness.
MAMA dynamically calculates two lines: the fast-adapting MAMA line and the following FAMA (Following Adaptive Moving Average) line. The system's core strength lies in its ability to automatically detect and adapt to the dominant market cycle, reducing lag during trending periods while providing stability during consolidation phases.
🎯 CORE CONCEPTS
Signal Interpretation:
• MAMA above FAMA: Indicates bullish trend momentum with the fast line leading upward movement
• MAMA below FAMA: Suggests bearish trend momentum with the fast line leading downward movement
• Golden Cross: MAMA crossing above FAMA signals potential upward momentum shift
• Death Cross: MAMA crossing below FAMA indicates potential downward momentum shift
• Line Convergence: MAMA and FAMA approaching each other suggests trend consolidation or potential reversal
Primary Applications:
• Trend Following: Enhanced responsiveness to trend changes compared to traditional moving averages
• Crossover Signals: MAMA/FAMA crossovers for identifying potential entry and exit points
• Cycle Analysis: Automatic adaptation to market's dominant cycle characteristics
• Reduced Lag: Minimized delay in trend detection while maintaining signal smoothness
📐 MATHEMATICAL FOUNDATION
Hilbert Transform Discriminator Technology:
The MAMA system employs John F. Ehlers' Hilbert Transform Discriminator, a sophisticated signal processing technique borrowed from telecommunications engineering. The Hilbert Transform creates a complex representation of the price series by generating a 90-degree phase-shifted version of the original signal, enabling precise cycle measurement.
The discriminator analyzes the instantaneous phase relationships between the original price series and its Hilbert Transform counterpart. This mathematical relationship reveals the dominant cycle period present in the market data at each point in time, forming the foundation for adaptive smoothing.
Instantaneous Period Calculation:
The algorithm computes the instantaneous period using the arctangent of the ratio between the Hilbert Transform and the original price series. This calculation produces a real-time measurement of the market's dominant cycle, typically ranging from short-term noise cycles to longer-term trend cycles.
The instantaneous period measurement undergoes additional smoothing to prevent erratic behavior from single-bar anomalies. This smoothed period value becomes the basis for calculating the adaptive alpha coefficient that controls the moving average's responsiveness.
Dynamic Alpha Coefficient System:
The adaptive alpha calculation represents the core mathematical innovation of MAMA. The alpha coefficient is derived from the instantaneous period measurement and constrained within the user-defined fast and slow limits.
The mathematical relationship converts the measured cycle period into an appropriate smoothing factor: shorter detected cycles result in higher alpha values (increased responsiveness), while longer cycles produce lower alpha values (increased stability). This creates an automatic adaptation mechanism that responds to changing market conditions.
MAMA/FAMA Calculation Process:
The MAMA line applies the dynamically calculated alpha coefficient to an exponential moving average formula: MAMA = alpha × Price + (1 - alpha) × MAMA . The FAMA line then applies a secondary smoothing operation to the MAMA line, creating a following average that provides confirmation signals.
This dual-line approach ensures that the fast-adapting MAMA line captures trend changes quickly, while the FAMA line offers a smoother confirmation signal, reducing the likelihood of acting on temporary price fluctuations.
Cycle Detection Mechanism:
The underlying cycle detection employs quadrature components derived from the Hilbert Transform to measure both amplitude and phase characteristics of price movements. This allows the system to distinguish between genuine trend changes and temporary price noise, automatically adjusting the smoothing intensity accordingly.
The mathematical framework ensures that during strong trending periods with clear directional movement, the algorithm reduces smoothing to minimize lag. Conversely, during consolidation phases with mixed signals, increased smoothing helps filter out false breakouts and whipsaws.
📋 PARAMETER CONFIGURATION
Source Selection Strategy:
• HL2 (High+Low)/2 (Default): Recommended for cycle analysis as it represents the midpoint of each period's trading range, reducing impact of opening gaps and closing spikes
• Close Price: Traditional choice reflecting final market sentiment, suitable for end-of-day analysis
• HLC3 (High+Low+Close)/3: Balanced approach incorporating range information with closing emphasis
• OHLC4 (Open+High+Low+Close)/4: Most comprehensive price representation for complete market view
Fast Limit Configuration (Default 0.5):
Controls the maximum responsiveness of the adaptive system. Higher values increase sensitivity to recent price changes but may introduce more noise. This parameter sets the upper bound for the dynamic alpha calculation.
Slow Limit Configuration (Default 0.05):
Determines the minimum responsiveness, providing stability during uncertain market conditions. Lower values increase smoothing but may cause delayed signals. This parameter sets the lower bound for the dynamic alpha calculation.
Parameter Relationship Considerations:
The fast and slow limits work together to define the adaptive range. The wider the range between these limits, the more dramatic the adaptation between trending and consolidating market conditions. Different market characteristics may benefit from different parameter configurations, requiring individual testing and validation.
📊 COLOR CODING SYSTEM
Line Visualization:
• Green Line (MAMA): The fast-adapting moving average that responds quickly to price changes
• Red Line (FAMA): The following adaptive moving average that provides confirmation signals
The fixed color scheme provides consistent visual identification of each line, enabling clear differentiation between the fast-adapting MAMA and the following FAMA throughout all market conditions.
💡 CORE VALUE PROPOSITION
Advantages Over Traditional Moving Averages:
• Cycle Adaptation: Automatically adjusts to market's dominant cycle rather than using fixed periods
• Reduced Lag: Faster response to genuine trend changes while filtering market noise
• Mathematical Foundation: Based on advanced signal processing techniques from telecommunications engineering
• Dual-Line System: Provides both fast adaptation (MAMA) and confirmation (FAMA) in one indicator
Comparative Performance Characteristics:
Unlike fixed-period moving averages that apply the same smoothing regardless of market conditions, MAMA adapts its behavior based on current market cycle characteristics. This may help reduce whipsaws during consolidation periods while maintaining responsiveness during trending phases.
Usage Considerations:
This indicator is designed for technical analysis purposes. The adaptive nature means that parameter optimization should consider the specific characteristics of the asset and timeframe being analyzed. Like all technical indicators, MAMA should be used as part of a comprehensive analysis approach rather than as a standalone signal generator.
Alert Functionality:
The indicator includes alert conditions for MAMA/FAMA crossovers, enabling automated notification of potential momentum shifts. These alerts can assist in timing analysis but should be combined with other forms of market analysis for decision-making purposes.
AL-SAT (Dönüş Odaklı: EMA+RSI+MACD)AL-SAT (Reversal Focused: EMA+RSI+MACD) combines three indicators to catch trend reversals.
- EMA50/200 crossovers define the main trend.
- RSI (14) confirms oversold/overbought reversals.
- MACD crossovers confirm momentum shifts.
Signals are generated at crossover points and remain valid until the opposite signal appears.
Best used on 1D or 4H timeframes. Works well for spotting early trend reversals, but may produce noise in sideways markets.

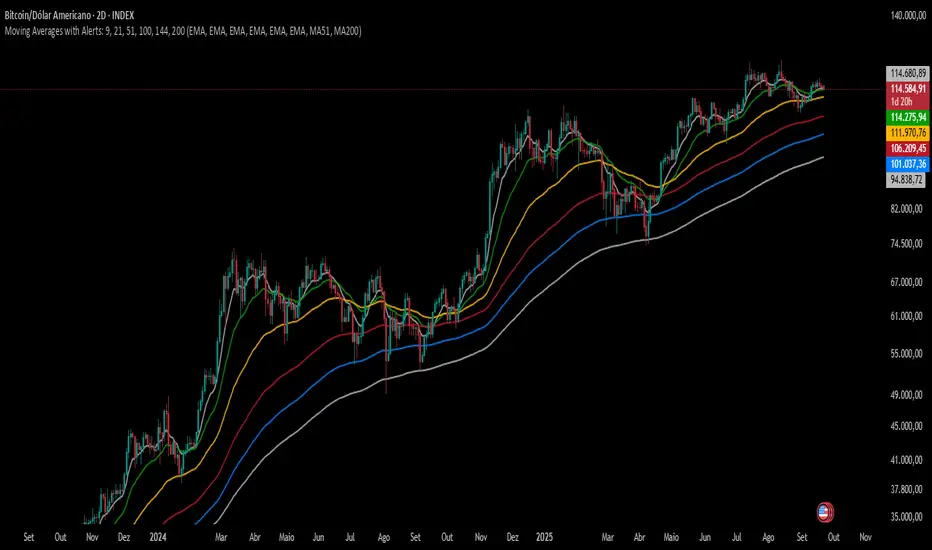
Moving Averages with Alerts: 9, 21, 51, 100, 144, 200---
This indicator plots six configurable moving averages (MA) with options for EMA, SMA, RCI, HMA, and Pivô Boss types. It highlights key crossover points, especially monitoring the 9-period MA for crosses with others. Users can enable alerts for these crossovers, as well as set custom alerts between any two selected MAs. Additionally, the indicator marks the important crossovers of the 51 and 200 MAs on the chart with an “X”. This helps traders identify trend changes and potential entry or exit points efficiently.
---
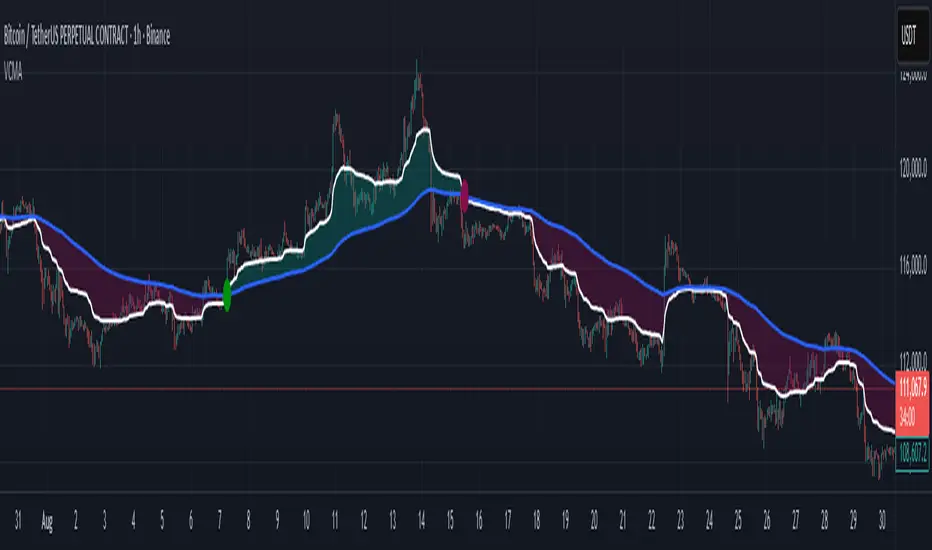
Volumetric Compressed MAVCMA (Volumetric Compressed Moving Average) uses the compressor and weighted standard deviation functions originally translated to pinescript by @gorx1 to plot moving averages in order to use for entry confirmation.
🔹 Concepts and Idea:
When we do music we always use different kinds of filters (low-pass, high pass, etc) for equalization and filtering itself. That stuff we use in finance as well. What we also always use in music are compressors, there dynamic processors that automatically adjust volume so it will be more consistent. Almost all the cool music you hear is compressed (both individual instruments (especially vocals) and the whole track afterwards), otherwise stuff will be too quite and too weak to flex on it, and also DJing it would be a nightmare.
🔹 Model:
I don't wanna explain it all in statistical / DSP way for once.
First of all, I think the population of volumes is log-normally distributed, so let's take logs of volumes, now we have a ~ normally distributed data. We take linearly weighted mean, add and subtract linearly weighted standard deviation from it, these would be our thresholds, the borders between different kinds of volumes explained before.
The upper threshold is for downward compression, that will not let volume pass it higher.
The lower threshold is for upward compression, all the volumes lower than this threshold will be brought up to the threshold's level.
Then we apply multipliers to the thresholds in order to adjust em and find the sweet spots. We do it the same way as in sound engineering when we don't aim for overcompression, we adjust the thresholds until they start to touch the signal and all good.
Afterwards, we delete all the number 1 and number 3 volume, leaving us exclusively with the clear main component, ready to be processed further.
We return the volumes to dem real scale.
For more info on Volume Compression it's highly advised to check @gorx1's initial script Volume Compressor
🔹 Settings:
MA Type: Moving average type to be used for comparison after calculating the compressed version of volume. This creates the second line after the compression line, so we can consider crossovers for confirmation entries.
Upward threshold: Upward threshold where the compression of volume is calculated. Increasing usually causes smoother lines.
Downward threshold: Downward threshold where the compression of volume is calculated. Decreasing usually causes smoother lines.
Compression Lookback: The Main lookback window of a volume that is used for compression. Increasing this would provide smoother lines but might cause delayed signals. Decreasing means more signals, but might cause whiplash and distorted signals.
Comparative Lookback: This is our lookback to be used with our ma type selection. There is no static better or worse lookback value for this indicator. It should be adjusted based on the pair.
🔹 Where to use:
This indicator should be used as another confirmation tool for your entry signals in your existing strategy/market following combination. Green dots (crossovers) mean bullish movement is expected, and red dots (crossbounders) mean bearish movement is expected. Automated crossover alerts are available. A reminder is that this kind of indicator should not be used on its own for trading, but rather should be used as a confirmation along with your trend detection and main entry indicators to provide additional confidence.
If you want to know under the hood, read the How it works section below.
🔹 How it works:
//This is our main compression calculation, which is used for the first line.
Compressed_out = compressor(volume, len_window, up_thresh, down_thresh)
//This is the secondary ratio calculation that we use for the second line.
Comp_ma = ma(ma_type, close * compressed_out, len_ml) / ma(ma_type, compressed_out, len_ml)
Vwma = ma(ma_type, close, len_window)
We calculate the ratio of the compressed volume and plot it against the base MA. Base MA's length is determined by the Compression Lookback input compared to the Comperative Lookback that is used for the compressed version. This provides us with another possible confirmation indicator that can be used to take advantage of volume ranges.
Razor Precision — Buy/SellRazor Precision Stock Action Indicator
The Razor Precision indicator is an advanced, multi-layered market analysis tool designed for traders who demand accuracy and alignment across multiple timeframes. It combines price action, moving average crossovers, volume confirmation, swing structure mapping, and indicator confluence (RSI, MACD, ATR, OBV) to generate actionable buy/sell strength ratings.
Key Features:
Price Action Detection: Identifies higher highs/lows (uptrend) and lower highs/lows (downtrend).
MA Crossover Momentum: Monitors 50/200 moving average crossovers to detect trend shifts.
Volume Surge Analysis: Confirms breakouts or pullbacks with significant volume spikes.
Swing Structure Tracking: Maps internal/external breaks to align with Smart Money Concepts.
Indicator Confluence: Aggregates signals from RSI, MACD, ATR, and OBV for precision confirmation.
Multi-Timeframe Alignment: Compares trends across 15m, 1H, 4H, and Daily charts for stacked or conflicting signals.
Strength Levels: Signals range from SELL, STRONG SELL, ULTRA STRONG SELL to BUY, STRONG BUY, ULTRA STRONG BUY.
Dynamic Table Display: Updates every 5 minutes or when overall action changes, showing per-timeframe analysis and the aggregated decision.
Ideal for swing traders, scalpers, and intraday momentum players who want high-confidence trade direction filtered through multiple technical layers.

EMA Pullback Entry SignalsEMA Pullback Entry Signals is a tool designed to help traders identify trend continuation opportunities by detecting price pullbacks toward a slow EMA (Exponential Moving Average) during trending conditions.
This indicator combines moving average crossovers, price interaction with EMAs, and optional filtering to improve the timing and quality of trend entries.
Core Features:
Golden Cross / Death Cross Detection
Golden Cross: Fast EMA crossing above Slow EMA
Death Cross: Fast EMA crossing below Slow EMA
Optional X-shaped markers for crossover visualization
Pullback Signal on Slow EMA
Green triangle: Price crosses up through the slow EMA during a bullish trend
Red triangle: Price crosses down through the slow EMA during a bearish trend
Designed to capture continuation entries after a trend pullback
Optional Fast EMA Signals
Green arrow: Price crosses above fast EMA in a bull trend
Red arrow: Price crosses below fast EMA in a bear trend
Helps confirm minor retracements or short-term momentum shifts
Sideways Market Filter
Suppresses signals when the fast and slow EMAs are too close
Prevents entries during low-trend or choppy price action
Cooldown Timer
Enforces a minimum bar interval between signals to reduce overtrading
Helps avoid multiple entries from clustered signals
Custom Alerts
Alerts available for all signal types
Include ticker and timeframe in each alert message
Configurable Settings:
Fast and slow EMA lengths1
Toggle individual signal types (pullbacks, fast EMA crosses, crossovers)
Enable/disable cooldown logic and set bar duration
Sideways market detection sensitivity (EMA proximity threshold)
Primary Use Case
This script is most useful for trend-following traders seeking to enter pullbacks after a trend is established. When the price retraces to the slow EMA and then resumes in the trend direction, it can offer high-quality continuation setups. Works well across timeframes and markets.

Mutanabby_AI __ OSC+ST+SQZMOMMutanabby_AI OSC+ST+SQZMOM: Multi-Component Trading Analysis Tool
Overview
The Mutanabby_AI OSC+ST+SQZMOM indicator combines three proven technical analysis components into a unified trading system, providing comprehensive market analysis through integrated oscillator signals, trend identification, and volatility assessment.
Core Components
Wave Trend Oscillator (OSC): Identifies overbought and oversold market conditions using exponential moving average calculations. Key threshold levels include overbought zones at 60 and 53, with oversold areas marked at -60 and -53. Crossover signals between the two oscillator lines generate entry opportunities, displayed as colored circles on the chart for easy identification.
Supertrend Indicator (ST): Determines overall market direction using Average True Range calculations with a 2.5 factor and 10-period ATR configuration. Green lines indicate confirmed uptrends while red lines signal downtrend conditions. The indicator automatically adapts to market volatility changes, providing reliable trend identification across different market environments.
Squeeze Momentum (SQZMOM): Compares Bollinger Bands with Keltner Channels to identify consolidation periods and potential breakout scenarios. Black squares indicate squeeze conditions representing low volatility periods, green triangles signal confirmed upward breakouts, and red triangles mark downward breakout confirmations.
Signal Generation Logic
Long Entry Conditions:
Green triangles from Squeeze Momentum component
Supertrend line transitioning to green
Bullish crossovers in Wave Trend Oscillator from oversold territory
Short Entry Conditions:
Red triangles from Squeeze Momentum component
Supertrend line transitioning to red
Bearish crossovers in Wave Trend Oscillator from overbought territory
Automated Risk Management
The indicator incorporates comprehensive risk management through ATR-based calculations. Stop losses are automatically positioned at 3x ATR distance from entry points, while three progressive take profit targets are established at 1x, 2x, and 3x ATR multiples respectively. All risk management levels are clearly displayed on the chart using colored lines and informative labels.
When trend direction changes, the system automatically clears previous risk levels and generates new calculations, ensuring all risk parameters remain current and relevant to existing market conditions.
Alert and Notification System
Comprehensive alert framework includes trend change notifications with complete trade setup details, squeeze release alerts for breakout opportunity identification, and trend weakness warnings for active position management. Alert messages contain specific trading pair information, timeframe specifications, and all relevant entry and exit level data.
Implementation Guidelines
Timeframe Selection: Higher timeframes including 4-hour and daily charts provide the most reliable signals for position trading strategies. One-hour charts demonstrate good performance for day trading applications, while 15-30 minute timeframes enable scalping approaches with enhanced risk management requirements.
Risk Management Integration: Limit individual trade risk to 1-2% of total capital using the automatically calculated stop loss levels for precise position sizing. Implement systematic profit-taking at each target level while adjusting stop loss positions to protect accumulated gains.
Market Volatility Adaptation: The indicator's ATR-based calculations automatically adjust to changing market volatility conditions. During high volatility periods, risk management levels appropriately widen, while low volatility conditions result in tighter risk parameters.
Optimization Techniques
Combine indicator signals with fundamental support and resistance level analysis for enhanced signal validation. Monitor volume patterns to confirm breakout strength, particularly when Squeeze Momentum signals develop. Maintain awareness of scheduled economic events that may influence market behavior independent of technical indicator signals.
The multi-component design provides internal signal confirmation through multiple alignment requirements, significantly reducing false signal occurrence while maintaining reasonable trade frequency for active trading strategies.
Technical Specifications
The Wave Trend Oscillator utilizes customizable channel length (default 10) and average length (default 21) parameters for optimal market sensitivity. Supertrend calculations employ ATR period of 10 with factor multiplier of 2.5 for balanced signal quality. Squeeze Momentum analysis uses Bollinger Band length of 20 periods with 2.0 multiplication factor, combined with Keltner Channel length of 20 periods and 1.5 multiplication factor.
Conclusion
The Mutanabby_AI OSC+ST+SQZMOM indicator provides a systematic approach to technical market analysis through the integration of proven oscillator, trend, and momentum components. Success requires thorough understanding of each element's functionality and disciplined implementation of proper risk management principles.
Practice with demo trading accounts before live implementation to develop familiarity with signal interpretation and trade management procedures. The indicator's systematic approach effectively reduces emotional decision-making while providing clear, objective guidelines for trade entry, management, and exit strategies across various market conditions.
