Supertrend and MACD strategyThe Supertrend and MACD Strategy is a comprehensive trading approach designed to capitalize on market trends by using a combination of the Supertrend indicator, the Exponential Moving Average (EMA), and the Moving Average Convergence Divergence (MACD). This strategy aims to identify optimal entry and exit points for both long and short trades, while incorporating strict risk management rules.
Indicators Used:
Supertrend: This indicator is used to identify the overall trend direction. It provides clear signals for trend reversals, helping traders to enter trades in the direction of the prevailing trend.
200-period EMA: This long-term moving average is used to determine the primary trend direction. The strategy only takes long trades when the price is above the 200 EMA and short trades when the price is below it.
MACD: The MACD is used to gauge the momentum and confirm the signals provided by the Supertrend and EMA. It consists of the MACD line, the signal line, and the histogram.
Entry Conditions:
Long Entry:
The Supertrend indicator shows an uptrend (direction > 0).
The MACD line is above the signal line (macd > signal).
The price is above the 200-period EMA (close > ema200).
Short Entry:
The Supertrend indicator shows a downtrend (direction < 0).
The MACD line is below the signal line (macd < signal).
The price is below the 200-period EMA (close < ema200).
Exit Conditions:
Long Exit:
Exit the long position when the MACD line crosses below the signal line (ta.crossunder(macd, signal)).
Set a stop loss (SL) below the lowest low of the last 10 periods (lowestLow - 1).
Short Exit:
Exit the short position when the MACD line crosses above the signal line (ta.crossover(macd, signal)).
Set a stop loss (SL) above the highest high of the last 10 periods (highestHigh + 1).
Risk Management:
The strategy ensures that no new positions are opened if there is already an open trade, preventing overexposure in the market.
Alerts:
Alerts are set to notify traders when the MACD crosses the signal line, providing timely updates for potential exit points.
Cerca negli script per "entry"

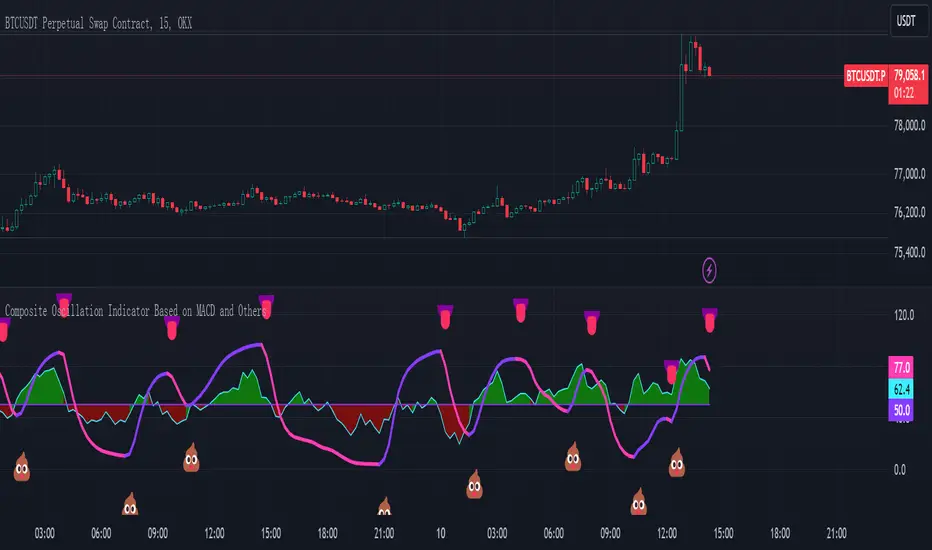
Composite Oscillation Indicator Based on MACD and OthersThis indicator combines various technical analysis tools to create a composite oscillator that aims to capture multiple aspects of market behavior. Here's a breakdown of its components:
* Individual RSIs (xxoo1-xxoo15): The code calculates the RSI (Relative Strength Index) of numerous indicators, including volume-based indicators (NVI, PVI, OBV, etc.), price-based indicators (CCI, CMO, etc.), and moving averages (WMA, ALMA, etc.). It also includes the RSI of the MACD histogram (xxoo14).
* Composite RSI (xxoojht): The individual RSIs are then averaged to create a composite RSI, aiming to provide a more comprehensive view of market momentum and potential turning points.
* MACD Line RSI (xxoo14): The RSI of the MACD histogram incorporates the momentum aspect of the MACD indicator into the composite measure.
* Double EMA (co, coo): The code employs two Exponential Moving Averages (EMAs) of the composite RSI, with different lengths (9 and 18 periods).
* Difference (jo): The difference between the two EMAs (co and coo) is calculated, aiming to capture the rate of change in the composite RSI.
* Smoothed Difference (xxp): The difference (jo) is further smoothed using another EMA (9 periods) to reduce noise and enhance the signal.
* RSI of Smoothed Difference (cco): Finally, the RSI is applied to the smoothed difference (xxp) to create the core output of the indicator.
Market Applications and Trading Strategies:
* Overbought/Oversold: The indicator's central line (plotted at 50) acts as a reference for overbought/oversold conditions. Values above 50 suggest potential overbought zones, while values below 50 indicate oversold zones.
* Crossovers and Divergences: Crossovers of the cco line above or below its previous bar's value can signal potential trend changes. Divergences between the cco line and price action can also provide insights into potential trend reversals.
* Emoji Markers: The code adds emoji markers ("" for bullish and "" for bearish) based on the crossover direction of the cco line. These can provide a quick visual indication of potential trend shifts.
* Colored Fill: The area between the composite RSI line (xxoojht) and the central line (50) is filled with color to visually represent the prevailing market sentiment (green for above 50, red for below 50).
Trading Strategies (Examples):
* Long Entry: Consider a long entry (buying) signal when the cco line crosses above its previous bar's value and the composite RSI (xxoojht) is below 50, suggesting a potential reversal from oversold conditions.
* Short Entry: Conversely, consider a short entry (selling) signal when the cco line crosses below its previous bar's value and the composite RSI (xxoojht) is above 50, suggesting a potential reversal from overbought conditions.
* Confirmation: Always combine the indicator's signals with other technical analysis tools and price action confirmation for better trade validation.
Additional Notes:
* The indicator offers a complex combination of multiple indicators. Consider testing and optimizing the parameters (EMAs, RSI periods) to suit your trading style and market conditions.
* Backtesting with historical data can help assess the indicator's effectiveness and identify potential strengths and weaknesses in different market environments.
* Remember that no single indicator is perfect, and the cco indicator should be used in conjunction with other forms of analysis to make informed trading decisions.
By understanding the logic behind this composite oscillator and its potential applications, you can incorporate it into your trading strategy to potentially identify trends, gauge market sentiment, and generate trading signals.
TrendWave VWAP Indicator with ATR-based SignalsThe TrendWave VWAP Indicator with ATR-Based Signals is a robust TradingView tool for traders who prioritize precision and adaptability. This indicator combines the Volume-Weighted Average Price (VWAP) with the Average True Range (ATR) to provide actionable entry and exit signals while dynamically filtering out sideways market conditions. Designed with flexibility in mind, the indicator offers extensive customization options to tailor signals and filtering to individual trading styles.
Key Features and Customizable Settings
VWAP Integration
VWAP offers a volume-weighted benchmark, ideal for tracking price trends in relation to average trading levels. Customization: Traders can enable or disable VWAP functionality via a toggle, allowing easy adjustments based on market conditions or strategy preferences.
ATR-Based Signal Levels
ATR provides volatility-based levels for precise entry and exit points by measuring average price range. Customization: Traders can set the ATR length (default: 14) and the multiplier (default: 1.5) for adjusting sensitivity. A sideways threshold can be set to control the ATR value at which the indicator pauses signals, helping to avoid low-volatility markets.
Signal Cooldown
To reduce noise in choppy conditions, a signal cooldown enforces a minimum number of bars between signals. Customization: The cooldown period (default: 10 bars) can be adjusted to match preferred trading frequency and discipline requirements.
Signal Logic
Long Entry: Activated when price crosses above the VWAP in a trending market. Cooldown applies to avoid consecutive signals.
Long Exit: Triggered when price crosses below the VWAP.
Short Entry: Initiated when price crosses below the VWAP, in non-sideways conditions.
Short Exit: Occurs when price crosses back above the VWAP following a short position.
Visual Indicators
The VWAP is displayed as a line on the chart for easy trend reference. Entry and exit signals are clearly marked with color-coded shapes, enhancing readability without clutter.
Practical Application
The TrendWave VWAP Indicator with ATR-Based Signals provides tailored entries and exits for trending markets. Its customization options make it suitable for traders who require flexibility and precision in varying market conditions. By adjusting VWAP, ATR, and cooldown parameters, users can fine-tune the indicator to suit different trading styles, making it an essential tool for disciplined trading in dynamic markets.

HBK Price Action Strategy HBKPrice Action Strategy for XAUUSD with a Favorable Risk-Reward Ratio
Understanding the Strategy:
This strategy leverages price action principles to identify potential entry and exit points for XAUUSD on a 5-minute timeframe. The core idea is to identify price action patterns that suggest a high probability of a particular direction, and then to set stop-loss and take-profit levels to manage risk and reward.
Key Price Action Patterns to Watch:
Pin Bar: A pin bar is a candlestick with a long wick in one direction and a small body in the opposite direction. It often signals a reversal in the current trend.
Inside Bar: An inside bar forms when the current candle's high is lower than the previous candle's high, and the current candle's low is higher than the previous candle's low. It often indicates indecision or a potential breakout.
Engulfing Pattern: An engulfing pattern occurs when the current candle completely engulfs the previous candle. A bullish engulfing pattern signals a potential uptrend, while a bearish engulfing pattern signals a potential downtrend.
Risk-Reward Ratio:
A favorable risk-reward ratio is crucial for long-term trading success. Aim for a minimum risk-reward ratio of 1:2, meaning you risk $1 to potentially gain $2.
Entry and Exit Signals:
Long Entry:
Identify a bullish pin bar or engulfing pattern.
Wait for a confirmation candle to close above the pin bar's high or the engulfing pattern's high.
Place a stop-loss below the recent swing low.
Set a take-profit target at a key resistance level or a multiple of the stop-loss distance.
Short Entry:
Identify a bearish pin bar or engulfing pattern.
Wait for a confirmation candle to close below the pin bar's low or the engulfing pattern's low.
Place a stop-loss above the recent swing high.
Set a take-profit target at a key support level or a multiple of the stop-loss distance.
Additional Tips:
Use Support and Resistance Levels: Identify key support and resistance levels to set your stop-loss and take-profit targets.
Consider Market Sentiment: Pay attention to market sentiment and news events that may impact gold prices.
Manage Risk: Always use stop-loss orders to limit potential losses.
Be Patient: Don't force trades. Wait for high-probability setups.
Practice Discipline: Stick to your trading plan and avoid impulsive decisions.
Remember:
Price action trading requires practice and patience.
Backtest your strategy on historical data to refine your approach.
Always adapt to changing market conditions.
By following these guidelines and practicing disciplined risk management, you can increase your chances of success in trading XAUUSD on a 5-minute timeframe.

XAUUSD 10-Minute StrategyThis XAUUSD 10-Minute Strategy is designed for trading Gold vs. USD on a 10-minute timeframe. By combining multiple technical indicators (MACD, RSI, Bollinger Bands, and ATR), the strategy effectively captures both trend-following and reversal opportunities, with adaptive risk management for varying market volatility. This approach balances high-probability entries with robust volatility management, making it suitable for traders seeking to optimise entries during significant price movements and reversals.
Key Components and Logic:
MACD (12, 26, 9):
Generates buy signals on MACD Line crossovers above the Signal Line and sell signals on crossovers below the Signal Line, helping to capture momentum shifts.
RSI (14):
Utilizes oversold (below 35) and overbought (above 65) levels as a secondary filter to validate entries and avoid overextended price zones.
Bollinger Bands (20, 2):
Uses upper and lower Bollinger Bands to identify potential overbought and oversold conditions, aiming to enter long trades near the lower band and short trades near the upper band.
ATR-Based Stop Loss and Take Profit:
Stop Loss and Take Profit levels are dynamically set as multiples of ATR (3x for stop loss, 5x for take profit), ensuring flexibility with market volatility to optimise exit points.
Entry & Exit Conditions:
Buy Entry: T riggered when any of the following conditions are met:
MACD Line crosses above the Signal Line
RSI is oversold
Price drops below the lower Bollinger Band
Sell Entry: Triggered when any of the following conditions are met:
MACD Line crosses below the Signal Line
RSI is overbought
Price moves above the upper Bollinger Band
Exit Strategy: Trades are closed based on opposing entry signals, with adaptive spread adjustments for realistic exit points.
Backtesting Configuration & Results:
Backtesting Period: July 21, 2024, to October 30, 2024
Symbol Info: XAUUSD, 10-minute timeframe, OANDA data source
Backtesting Capital: Initial capital of $700, with each trade set to 10 contracts (equivalent to approximately 0.1 lots based on the broker’s contract size for gold).
Users should confirm their broker's contract size for gold, as this may differ. This script uses 10 contracts for backtesting purposes, aligned with 0.1 lots on brokers offering a 100-contract specification.
Key Backtesting Performance Metrics:
Net Profit: $4,733.90 USD (676.27% increase)
Total Closed Trades: 526
Win Rate: 53.99%
Profit Factor: 1.44 (1.96 for Long trades, 1.14 for Short trades)
Max Drawdown: $819.75 USD (56.33% of equity)
Sharpe Ratio: 1.726
Average Trade: $9.00 USD (0.04% of equity per trade)
This backtest reflects realistic conditions, with a spread adjustment of 38 points and no slippage or commission applied. The settings aim to simulate typical retail trading conditions. However, please adjust the initial capital, contract size, and other settings based on your account specifics for best results.
Usage:
This strategy is tuned specifically for XAUUSD on a 10-minute timeframe, ideal for both trend-following and reversal trades. The ATR-based stop loss and take profit levels adapt dynamically to market volatility, optimising entries and exits in varied conditions. To backtest this script accurately, ensure your broker’s contract specifications for gold align with the parameters used in this strategy.

Supertrend StrategyThe Supertrend Strategy was created based on the Supertrend and Relative Strength Index (RSI) indicators, widely respected tools in technical analysis. This strategy combines these two indicators to capture market trends with precision and reliability, looking for optimizing exit levels at oversold or overbought price levels.
The Supertrend indicator identifies trend direction based on price and volatility by using the Average True Range (ATR). The ATR measures market volatility by calculating the average range between an asset’s high and low prices over a set period. It provides insight into price fluctuations, with higher ATR values indicating increased volatility and lower values suggesting stability. The Supertrend Indicator plots a line above or below the price, signaling potential buy or sell opportunities: when the price closes above the Supertrend line, an uptrend is indicated, while a close below the line suggests a downtrend. This line shifts as price movements and volatility levels change, acting as both a trailing stop loss and trend confirmation.
To enhance the Supertrend strategy, the Relative Strength Index (RSI) has been added as an exit criterion. As a momentum oscillator, the RSI indicates overbought (usually above 70) or oversold (usually below 30) conditions. This integration allows trades to close when the asset is overbought or oversold, capturing gains before a possible reversal, even if the percentage take profit level has not been reached. This mechanism aims to prevent losses due to market reversals before the Supertrend signal changes.
### Key Features
1. **Entry criteria**:
- The strategy uses the Supertrend indicator calculated by adding or subtracting a multiple of the ATR from the closing price, depending on the trend direction.
- When the price crosses above the Supertrend line, the strategy signals a long (buy) entry. Conversely, when the price crosses below, it signals a short (sell) entry.
- The strategy performs a reversal if there is an open position and a change in the direction of the supertrend occurs
2. **Exit criteria**:
- Take profit of 30% (default) on the average position price.
- Oversold (≤ 5) or overbought (≥ 95) RSI
- Reversal when there is a change in direction of the Supertrend
3. **No Repainting**:
- This strategy is not subject to repainting, as long as the timeframe configured on your chart is the same as the supertrend timeframe .
4. **Position Sizing by Equity and risk management**:
- This strategy has a default configuration to operate with 35% of the equity. At the time of opening the position, the supertrend line is typically positioned at about 12 to 16% of the entry price. This way, the strategy is putting at risk about 16% of 35% of equity, that is, around 5.6% of equity for each trade. The percentage of equity can be adjusted by the user according to their risk management.
5. **Backtest results**:
- This strategy was subjected to deep backtesting and operations in replay mode, including transaction fees of 0.12%, and slippage of 5 ticks.
- The past results in deep backtest and replay mode were compatible and profitable (Variable results depending on the take profit used, supertrend and RSI parameters). However, it should be noted that few operations were evaluated, since the currency in question has been created for a short time and the frequency of operations is relatively small.
- Past results are no guarantee of future results. The strategy's backtest results may even be due to overfitting with past data.
Default Settings
Chart timeframe: 2h
Supertrend Factor: 3.42
ATR period: 14
Supertrend timeframe: 2 h
RSI timeframe: 15 min
RSI Lenght: 5 min
RSI Upper limit: 95
RSI Lower Limit: 5
Take Profit: 30%
BYBIT:1000000MOGUSDT.P

G-Channel with EMA StrategyThe G-Channel is a custom channel with an upper (a), lower (b), and average (avg) line. These lines are dynamically calculated based on the current and previous closing prices, using the length input (default 100) to smooth the values:
Upper Line (a): This is the maximum value of the current price or the previous upper value, adjusted by the difference between the upper and lower lines divided by the length.
Lower Line (b): This is the minimum value of the current price or the previous lower value, similarly adjusted by the difference between the upper and lower lines.
The average line (avg) is simply the midpoint between the upper and lower lines. The G-Channel signals trend direction:
Bullish Condition: The system looks for the condition when the price crosses over the lower line (b), indicating a potential upward trend.
Bearish Condition: When the price crosses under the upper line (a), it signals a potential downward trend.
Exponential Moving Average (EMA)
The strategy also incorporates an EMA with a default length of 200. The EMA serves as a trend filter to determine whether the market is trending upward or downward:
Price below EMA: Indicates a bearish trend.
Price above EMA: Indicates a bullish trend.
Buy/Sell Conditions
The strategy generates buy or sell signals based on the interaction between the G-Channel signals and the price relative to the EMA:
Buy Signal: The strategy triggers a buy when:
A bullish condition (recent crossover of price over the lower G-Channel line) is detected.
The price is below the EMA, indicating that despite the recent bullish signal, the market might still be undervalued or in a temporary downturn.
Sell Signal: The strategy triggers a sell when:
A bearish condition (recent crossunder of price below the upper G-Channel line) is detected.
The price is above the EMA, suggesting that the market might be overextended and poised for a downturn.
Visualization
The strategy plots:
The upper, lower, and average lines of the G-Channel, with the average line colored based on bullish (green) or bearish (red) conditions.
The EMA (orange) line to provide context on the general trend direction.
Markers for Buy and Sell signals to visually indicate the strategy's entry points.
Strategy Execution
When a buy or sell signal is detected:
Buy Entry: If the bullish condition and price < EMA condition are met, a long (buy) position is opened.
Sell Entry: If the bearish condition and price > EMA condition are met, a short (sell) position is opened.
Purpose
This strategy aims to catch price reversals at critical points (when the price moves through the G-Channel) while filtering trades using the EMA to avoid entering during unfavorable market trends.

VIDYA ProTrend Multi-Tier ProfitHello! This time is about a trend-following system.
VIDYA is quite an interesting indicator that adjusts dynamically to market volatility, making it more responsive to price changes compared to traditional moving averages. Balancing adaptability and precision, especially with the more aggressive short trade settings, challenged me to fine-tune the strategy for a variety of market conditions.
█ Introduction and How it is Different
The "VIDYA ProTrend Multi-Tier Profit" strategy is a trend-following system that combines the VIDYA (Variable Index Dynamic Average) indicator with Bollinger Bands and a multi-step take-profit mechanism.
Unlike traditional trend strategies, this system allows for more adaptive profit-taking, adjusting for long and short positions through distinct ATR-based and percentage-based targets. The innovation lies in its dynamic multi-tier approach to profit-taking, especially for short trades, where more aggressive percentages are applied using a multiplier. This flexibility helps adapt to various market conditions by optimizing trade management and profit allocation based on market volatility and trend strength.
BTCUSD 6hr performance
█ Strategy, How it Works: Detailed Explanation
The core of the "VIDYA ProTrend Multi-Tier Profit" strategy lies in the dual VIDYA indicators (fast and slow) that analyze price trends while accounting for market volatility. These indicators work alongside Bollinger Bands to filter trade entries and exits.
🔶 VIDYA Calculation
The VIDYA indicator is calculated using the following formula:
Smoothing factor (𝛼):
alpha = 2 / (Length + 1)
VIDYA formula:
VIDYA(t) = alpha * k * Price(t) + (1 - alpha * k) * VIDYA(t-1)
Where:
k = |Chande Momentum Oscillator (MO)| / 100
🔶 Bollinger Bands as a Volatility Filter
Bollinger Bands are calculated using a rolling mean and standard deviation of price over a specified period:
Upper Band:
BB_upper = MA + (K * stddev)
Lower Band:
BB_lower = MA - (K * stddev)
Where:
MA is the moving average,
K is the multiplier (typically 2), and
stddev is the standard deviation of price over the Bollinger Bands length.
These bands serve as volatility filters to identify potential overbought or oversold conditions, aiding in the entry and exit logic.
🔶 Slope Calculation for VIDYA
The slopes of both fast and slow VIDYAs are computed to assess the momentum and direction of the trend. The slope for a given VIDYA over its length is:
Slope = (VIDYA(t) - VIDYA(t-n)) / n
Where:
n is the length of the lookback period. Positive slope indicates bullish momentum, while negative slope signals bearish momentum.
LOCAL picture
🔶 Entry and Exit Conditions
- Long Entry: Occurs when the price moves above the slow VIDYA and the fast VIDYA is trending upward. Bollinger Bands confirm the signal when the price crosses the upper band, indicating bullish strength.
- Short Entry: Happens when the price drops below the slow VIDYA and the fast VIDYA trends downward. The signal is confirmed when the price crosses the lower Bollinger Band, showing bearish momentum.
- Exit: Based on VIDYA slopes flattening or reversing, or when the price hits specific ATR or percentage-based profit targets.
🔶 Multi-Step Take Profit Mechanism
The strategy incorporates three levels of take profit for both long and short trades:
- ATR-based Take Profit: Each step applies a multiple of the ATR (Average True Range) to the entry price to define the exit point.
The first level of take profit (long):
TP_ATR1_long = Entry Price + (2.618 * ATR)
etc.
█ Trade Direction
The strategy offers flexibility in defining the trading direction:
- Long: Only long trades are considered based on the criteria for upward trends.
- Short: Only short trades are initiated in bearish trends.
- Both: The strategy can take both long and short trades depending on the market conditions.
█ Usage
To use the strategy effectively:
- Adjust the VIDYA lengths (fast and slow) based on your preference for trend sensitivity.
- Use Bollinger Bands as a filter for identifying potential breakout or reversal scenarios.
- Enable the multi-step take profit feature to manage positions dynamically, allowing for partial exits as the price reaches specified ATR or percentage levels.
- Leverage the short trade multiplier for more aggressive take profit levels in bearish markets.
This strategy can be applied to different asset classes, including equities, forex, and cryptocurrencies. Adjust the input parameters to suit the volatility and characteristics of the asset being traded.
█ Default Settings
The default settings for this strategy have been designed for moderate to trending markets:
- Fast VIDYA Length (10): A shorter length for quick responsiveness to price changes. Increasing this length will reduce noise but may delay signals.
- Slow VIDYA Length (30): The slow VIDYA is set longer to capture broader market trends. Shortening this value will make the system more reactive to smaller price swings.
- Minimum Slope Threshold (0.05): This threshold helps filter out weak trends. Lowering the threshold will result in more trades, while raising it will restrict trades to stronger trends.
Multi-Step Take Profit Settings
- ATR Multipliers (2.618, 5.0, 10.0): These values define how far the price should move before taking profit. Larger multipliers widen the profit-taking levels, aiming for larger trend moves. In higher volatility markets, these values might be adjusted downwards.
- Percentage Levels (3%, 8%, 17%): These percentage levels define how much the price must move before taking profit. Increasing the percentages will capture larger moves, while smaller percentages offer quicker exits.
- Short TP Multiplier (1.5): This multiplier applies more aggressive take profit levels for short trades. Adjust this value based on the aggressiveness of your short trade management.
Each of these settings directly impacts the performance and risk profile of the strategy. Shorter VIDYA lengths and lower slope thresholds will generate more trades but may result in more whipsaws. Higher ATR multipliers or percentage levels can delay profit-taking, aiming for larger trends but risking partial gains if the trend reverses too early.

E9 Shark-32 Pattern Strategy The E9 Shark-32 Pattern is a powerful trading tool designed to capitalize on the Shark-32 pattern—a specific Candlestick pattern.
The Shark-32 Pattern: What Is It?
The Shark-32 pattern is a technical formation that occurs when the following conditions are met:
Higher Highs and Lower Lows: The low of two bars ago is lower than the previous bar, and the previous bar's low is lower than the current bar. At the same time, the high of two bars ago is higher than the previous bar, and the previous bar’s high is higher than the current bar.
This unique setup forms the "Shark-32" pattern, which signals potential volume squeezes and trend changes in the market.
How Does the Strategy Work?
The E9 Shark-32 Pattern Strategy builds upon this pattern by defining clear entry and exit rules based on the pattern's confirmation. Here's a breakdown of how the strategy operates:
1. Identifying the Shark-32 Pattern
When the Shark-32 pattern is confirmed, the strategy "locks" the high and low prices from the initial bar of the pattern. These locked prices serve as key levels for future trade entries and exits.
2. Entry Conditions
The strategy waits for the price to cross the pattern's locked high or low, signaling potential market direction.
Long Entry: A long trade is triggered when the closing price crosses above the locked pattern high (green line).
Short Entry: A short trade is triggered when the closing price crosses below the locked pattern low (red line).
The strategy ensures that only one trade is taken for each Shark-32 pattern, preventing overtrading and allowing traders to focus on high-probability setups.
3. Stop Loss and Take Profit Levels
The strategy has built-in risk management through stop-loss and take-profit levels, which are visually represented by the lines on the chart:
Stop Loss:
Stop loss can be adjusted in settings.
Take Profit:
For long trades: The take-profit target is set at the upper white dotted line, which is projected above the pattern high.
For short trades: The take-profit target is set at the lower white dotted line, which is projected below the pattern low.
These clearly defined levels help traders to manage risk effectively while maximizing potential returns.
4. Visual Cues
To make trading decisions even easier, the strategy provides helpful visual cues:
Green Line (Pattern High): This line represents the high of the Shark-32 pattern and serves as a resistance level and short entry signal.
Red Line (Pattern Low): This line represents the low of the Shark-32 pattern and serves as a support level and long entry signal.
White Dotted Lines: These lines represent potential profit targets, projected both above and below the pattern. They help traders define where the market might go next.
Additionally, the strategy highlights the pattern formation with color-coded bars and background shading to draw attention to the Shark-32 pattern when it is confirmed. This adds a layer of visual confirmation, making it easier to spot opportunities in real-time.
5. No Repeated Trades
An important aspect of the strategy is that once a trade is taken (either long or short), no additional trades are executed until a new Shark-32 pattern is identified. This ensures that only valid and confirmed setups are acted upon.

Bitcoin CME-Spot Z-Spread - Strategy [presentTrading]This time is a swing trading strategy! It measures the sentiment of the Bitcoin market through the spread of CME Bitcoin Futures and Bitfinex BTCUSD Spot prices. By applying Bollinger Bands to the spread, the strategy seeks to capture mean-reversion opportunities when prices deviate significantly from their historical norms
█ Introduction and How it is Different
The Bitcoin CME-Spot Bollinger Bands Strategy is designed to capture mean-reversion opportunities by exploiting the spread between CME Bitcoin Futures and Bitfinex BTCUSD Spot prices. The strategy uses Bollinger Bands to detect when the spread between these two correlated assets has deviated significantly from its historical norm, signaling potential overbought or oversold conditions.
What sets this strategy apart is its focus on spread trading between futures and spot markets rather than price-based indicators. By applying Bollinger Bands to the spread rather than individual prices, the strategy identifies price inefficiencies across markets, allowing traders to take advantage of the natural reversion to the mean that often occurs in these correlated assets.
BTCUSD 8hr Performance
█ Strategy, How It Works: Detailed Explanation
The strategy relies on Bollinger Bands to assess the volatility and relative deviation of the spread between CME Bitcoin Futures and Bitfinex BTCUSD Spot prices. Bollinger Bands consist of a moving average and two standard deviation bands, which help measure how much the spread deviates from its historical mean.
🔶 Spread Calculation:
The spread is calculated by subtracting the Bitfinex spot price from the CME Bitcoin futures price:
Spread = CME Price - Bitfinex Price
This spread represents the difference between the futures and spot markets, which may widen or narrow based on supply and demand dynamics in each market. By analyzing the spread, the strategy can detect when prices are too far apart (potentially overbought or oversold), indicating a trading opportunity.
🔶 Bollinger Bands Calculation:
The Bollinger Bands for the spread are calculated using a simple moving average (SMA) and the standard deviation of the spread over a defined period.
1. Moving Average (SMA):
The simple moving average of the spread (mu_S) over a specified period P is calculated as:
mu_S = (1/P) * sum(S_i from i=1 to P)
Where S_i represents the spread at time i, and P is the lookback period (default is 200 bars). The moving average provides a baseline for the normal spread behavior.
2. Standard Deviation:
The standard deviation (sigma_S) of the spread is calculated to measure the volatility of the spread:
sigma_S = sqrt((1/P) * sum((S_i - mu_S)^2 from i=1 to P))
3. Upper and Lower Bollinger Bands:
The upper and lower Bollinger Bands are derived by adding and subtracting a multiple of the standard deviation from the moving average. The number of standard deviations is determined by a user-defined parameter k (default is 2.618).
- Upper Band:
Upper Band = mu_S + (k * sigma_S)
- Lower Band:
Lower Band = mu_S - (k * sigma_S)
These bands provide a dynamic range within which the spread typically fluctuates. When the spread moves outside of these bands, it is considered overbought or oversold, potentially offering trading opportunities.
Local view
🔶 Entry Conditions:
- Long Entry: A long position is triggered when the spread crosses below the lower Bollinger Band, indicating that the spread has become oversold and is likely to revert upward.
Spread < Lower Band
- Short Entry: A short position is triggered when the spread crosses above the upper Bollinger Band, indicating that the spread has become overbought and is likely to revert downward.
Spread > Upper Band
🔶 Risk Management and Profit-Taking:
The strategy incorporates multi-step take profits to lock in gains as the trade moves in favor. The position is gradually reduced at predefined profit levels, reducing risk while allowing part of the trade to continue running if the price keeps moving favorably.
Additionally, the strategy uses a hold period exit mechanism. If the trade does not hit any of the take-profit levels within a certain number of bars, the position is closed automatically to avoid excessive exposure to market risks.
█ Trade Direction
The trade direction is based on deviations of the spread from its historical norm:
- Long Trade: The strategy enters a long position when the spread crosses below the lower Bollinger Band, signaling an oversold condition where the spread is expected to narrow.
- Short Trade: The strategy enters a short position when the spread crosses above the upper Bollinger Band, signaling an overbought condition where the spread is expected to widen.
These entries rely on the assumption of mean reversion, where extreme deviations from the average spread are likely to revert over time.
█ Usage
The Bitcoin CME-Spot Bollinger Bands Strategy is ideal for traders looking to capitalize on price inefficiencies between Bitcoin futures and spot markets. It’s especially useful in volatile markets where large deviations between futures and spot prices occur.
- Market Conditions: This strategy is most effective in correlated markets, like CME futures and spot Bitcoin. Traders can adjust the Bollinger Bands period and standard deviation multiplier to suit different volatility regimes.
- Backtesting: Before deployment, backtesting the strategy across different market conditions and timeframes is recommended to ensure robustness. Adjust the take-profit steps and hold periods to reflect the trader’s risk tolerance and market behavior.
█ Default Settings
The default settings provide a balanced approach to spread trading using Bollinger Bands but can be adjusted depending on market conditions or personal trading preferences.
🔶 Bollinger Bands Period (200 bars):
This defines the number of bars used to calculate the moving average and standard deviation for the Bollinger Bands. A longer period smooths out short-term fluctuations and focuses on larger, more significant trends. Adjusting the period affects the responsiveness of the strategy:
- Shorter periods (e.g., 100 bars): Makes the strategy more reactive to short-term market fluctuations, potentially generating more signals but increasing the risk of false positives.
- Longer periods (e.g., 300 bars): Focuses on longer-term trends, reducing the frequency of trades and focusing only on significant deviations.
🔶 Standard Deviation Multiplier (2.618):
The multiplier controls how wide the Bollinger Bands are around the moving average. By default, the bands are set at 2.618 standard deviations away from the average, ensuring that only significant deviations trigger trades.
- Higher multipliers (e.g., 3.0): Require a more extreme deviation to trigger trades, reducing trade frequency but potentially increasing the accuracy of signals.
- Lower multipliers (e.g., 2.0): Make the bands narrower, increasing the number of trade signals but potentially decreasing their reliability.
🔶 Take-Profit Levels:
The strategy has four take-profit levels to gradually lock in profits:
- Level 1 (3%): 25% of the position is closed at a 3% profit.
- Level 2 (8%): 20% of the position is closed at an 8% profit.
- Level 3 (14%): 15% of the position is closed at a 14% profit.
- Level 4 (21%): 10% of the position is closed at a 21% profit.
Adjusting these take-profit levels affects how quickly profits are realized:
- Lower take-profit levels: Capture gains more quickly, reducing risk but potentially cutting off larger profits.
- Higher take-profit levels: Let trades run longer, aiming for bigger gains but increasing the risk of price reversals before profits are locked in.
🔶 Hold Days (20 bars):
The strategy automatically closes the position after 20 bars if none of the take-profit levels are hit. This feature prevents trades from being held indefinitely, especially if market conditions are stagnant. Adjusting this:
- Shorter hold periods: Reduce the duration of exposure, minimizing risks from market changes but potentially closing trades too early.
- Longer hold periods: Allow trades to stay open longer, increasing the chance for mean reversion but also increasing exposure to unfavorable market conditions.
By understanding how these default settings affect the strategy’s performance, traders can optimize the Bitcoin CME-Spot Bollinger Bands Strategy to their preferences, adapting it to different market environments and risk tolerances.

Multi-Step FlexiMA - Strategy [presentTrading]It's time to come back! hope I can not to be busy for a while.
█ Introduction and How It Is Different
The FlexiMA Variance Tracker is a unique trading strategy that calculates a series of deviations between the price (or another indicator source) and a variable-length moving average (MA). Unlike traditional strategies that use fixed-length moving averages, the length of the MA in this system varies within a defined range. The length changes dynamically based on a starting factor and an increment factor, creating a more adaptive approach to market conditions.
This strategy integrates Multi-Step Take Profit (TP) levels, allowing for partial exits at predefined price increments. It enables traders to secure profits at different stages of a trend, making it ideal for volatile markets where taking full profits at once might lead to missed opportunities if the trend continues.
BTCUSD 6hr Performance
█ Strategy, How It Works: Detailed Explanation
🔶 FlexiMA Concept
The FlexiMA (Flexible Moving Average) is at the heart of this strategy. Unlike traditional MA-based strategies where the MA length is fixed (e.g., a 50-period SMA), the FlexiMA varies its length with each iteration. This is done using a **starting factor** and an **increment factor**.
The formula for the moving average length at each iteration \(i\) is:
`MA_length_i = indicator_length * (starting_factor + i * increment_factor)`
Where:
- `indicator_length` is the user-defined base length.
- `starting_factor` is the initial multiplier of the base length.
- `increment_factor` increases the multiplier in each iteration.
Each iteration applies a **simple moving average** (SMA) to the chosen **indicator source** (e.g., HLC3) with a different length based on the above formula. The deviation between the current price and the moving average is then calculated as follows:
`deviation_i = price_current - MA_i`
These deviations are normalized using one of the following methods:
- **Max-Min normalization**:
`normalized_i = (deviation_i - min(deviations)) / range(deviations)`
- **Absolute Sum normalization**:
`normalized_i = deviation_i / sum(|deviation_i|)`
The **median** and **standard deviation (stdev)** of the normalized deviations are then calculated as follows:
`median = median(normalized deviations)`
For the standard deviation:
`stdev = sqrt((1/(N-1)) * sum((normalized_i - mean)^2))`
These values are plotted to provide a clear indication of how the price is deviating from its variable-length moving averages.
For more detail:
🔶 Multi-Step Take Profit
This strategy uses a multi-step take profit system, allowing for exits at different stages of a trade based on the percentage of price movement. Three take-profit levels are defined:
- Take Profit Level 1 (TP1): A small, quick profit level (e.g., 2%).
- Take Profit Level 2 (TP2): A medium-level profit target (e.g., 8%).
- Take Profit Level 3 (TP3): A larger, more ambitious target (e.g., 18%).
At each level, a corresponding percentage of the trade is exited:
- TP Percent 1: E.g., 30% of the position.
- TP Percent 2: E.g., 20% of the position.
- TP Percent 3: E.g., 15% of the position.
This approach ensures that profits are locked in progressively, reducing the risk of market reversals wiping out potential gains.
Local
🔶 Trade Entry and Exit Conditions
The entry and exit signals are determined by the interaction between the **SuperTrend Polyfactor Oscillator** and the **median** value of the normalized deviations:
- Long entry: The SuperTrend turns bearish, and the median value of the deviations is positive.
- Short entry: The SuperTrend turns bullish, and the median value is negative.
Similarly, trades are exited when the SuperTrend flips direction.
* The SuperTrend Toolkit is made by @EliCobra
█ Trade Direction
The strategy allows users to specify the desired trade direction:
- Long: Only long positions will be taken.
- Short: Only short positions will be taken.
- Both: Both long and short positions are allowed based on the conditions.
This flexibility allows the strategy to adapt to different market conditions and trading styles, whether you're looking to buy low and sell high, or sell high and buy low.
█ Usage
This strategy can be applied across various asset classes, including stocks, cryptocurrencies, and forex. The primary use case is to take advantage of market volatility by using a flexible moving average and multiple take-profit levels to capture profits incrementally as the market moves in your favor.
How to Use:
1. Configure the Inputs: Start by adjusting the **Indicator Length**, **Starting Factor**, and **Increment Factor** to suit your chosen asset. The defaults work well for most markets, but fine-tuning them can improve performance.
2. Set the Take Profit Levels: Adjust the three **TP levels** and their corresponding **percentages** based on your risk tolerance and the expected volatility of the market.
3. Monitor the Strategy: The SuperTrend and the FlexiMA variance tracker will provide entry and exit signals, automatically managing the positions and taking profits at the pre-set levels.
█ Default Settings
The default settings for the strategy are configured to provide a balanced approach that works across different market conditions:
Indicator Length (10):
This controls the base length for the moving average. A lower length makes the moving average more responsive to price changes, while a higher length smooths out fluctuations, making the strategy less sensitive to short-term price movements.
Starting Factor (1.0):
This determines the initial multiplier applied to the moving average length. A higher starting factor will increase the average length, making it slower to react to price changes.
Increment Factor (1.0):
This increases the moving average length in each iteration. A larger increment factor creates a wider range of moving average lengths, allowing the strategy to track both short-term and long-term trends simultaneously.
Normalization Method ('None'):
Three methods of normalization can be applied to the deviations:
- None: No normalization applied, using raw deviations.
- Max-Min: Normalizes based on the range between the maximum and minimum deviations.
- Absolute Sum: Normalizes based on the total sum of absolute deviations.
Take Profit Levels:
- TP1 (2%): A quick exit to capture small price movements.
- TP2 (8%): A medium-term profit target for stronger trends.
- TP3 (18%): A long-term target for strong price moves.
Take Profit Percentages:
- TP Percent 1 (30%): Exits 30% of the position at TP1.
- TP Percent 2 (20%): Exits 20% of the position at TP2.
- TP Percent 3 (15%): Exits 15% of the position at TP3.
Effect of Variables on Performance:
- Short Indicator Lengths: More responsive to price changes but prone to false signals.
- Higher Starting Factor: Slows down the response, useful for longer-term trend following.
- Higher Increment Factor: Widens the variability in moving average lengths, making the strategy adapt to both short-term and long-term price trends.
- Aggressive Take Profit Levels: Allows for quick profit-taking in volatile markets but may exit positions prematurely in strong trends.
The default configuration offers a moderate balance between short-term responsiveness and long-term trend capturing, suitable for most traders. However, users can adjust these variables to optimize performance based on market conditions and personal preferences.

RSI ProfitGuard [CHE]The RSI ProfitGuard Indicator is a comprehensive tool designed to assist traders in making informed decisions by integrating the Relative Strength Index (RSI) with automated Take Profit (TP) and Stop Loss (SL) levels. This indicator enhances trading strategies by providing clear entry signals and risk management parameters.
Key Features
RSIBased Signals: Utilizes RSI crossovers and crossunders to generate trade signals.
Automated TP and SL: Automatically calculates and plots Take Profit and Stop Loss levels based on userdefined methods.
Customizable Trade Types: Supports Long trades, Short trades, or both simultaneously.
Flexible Calculation Methods: Choose between Percentagebased or ATRbased methods for determining TP and SL levels.
Visual Enhancements: Highlights overbought and oversold RSI regions with background colors and marks trade entries with arrows.
Alerts: Provides realtime alerts when TP or SL levels are reached, ensuring timely trade management.
How It Works
1. RSI Calculation: The indicator calculates the RSI value based on the specified length.
2. Trade Signals:
Long Entry: Triggered when RSI crosses above the defined crossover threshold.
Short Entry: Triggered when RSI crosses below the defined crossunder threshold.
3. TP/SL Level Determination:
Percentage Method: Sets TP and SL as a percentage above and below the entry price.
ATR Method: Sets TP and SL based on the Average True Range (ATR), allowing for dynamic adjustments based on market volatility.
4. Visualization: Draws lines and labels on the chart to indicate TP, SL, and entry points.
5. Trade Management: Monitors price movements to determine if TP or SL levels are hit, automatically managing the trade state.
Customization Options
Trade Type Selection: Choose to execute Long trades, Short trades, or both.
RSI Settings:
RSI Length: Defines the period for RSI calculation (default is 14).
Crossover Threshold: RSI level above which a Long entry is signaled (default is 65).
Crossunder Threshold: RSI level below which a Short entry is signaled (default is 35).
Delay Settings: Sets the minimum number of bars between consecutive trade signals to avoid overtrading.
TP/SL Settings:
Method Selection: Choose between Percentage or ATRbased calculations.
Percentage Values: Define the percentage for TP and SL levels.
ATR Settings: Define ATR length and multipliers for TP and SL when using the ATR method.
Visual Settings:
Line Colors and Styles: Customize the appearance of TP, SL, crossover, and crossunder lines.
Transparency: Adjust the transparency of lines for better chart visibility.
Label Offset: Position labels at a specified number of bars to the right for clarity.
Using the Indicator
1. Add to Chart: Apply the RSI ProfitGuard Indicator to your TradingView chart.
2. Configure Settings: Adjust the parameters according to your trading strategy and risk tolerance.
3. Interpret Signals:
Long Entries: Look for green upward arrows indicating potential buy opportunities.
Short Entries: Look for red downward arrows indicating potential sell opportunities.
4. Monitor TP and SL Levels: Observe the plotted lines and labels to manage your trades effectively.
5. Set Up Alerts: Enable alerts to receive notifications when TP or SL levels are reached, ensuring you can act promptly.
Benefits
Enhanced DecisionMaking: Combines RSI signals with clear risk management levels.
Time Efficiency: Automates the calculation and plotting of TP and SL, saving time and reducing manual errors.
Flexibility: Adapts to various trading styles and market conditions through customizable settings.
Risk Management: Helps in defining and adhering to risk parameters, essential for longterm trading success.
Conclusion
The RSI ProfitGuard Indicator is an invaluable tool for traders seeking to integrate technical analysis with automated risk management. Its customizable features and realtime alerts provide a robust framework for executing and managing trades with confidence.
Disclaimer
The content provided with our RSI ProfitGuard Indicator, including all code, scripts, lessons, and materials, is strictly for educational and informational purposes only. It is not intended as, and should not be interpreted as, financial advice, a recommendation to buy or sell, or an offer of any financial product or service.
Key Points:
Educational Purpose:
All strategies, tools, and examples included within the RSI ProfitGuard Indicator are provided solely for illustrative purposes. They are designed to demonstrate coding techniques and the functionality of Pine Script within a trading context.
No Financial Advice:
The RSI ProfitGuard Indicator does not constitute financial advice. Users should not rely on it as a basis for making investment or trading decisions.
Hypothetical Results:
Any results or performance metrics derived from using the RSI ProfitGuard Indicator are purely hypothetical. Past performance is not indicative of future results, and there is no guarantee of profitability.
Risk Disclosure:
Trading and investing involve significant risks, including the potential loss of principal. The RSI ProfitGuard Indicator is not suitable for all persons, and users should be aware of the inherent risks involved in trading.
Professional Consultation:
Before making any trading decisions, it is strongly recommended to consult with a qualified financial professional to fully understand the risks and ensure that such decisions align with your financial situation and goals.
User Responsibility:
By using the RSI ProfitGuard Indicator, you acknowledge and agree that all trading decisions are made solely at your own discretion and risk. The developers and providers of the RSI ProfitGuard Indicator assume no responsibility or liability for any losses or damages resulting from its use.
Additional Notes:
No Guarantees:
There are no guarantees regarding the accuracy, reliability, or completeness of the RSI ProfitGuard Indicator. Users utilize the tool at their own risk.
No Endorsement:
Any mention of third-party products, services, or strategies within the RSI ProfitGuard Indicator does not constitute an endorsement or recommendation.
Updates and Modifications:
The RSI ProfitGuard Indicator may be updated or modified over time. Users are responsible for staying informed about any changes and understanding how they may impact the use of the tool.
Summary
This disclaimer clearly states that the RSI ProfitGuard Indicator is intended for educational purposes and should not be used as financial advice. It highlights the risks associated with trading, the hypothetical nature of any results, and the importance of consulting with a financial professional. Additionally, it emphasizes that users are solely responsible for their trading decisions and any outcomes that result from using the indicator.
Tips for Implementation:
Visibility:
Ensure that this disclaimer is prominently displayed wherever the RSI ProfitGuard Indicator is offered, such as on your website, within the TradingView description, or in any accompanying documentation.
Clarity:
Use clear and concise language to make sure that all users understand the limitations and responsibilities associated with using the indicator.
Legal Review:
Consider having the disclaimer reviewed by a legal professional to ensure that it meets all necessary legal requirements and adequately protects your interests.
Regular Updates:
Periodically review and update the disclaimer to reflect any changes in the indicator's functionality or in relevant laws and regulations.

ETH Signal 15m
This strategy uses the Supertrend indicator combined with RSI to generate buy and sell signals, with stop loss (SL) and take profit (TP) conditions based on ATR (Average True Range). Below is a detailed explanation of each part:
1. General Information BINANCE:ETHUSDT.P
Strategy Name: "ETH Signal 15m"
Designed for use on the 15-minute time frame for the ETH pair.
Default capital allocation is 15% of total equity for each trade.
2. Backtest Period
start_time and end_time: Define the start and end time of the backtest period.
start_time = 2024-08-01: Start date of the backtest.
end_time = 2054-01-01: End date of the backtest.
The strategy will only run when the current time falls within this specified range.
3. Supertrend Indicator
Supertrend is a trend-following indicator that provides buy or sell signals based on the direction of price changes.
factor = 2.76: The multiplier used in the Supertrend calculation (increasing this value makes the Supertrend less sensitive to price movements).
atrPeriod = 12: Number of periods used to calculate ATR.
Output:
direction: Determines the buy/sell direction based on Supertrend.
If direction decreases, it signals a buy (Long).
If direction increases, it signals a sell (Short).
4. RSI Indicator
RSI (Relative Strength Index) is a momentum indicator, often used to identify overbought or oversold conditions.
rsiLength = 12: Number of periods used to calculate RSI.
rsiOverbought = 70: RSI level considered overbought.
rsiOversold = 30: RSI level considered oversold.
5. Entry Conditions
Long Entry:
Supertrend gives a buy signal (ta.change(direction) < 0).
RSI must be below the overbought level (rsi < rsiOverbought).
Short Entry:
Supertrend gives a sell signal (ta.change(direction) > 0).
RSI must be above the oversold level (rsi > rsiOversold).
The strategy will only execute trades if the current time is within the backtest period (in_date_range).
6. Stop Loss (SL) and Take Profit (TP) Conditions
ATR (Average True Range) is used to calculate the distance for Stop Loss and Take Profit based on price volatility.
atr = ta.atr(atrPeriod): ATR is calculated using 12 periods.
Stop Loss and Take Profit are calculated as follows:
Long Trade:
Stop Loss: Set at close - 4 * atr (current price minus 4 times the ATR).
Take Profit: Set at close + 2 * atr (current price plus 2 times the ATR).
Short Trade:
Stop Loss: Set at close + 4 * atr (current price plus 4 times the ATR).
Take Profit: Set at close - 2.237 * atr (current price minus 2.237 times the ATR).
Summary:
This strategy enters a Long trade when the Supertrend indicates an upward trend and RSI is not in the overbought region. Conversely, a Short trade is entered when Supertrend signals a downtrend, and RSI is not oversold.
The trade is exited when the price reaches the Stop Loss or Take Profit levels, which are determined based on price volatility (ATR).
Disclaimer:
The content provided in this strategy is for informational and educational purposes only. It is not intended as financial, investment, or trading advice. Trading in cryptocurrency, stocks, or any financial markets involves significant risk, and you may lose more than your initial investment. Past performance is not indicative of future results, and no guarantee of profit can be made. You should consult with a professional financial advisor before making any investment decisions. The creator of this strategy is not responsible for any financial losses or damages incurred as a result of following this strategy. All trades are executed at your own risk.

TPS Short Strategy by Larry ConnersThe TPS Short strategy aims to capitalize on extreme overbought conditions in an ETF by employing a scaling-in approach when certain technical indicators signal potential reversals. The strategy is designed to short the ETF when it is deemed overextended, based on the Relative Strength Index (RSI) and moving averages.
Components:
200-Day Simple Moving Average (SMA):
Purpose: Acts as a long-term trend filter. The ETF must be below its 200-day SMA to be eligible for shorting.
Rationale: The 200-day SMA is widely used to gauge the long-term trend of a security. When the price is below this moving average, it is often considered to be in a downtrend (Tushar S. Chande & Stanley Kroll, "The New Technical Trader: Boost Your Profit by Plugging Into the Latest Indicators").
2-Period RSI:
Purpose: Measures the speed and change of price movements to identify overbought conditions.
Criteria: Short 10% of the position when the 2-period RSI is above 75 for two consecutive days.
Rationale: A high RSI value (above 75) indicates that the ETF may be overbought, which could precede a price reversal (J. Welles Wilder, "New Concepts in Technical Trading Systems").
Scaling-In Mechanism:
Purpose: Gradually increase the short position as the ETF price rises beyond previous entry points.
Scaling Strategy:
20% more when the price is higher than the first entry.
30% more when the price is higher than the second entry.
40% more when the price is higher than the third entry.
Rationale: This incremental approach allows for an increased position size in a worsening trend, potentially increasing profitability if the trend continues to align with the strategy’s premise (Marty Schwartz, "Pit Bull: Lessons from Wall Street's Champion Day Trader").
Exit Conditions:
Criteria: Close all positions when the 2-period RSI drops below 30 or the 10-day SMA crosses above the 30-day SMA.
Rationale: A low RSI value (below 30) suggests that the ETF may be oversold and could be poised for a rebound, while the SMA crossover indicates a potential change in the trend (Martin J. Pring, "Technical Analysis Explained").
Risks and Considerations:
Market Risk:
The strategy assumes that the ETF will continue to decline once shorted. However, markets can be unpredictable, and price movements might not align with the strategy's expectations, especially in a volatile market (Nassim Nicholas Taleb, "The Black Swan: The Impact of the Highly Improbable").
Scaling Risks:
Scaling into a position as the price increases may increase exposure to adverse price movements. This method can amplify losses if the market moves against the position significantly before any reversal occurs.
Liquidity Risk:
Depending on the ETF’s liquidity, executing large trades in increments might affect the price and increase trading costs. It is crucial to ensure that the ETF has sufficient liquidity to handle large trades without significant slippage (James Altucher, "Trade Like a Hedge Fund").
Execution Risk:
The strategy relies on timely execution of trades based on specific conditions. Delays or errors in order execution can impact performance, especially in fast-moving markets.
Technical Indicator Limitations:
Technical indicators like RSI and SMA are based on historical data and may not always predict future price movements accurately. They can sometimes produce false signals, leading to potential losses if used in isolation (John Murphy, "Technical Analysis of the Financial Markets").
Conclusion
The TPS Short strategy utilizes a combination of long-term trend filtering, overbought conditions, and incremental shorting to potentially profit from price reversals. While the strategy has a structured approach and leverages well-known technical indicators, it is essential to be aware of the inherent risks, including market volatility, liquidity issues, and potential limitations of technical indicators. As with any trading strategy, thorough backtesting and risk management are crucial to its successful implementation.

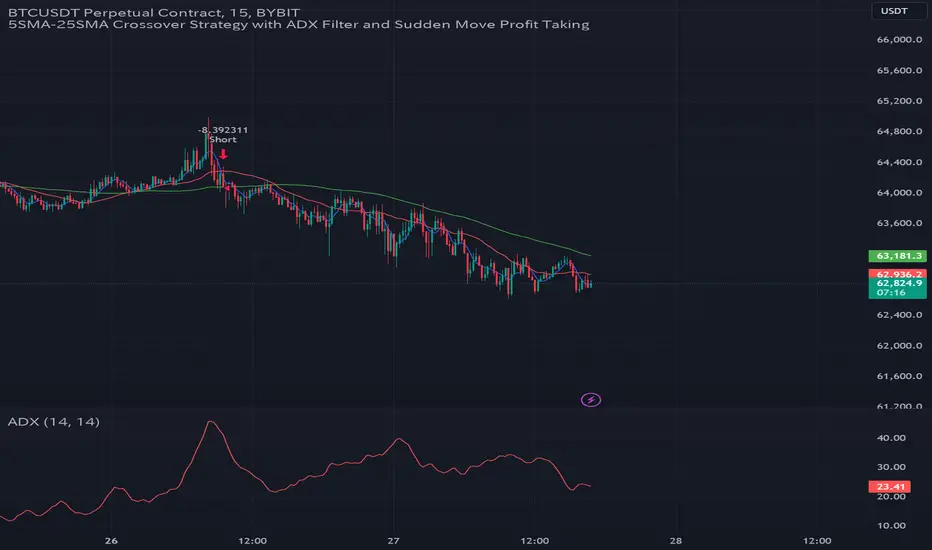
GC Strategy with Trend Filter and Sudden Move Profit TakingBYBIT:BTCUSDT.P 15M
Situation Assessment with Three Moving Averages
The strategy uses the crossover of the 5SMA and 25SMA as entry signals.
Additionally, the 75SMA is used as a filter. Long entries are only allowed when the price is above the 75SMA, and short entries are only allowed when the price is below the 75SMA.
ADX Filter
The Average Directional Index (ADX) is used to check the strength of the trend. Entry signals are only activated when the ADX is above 20. This ensures that trades are only executed when the trend is strong.
Sudden Move Detection
The strategy detects sudden price movements. If a sudden move occurs, the position is closed to lock in profits.
Entry
Long Entry: When the 5SMA crosses above the 25SMA, the price is above the 75SMA, and the ADX is above 20.
Short Entry: When the 5SMA crosses below the 25SMA, the price is below the 75SMA, and the ADX is above 20.
Exit
Positions are closed if a sudden move occurs. Positions are also closed if an opposing entry signal is generated.
This strategy aims to confirm the strength of the trend using moving average crossovers and ADX and to lock in profits based on sudden price movements.
3本の移動平均線による状況判断
5SMAと25SMA のクロスオーバーをエントリーシグナルとして使用します。
さらに、75SMAをフィルターとして使用し、価格が75SMAの上にある場合のみロングエントリーを許可し、75SMAの下にある場合のみショートエントリーを許可します。
ADXフィルター
ADX(平均方向性指数)を使ってトレンドの強さを確認します。
ADXが20より大きい場合のみ、エントリーシグナルを有効にします。これにより、トレンドが強い時にのみ取引を行うことができます。
急激な変動検知
価格の急激な変動を検出します。
急激な変動があった場合には、ポジションをクローズして利益を確定します。
エントリー
ロングエントリー
5SMAが25SMAを上にクロスし、価格が75SMAの上にあり、ADXが20を超えているとき。
ショートエントリー
5SMAが25SMAを下にクロスし、価格が75SMAの下にあり、ADXが20を超えているとき。
エグジット
急激な変動があった場合、ポジションをクローズします。
反対のエントリーシグナルが発生した場合にも、ポジションをクローズします。
このストラテジーは、移動平均のクロスオーバーとADXを使ってトレンドの強さを確認し、急激な変動に基づいて利益を確定することを目的としています。
Scalping with Williams %R, MACD, and SMA (1m)Overview:
This trading strategy is designed for scalping in the 1-minute timeframe. It uses a combination of the Williams %R, MACD, and SMA indicators to generate buy and sell signals. It also includes alert functionalities to notify users when trades are executed or closed.
Indicators Used:
Williams %R : A momentum indicator that measures overbought and oversold conditions. The Williams %R values range from -100 to 0.
Length: 140 bars (i.e., 140-period).
MACD (Moving Average Convergence Divergence) : A trend-following momentum indicator that shows the relationship between two moving averages of a security's price.
Fast Length: 24 bars
Slow Length: 52 bars
MACD Length: 9 bars (signal line)
SMA (Simple Moving Average) : A trend-following indicator that smooths out price data to create a trend-following indicator.
Length: 7 bars
Conditions and Logic:
Timeframe Check :
The strategy is designed specifically for the 1-minute timeframe. If the current chart is not on the 1-minute timeframe, a warning label is displayed on the chart instructing the user to switch to the 1-minute timeframe.
Williams %R Conditions :
Buy Condition: The strategy looks for a crossover of Williams %R from below -94 to above -94. This indicates a potential buying opportunity when the market is moving out of an oversold condition.
Sell Condition: The strategy looks for a crossunder of Williams %R from above -6 to below -6. This indicates a potential selling opportunity when the market is moving out of an overbought condition.
Deactivate Buy: If Williams %R crosses above -40, the buy signal is deactivated, suggesting that the buying condition is no longer valid.
Deactivate Sell: If Williams %R crosses below -60, the sell signal is deactivated, suggesting that the selling condition is no longer valid.
MACD Conditions :
MACD Histogram: Used to identify the momentum and the direction of the trend.
Long Entry: The strategy initiates a buy order if the MACD histogram shows a positive bar after a negative bar while a buy condition is active and Williams %R is above -94.
Long Exit: The strategy exits the buy position if the MACD histogram turns negative and is below the previous histogram bar.
Short Entry: The strategy initiates a sell order if the MACD histogram shows a negative bar after a positive bar while a sell condition is active and Williams %R is below -6.
Short Exit: The strategy exits the sell position if the MACD histogram turns positive and is above the previous histogram bar.
Trend Confirmation (Using SMA) :
Bullish Trend: The strategy considers a bullish trend if the current price is above the 7-bar SMA. A buy signal is only considered if this condition is met.
Bearish Trend: The strategy considers a bearish trend if the current price is below the 7-bar SMA. A sell signal is only considered if this condition is met.
Alerts:
Long Entry Alert: An alert is triggered when a buy order is executed.
Long Exit Alert: An alert is triggered when the buy order is closed.
Short Entry Alert: An alert is triggered when a sell order is executed.
Short Exit Alert: An alert is triggered when the sell order is closed.
Summary:
Buy Signal: Activated when Williams %R crosses above -94 and the price is above the 7-bar SMA. A buy order is placed if the MACD histogram shows a positive bar after a negative bar. The buy order is closed when the MACD histogram turns negative and is below the previous histogram bar.
Sell Signal: Activated when Williams %R crosses below -6 and the price is below the 7-bar SMA. A sell order is placed if the MACD histogram shows a negative bar after a positive bar. The sell order is closed when the MACD histogram turns positive and is above the previous histogram bar.
This strategy combines momentum (Williams %R), trend-following (MACD), and trend confirmation (SMA) to identify trading opportunities in the 1-minute timeframe. It is designed for short-term trading or scalping.

Zero-lag TEMA Crosses Strategy[Pakun]Here's the adjusted strategy description in English, aligned with the house rules:
---
### Strategy Name: Zero-lag TEMA Cross Strategy
**Purpose:** This strategy aims to identify entry and exit points in the market using Zero-lag Triple Exponential Moving Averages (TEMA). It focuses on minimizing lag and improving the accuracy of trend-following signals.
### Uniqueness and Usefulness
**Uniqueness:** This strategy employs the less commonly used Zero-lag TEMA, compared to standard moving averages. This unique approach reduces lag and provides more timely signals.
**Usefulness:** This strategy is valuable for traders looking to capture trend reversals or continuations with reduced lag. It has the potential to enhance the profitability and accuracy of trades.
### Entry Conditions
**Long Entry:**
- **Condition:** A crossover occurs where the short-term Zero-lag TEMA surpasses the long-term Zero-lag TEMA.
- **Signal:** A buy signal is generated, indicating a potential uptrend.
**Short Entry:**
- **Condition:** A crossunder occurs where the short-term Zero-lag TEMA falls below the long-term Zero-lag TEMA.
- **Signal:** A sell signal is generated, indicating a potential downtrend.
### Exit Conditions
**Exit Strategy:**
- **Stop Loss:** Positions are closed if the price moves against the trade and hits the predefined stop loss level. The stop loss is set based on recent highs/lows.
- **Take Profit:** Positions are closed when the price reaches the profit target. The profit target is calculated as 1.5 times the distance between the entry price and the stop loss level.
### Risk Management
**Risk Management Rules:**
- This strategy incorporates a dynamic stop loss mechanism based on recent highs/lows over a specified period.
- The take profit level ensures a reward-to-risk ratio of 1.5 times the stop loss distance.
- These measures aim to manage risk and protect capital.
**Account Size:** ¥500,000
**Commissions and Slippage:** 94 pips per trade and 1 pip slippage
**Risk per Trade:** 1% of account equity
### Configurable Options
**Configurable Options:**
- Lookback Period: The number of bars to calculate recent highs/lows.
- Fast Period: Length of the short-term Zero-lag TEMA (69).
- Slow Period: Length of the long-term Zero-lag TEMA (130).
- Signal Display: Option to display buy/sell signals on the chart.
- Bar Color: Option to change bar colors based on trend direction.
### Adequate Sample Size
**Sample Size Justification:**
- To ensure the robustness and reliability of the strategy, it should be tested with a sufficiently long period of historical data.
- It is recommended to backtest across multiple market cycles to adapt to different market conditions.
- This strategy was backtested using 10 days of historical data, including 184 trades.
### Notes
**Additional Considerations:**
- This strategy is designed for educational purposes and should be thoroughly tested in a demo environment before live trading.
- Settings should be adjusted based on the asset being traded and current market conditions.
### Credits
**Acknowledgments:**
- The concept and implementation of Zero-lag TEMA are based on contributions from technical analysts and the trading community.
- Special thanks to John Doe for the TEMA concept.
- Thanks to Zero-lag TEMA Crosses .
- This strategy has been enhanced by adding new filtering algorithms and risk management rules to the original TEMA code.
### Clean Chart Description
**Chart Appearance:**
- This strategy provides a clean and informative chart by plotting Zero-lag TEMA lines and optional entry/exit signals.
- The display of signals and color bars can be toggled to declutter the chart, improving readability and analysis.

Quadratic Kernel with Quadratic Divergence [PinescriptLabs]This indicator combines a quadratic kernel regression with adaptive deviation bands to provide a unique view of market trends.
Key Features:
**Customizable Parameters:**
- Regression Period: Adjusts the sensitivity of the central line (default 50).
- Time Deformation: Modifies the weight of recent vs. older data (default 1.0). Increasing the "Time Deformation" makes more recent data more relevant, while decreasing it gives more weight to older data in the regression calculation.
- Confidence Band Width: Controls the width of the bands (default 3.0). Determines how many standard deviations are added to or subtracted from the central line to form the confidence bands. The standard deviations are calculated as the difference between the central line and the closing prices. A higher confidence value will result in wider bands, indicating a broader range of expected price variation, while a lower confidence value will result in narrower bands, indicating a narrower range of expected price variation.
**How to Use the Indicator Based on Price Crossings with the Kernel Divergence Line?**
Short: We need a candle to cross and close below the Kernel Divergence Line (bullish), and at the same time, the quadratic channels must be in a Bearish state for confirmation. Once the entry is executed, our exit will be when the Divergence Line changes its color by at least two confirmation points, or the price crosses above, which nullifies the entry.
Long: We need a candle to cross and close above the Kernel Divergence Line (bearish), and at the same time, the quadratic channels must be in a Bullish state for confirmation. Once the entry is executed, our exit will be when the Divergence Line changes its color by at least two confirmation points, or the price crosses below, which nullifies the entry.
**How to Use the Indicator Based Solely on Kernel Divergence??**
We observe the Kernel Divergence line, which indicates bullish momentum while the price is declining, and we are looking for the Reversal point.
**Confirmation of the Reversal Point:** When the Kernel Divergence changes from bullish (green color) to bearish (red color), we look for the price at its lowest point to be below the first lower Quadratic channel or even outside the Quadratic channel. This signals a potential strong reversal.
How to Use the Indicator Based Solely on Quadratic Channels?
Use only confirmations of changes from Bullish to Bearish or vice versa. It is recommended to have at least three confirmation points in the same direction.
Quadratic Kernel Regression: Provides a smoothed trend line that adapts to market movements.
Adaptive Deviation Bands: Dynamically calculated to show market volatility.
Buy/Sell Signals: Based on the price crossing the central line and the direction of the trend.
Quadratic Kernel Regression calculates a smoothed central line based on recent prices.
The deviation bands automatically adjust according to market volatility.
The trend is determined by comparing the current position of the central line with its previous position.
Buy signals are generated when the price crosses above the central line in an uptrend.
Sell signals are generated when the price crosses below the central line in a downtrend.
Español:
Este indicador combina una regresión de kernel cuadrático con bandas de desviación adaptativas para proporcionar una visión única de la tendencia del mercado.
Características principales:
**Parámetros personalizables:**
- Período de regresión: Ajusta la sensibilidad de la línea central (por defecto 50).
- Deformación del tiempo: Modifica el peso de los datos recientes vs. antiguos (por defecto 1.0). Aumentar la "Deformación del tiempo" hace que los datos más recientes sean más relevantes, mientras que disminuirla da más peso a los datos antiguos en el cálculo de la regresión.
- Ancho de bandas de confianza: Controla la amplitud de las bandas (por defecto 3.0). Determina cuántas desviaciones estándar se añaden o restan a la línea central para formar las bandas de confianza. Las desviaciones estándar se calculan como la diferencia entre la línea central y los precios de cierre. Un valor mayor de confianza resultará en bandas más anchas, indicando un rango más amplio de variación esperada en los precios, mientras que un valor menor de confianza resultará en bandas más estrechas, indicando un rango más estrecho de variación esperada.
* *Cómo usar el Indicador Basados en los Cruces de Precio con la Línea de Divergencia del Kernel?**
Short: Necesitamos que una vela cruce y cierre por debajo de la línea de Divergencia del Kernel (bullish) y al mismo tiempo los Canales cuadráticos deben estar en un momento Bearish para confirmación. Una vez ejecutada la entrada, nuestra salida será cuando la Línea de Divergencia haga su cambio de color al menos dos puntos de confirmación o el precio haga un cruce por arriba, lo que anula la entrada.
Long: Necesitamos que una vela cruce y cierre por Encima de la linea de Divergencia del Kernel( Bearish) y al mismo tiempo los Canales cuadráticos deben estar en un momento Bullish para confirmación, una vez ejecutada la entrada nuestra salida será cuando la Linea de Divergencia haga su cambio de color al menos dos puntos de confirmación o el precio haga un cruce por Debajo lo que anula la entrada:
Como usar el indicador Basado en solo en Divergencia del Kernel? : Observamos la linea de Divergencia del Kernel la cual nos indica un momentum bullish mientras que precio va a la baja y lo que buscamos es el punto de Reversion.
Confirmación de punto de reversion: cuando la Divergencia de Kernel pasa de bullish ( color verde) a bearish ( color rojo) buscamos que el precio en su punto mas bajo este por debajo del primer canal inferior Quadratico o fuera incluso del canal Quadratico lo que nos indica una posible reversion con fuerza.
Como usar el indicador basado solo en Canales Quadraticos?
Utilizar únicamente las confirmaciones de Cambio de Bullish a Bearish o visceversa, se recomienda al menos tres puntos de confirmación en la misma dirección.
Regresión de kernel cuadrático: Ofrece una línea de tendencia suavizada que se adapta a los movimientos del mercado.
Bandas de desviación adaptativas: Calculadas dinámicamente para mostrar la volatilidad del mercado.
Señales de compra/venta: Basadas en el cruce del precio con la línea central y la dirección de la tendencia.
La regresión de kernel cuadrático calcula una línea central suavizada basada en los precios recientes.
Las bandas de desviación se ajustan automáticamente según la volatilidad del mercado.
La tendencia se determina comparando la posición actual de la línea central con su posición anterior.
Las señales de compra se generan cuando el precio cruza por encima de la línea central en una tendencia alcista.
Las señales de venta se generan cuando el precio cruza por debajo de la línea central en una tendencia bajista.
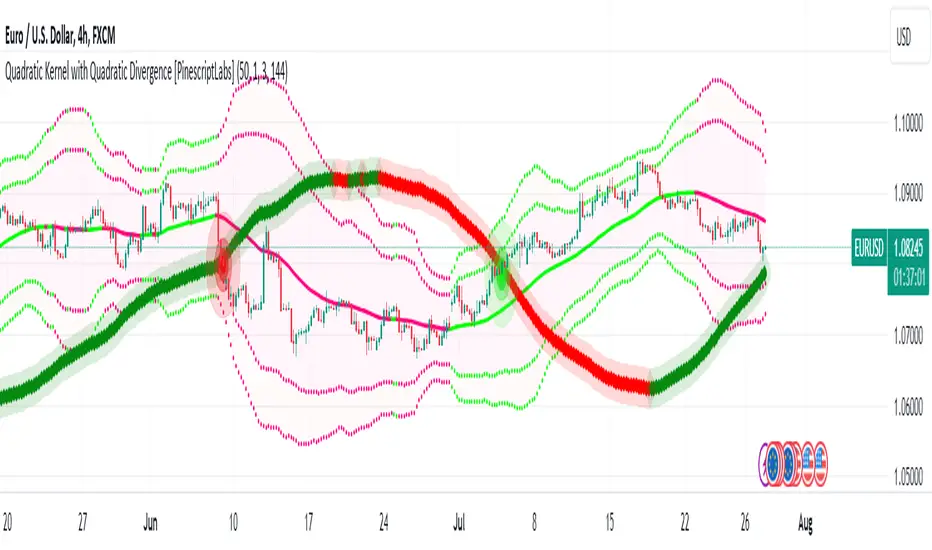
The Magic LineThis script is based on the simple 2 or 3 candle entry model taught by Armando "The Professor".
This strategy will work best on the 1hr timeframe or higher and you can also add a MA on your chart to identify direction of trend and trade with the trend. For example, if price is above the 50 SMA, you can opt to only look for 'buy' signals. If price is below the 50 SMA, you can opt to only look for 'sell' signals.
The default setting is to wait for 3 consecutive candles of either bullish or bearish sentiment before printing a buy or sell signal. This can be changed to any number you would like but typically 3 works best, as long as you're using the 1hr timeframe or higher.
Ex: If there are 3 green (bullish) candles print in a row, a 'sell' signal will print, and the entry line will be one tick below the open of the previous green candle. You can use that line as your entry.
For your stop loss, you can try to use the most recent swing high (for sells) or swing low (for buys). You can also use nearby support/resistance levels, or even the PSAR as another way to determine your stop loss.
If there are more than 3 consecutive candles with the same sentiment, signals will continue to print until the streak ends at which point the counter will restart, and the idea is to take the most recent signal as your entry. Limit/Stop entries work best as you can just let price come down to the signal line that is drawn.
Comment below if you have any questions! Good luck!

TSI w SuperTrend decision - Strategy [presentTrading]This strategy aims to improve upon the performance of Traidngview's newly published "Trend Strength Index" indicator by incorporating the SuperTrend for better trade execution and risk management. Enjoy :)
█ Introduction and How it is Different
The "TSI with SuperTrend Decision - Strategy" combines the Trend Strength Index (TSI) with SuperTrend indicators to determine entry and exit points. Unlike traditional strategies that rely solely on one indicator, this method leverages the strengths of both TSI and SuperTrend to provide a more nuanced and adaptive trading strategy.
This dual approach allows for capturing trends more effectively, especially in volatile markets.
BTCUSD 8h LS Performance
█ Strategy, How it Works: Detailed Explanation
🔶 Trend Strength Index (TSI)
The TSI is a momentum oscillator that shows both the direction and strength of a trend. It is calculated by comparing the price movement with the bar index over a specified period. The formula for TSI is as follows:
```
TSI = (PC / |PC|)
where:
PC = Change in price over the period
```
In this strategy, TSI is calculated using the closing prices and a default period of 64 bars. The TSI values help identify overbought and oversold conditions, providing signals for potential market reversals.
🔶 SuperTrend Indicator
The SuperTrend is a trend-following indicator based on the average true range (ATR). It helps in identifying the direction of the market trend. The SuperTrend calculation involves:
```
SuperTrend = HLC3 ± (Factor * ATR)
where:
HLC3 = (High + Low + Close) / 3
Factor = User-defined multiplier
ATR = Average True Range over a period
```
The SuperTrend settings in this strategy include a length of 10 bars and a factor of 3.0.
Last Bull Cycle of BTC
🔶 Entry and Exit Conditions
The strategy uses the TSI and SuperTrend together to determine entry and exit points:
- Long Entry: When the SuperTrend indicates a downward trend (st.d < 0) and the TSI is above the oversold level (-0.241).
- Long Exit: When the SuperTrend indicates an upward trend (st.d > 0) and the TSI is below the overbought level (0.241).
- Short Entry: When the SuperTrend indicates an upward trend (st.d > 0) and the TSI is below the overbought level (0.241).
- Short Exit: When the SuperTrend indicates a downward trend (st.d < 0) and the TSI is above the oversold level (-0.241).
█ Trade Direction
The strategy allows users to select the trade direction through the `tradeDirection` input. The options are:
- Both: Enables both long and short trades.
- Long: Enables only long trades.
- Short: Enables only short trades.
█ Default Settings
- TSI Length: 64
- SuperTrend Length: 10
- SuperTrend Factor: 3.0
- Trade Direction: Both
- Take Profit (%): 30.0
- Stop Loss (%): 20.0
Impact of Default Settings
- TSI Length: A longer TSI period smooths out noise but may lag in identifying trends. A shorter period is more responsive but can generate false signals.
- SuperTrend Length: A shorter length provides quicker signals but can be prone to whipsaws. A longer length is more reliable but may delay entries and exits.
- SuperTrend Factor: A higher factor increases the distance of the SuperTrend from the price, reducing sensitivity to minor price fluctuations.
- Trade Direction: Allows flexibility in trading strategies by enabling both long and short trades based on market conditions.
- Take Profit and Stop Loss: These settings manage risk by automatically closing trades at predefined profit or loss levels. Higher percentages provide larger potential gains but also higher risk.

CCI and MACD Auto Trading Strategy with Risk/RewardOverview:
This strategy combines the Commodity Channel Index (CCI) and the Moving Average Convergence Divergence (MACD) indicators to automate trading decisions. It dynamically sets stop-loss and take-profit levels based on recent lows and highs, ensuring a risk/reward ratio of 1:1.5. This script aims to leverage trend and momentum signals while maintaining effective risk management.
Originality and Usefulness:
This script is not just a simple mashup of CCI and MACD indicators; it incorporates dynamic risk management by setting stop-loss and take-profit levels based on recent price action. This approach helps traders to:
・Identify potential trend reversals using the combination of CCI and MACD signals.
・Manage trades effectively by setting realistic stop-loss and take-profit levels based on recent market data.
・Maintain a balanced risk/reward ratio, which is essential for sustainable trading.
Indicators Used:
・CCI (Commodity Channel Index):
・Measures the deviation of the price from its average over a specified period, typically ranging from -100 to +100.
・Helps identify overbought and oversold conditions.
・MACD (Moving Average Convergence Divergence):
・Utilizes the difference between short-term and long-term moving averages to indicate trend strength and direction.
・Provides momentum signals that can be used for timing entries and exits.
How It Works:
Entry Conditions:
Long Entry:
・The MACD histogram is above zero.
・The CCI crosses above the -100 line.
Short Entry:
・The MACD histogram is below zero.
・The CCI crosses below the +100 line.
Exit Conditions:
Long Positions:
・The stop-loss is set at the recent low.
・The take-profit is set at 1.5 times the distance between the entry price and the stop-loss.
Short Positions:
・The stop-loss is set at the recent high.
・The take-profit is set at 1.5 times the distance between the entry price and the stop-loss.
Risk Management:
・The script dynamically adjusts stop-loss and take-profit levels based on recent market data, ensuring that the risk/reward ratio is maintained at 1:1.5.
・This approach helps in managing the risk effectively while aiming for consistent profits.
Strategy Properties:
・Account Size: Configured for a realistic account size suitable for the average trader.
・Commission and Slippage: Includes settings for realistic commission and slippage to reflect real market conditions.
・Risk per Trade: Designed to risk no more than 5-10% of equity per trade, aligning with sustainable trading practices.
・Backtesting Results: Configured to generate a sufficient sample size (ideally more than 100 trades) for reliable backtesting results.
Revised Backtesting Settings
Ensure that your backtesting settings are realistic:
・Account Size: Set a realistic initial capital suitable for the average trader.
・Commission and Slippage: Include realistic commission fees and slippage.
・Risk Management: Ensure that each trade risks no more than 5-10% of the account equity.
・Sufficient Sample Size: Choose a dataset that will generate more than 100 trades to provide a robust sample size.

Smart Money Concept Strategy - Uncle SamThis strategy combines concepts from two popular TradingView scripts:
Smart Money Concepts (SMC) : The strategy identifies key levels in the market (swing highs and lows) and draws trend lines to visualize potential breakouts. It uses volume analysis to gauge the strength of these breakouts.
Smart Money Breakouts : This part of the strategy incorporates the idea of "Smart Money" – institutional traders who often lead market movements. It looks for breakouts of established levels with significant volume, aiming to catch the beginning of new trends.
How the Strategy Works:
Identification of Key Levels: The script identifies swing highs and swing lows based on a user-defined lookback period. These levels are considered significant points where price has reversed in the past.
Drawing Trend Lines: Trend lines are drawn connecting these key levels, creating a visual representation of potential support and resistance zones.
Volume Analysis: The script analyzes the volume during the formation of these levels and during breakouts. Higher volume suggests stronger moves and increases the probability of a successful breakout.
Entry Conditions:
Long Entry: A long entry is triggered when the price breaks above a resistance line with significant volume, and the moving average trend filter (optional) is bullish.
Short Entry: A short entry is triggered when the price breaks below a support line with significant volume, and the moving average trend filter (optional) is bearish.
Exit Conditions:
Stop Loss: Customizable stop loss percentages are implemented to protect against adverse price movements.
Take Profit: Customizable take profit percentages are used to lock in profits.
Credits and Compliance:
This strategy is inspired by the concepts and code from "Smart Money Concepts (SMC) " and "Smart Money Breakouts ." I've adapted and combined elements of both scripts to create this strategy. Full credit is given to the original authors for their valuable contributions to the TradingView community.
To comply with TradingView's House Rules, I've made the following adjustments:
Clearly Stated Inspiration: The description explicitly mentions the original scripts and authors as the inspiration for this strategy.
No Direct Copying: The code has been modified and combined, not directly copied from the original scripts.
Educational Purpose: The primary purpose of this strategy is for learning and backtesting. It's not intended as financial advice.
Important Note:
This strategy is intended for educational and backtesting purposes only. It should not be used for live trading without thorough testing and understanding of the underlying concepts. Past performance is not indicative of future results.

Advanced Gold Scalping Strategy with RSI Divergence# Advanced Gold Scalping Strategy with RSI Divergence
## Overview
This Pine Script implements an advanced scalping strategy for gold (XAUUSD) trading, primarily designed for the 1-minute timeframe. The strategy utilizes the Relative Strength Index (RSI) indicator along with its moving average to identify potential trade setups based on divergences between price action and RSI movements.
## Key Components
### 1. RSI Calculation
- Uses a customizable RSI length (default: 60)
- Allows selection of the source for RSI calculation (default: close price)
### 2. Moving Average of RSI
- Supports multiple MA types: SMA, EMA, SMMA (RMA), WMA, VWMA, and Bollinger Bands
- Customizable MA length (default: 3)
- Option to display Bollinger Bands with adjustable standard deviation multiplier
### 3. Divergence Detection
- Implements both bullish and bearish divergence identification
- Uses pivot high and pivot low points to detect divergences
- Allows for customization of lookback periods and range for divergence detection
### 4. Entry Conditions
- Long Entry: Bullish divergence when RSI is below 40
- Short Entry: Bearish divergence when RSI is above 60
### 5. Trade Management
- Stop Loss: Customizable, default set to 11 pips
- Take Profit: Customizable, default set to 33 pips
### 6. Visualization
- Plots RSI line and its moving average
- Displays horizontal lines at 30, 50, and 70 RSI levels
- Shows Bollinger Bands when selected
- Highlights divergences with "Bull" and "Bear" labels on the chart
## Input Parameters
- RSI Length: Adjusts the period for RSI calculation
- RSI Source: Selects the price source for RSI (close, open, high, low, hl2, hlc3, ohlc4)
- MA Type: Chooses the type of moving average applied to RSI
- MA Length: Sets the period for the moving average
- BB StdDev: Adjusts the standard deviation multiplier for Bollinger Bands
- Show Divergence: Toggles the display of divergence labels
- Stop Loss: Sets the stop loss distance in pips
- Take Profit: Sets the take profit distance in pips
## Strategy Logic
1. **RSI Calculation**:
- Computes RSI using the specified length and source
- Calculates the chosen type of moving average on the RSI
2. **Divergence Detection**:
- Identifies pivot points in both price and RSI
- Checks for higher lows in RSI with lower lows in price (bullish divergence)
- Checks for lower highs in RSI with higher highs in price (bearish divergence)
3. **Trade Entry**:
- Enters a long position when a bullish divergence is detected and RSI is below 40
- Enters a short position when a bearish divergence is detected and RSI is above 60
4. **Position Management**:
- Places a stop loss order at the entry price ± stop loss pips (depending on the direction)
- Sets a take profit order at the entry price ± take profit pips (depending on the direction)
5. **Visualization**:
- Plots the RSI and its moving average
- Draws horizontal lines for overbought/oversold levels
- Displays Bollinger Bands if selected
- Shows divergence labels on the chart for identified setups
## Usage Instructions
1. Apply the script to a 1-minute XAUUSD (Gold) chart in TradingView
2. Adjust the input parameters as needed:
- Increase RSI Length for less frequent but potentially more reliable signals
- Modify MA Type and Length to change the sensitivity of the RSI moving average
- Adjust Stop Loss and Take Profit levels based on current market volatility
3. Monitor the chart for Bull (long) and Bear (short) labels indicating potential trade setups
4. Use in conjunction with other analysis and risk management techniques
## Considerations
- This strategy is designed for short-term scalping and may not be suitable for all market conditions
- Always backtest and forward test the strategy before using it with real capital
- The effectiveness of divergence-based strategies can vary depending on market trends and volatility
- Consider using additional confirmation signals or filters to improve the strategy's performance
Remember to adapt the strategy parameters to your risk tolerance and trading style, and always practice proper risk management.
