Laguerre RSI (Fractals Energy) [v6]This write-up explores the **Laguerre RSI (LRSI)**, a sophisticated technical indicator pioneered by **John F. Ehlers**. Unlike the standard RSI, which often suffers from "lag" or excessive noise, the Laguerre RSI uses a four-pole filter to provide a smoother, more responsive curve that stays in overbought or oversold zones longer during strong trends.
The following analysis focuses on the interplay between the **Alpha (Gamma)** and the **Gamma Bandwidth**, specifically looking for "Alpha Exceeding" events to identify market coiling and exhaustion.
---
## 1. The Core Concept: Ehlers’ Laguerre Transform
Traditional indicators use a fixed look-back period (e.g., 14 periods). John Ehlers introduced the Laguerre Transform to allow for a more efficient way of filtering data using a very small amount of data.
In the provided code, the key variable is **Alpha** (derived from **Fractals Energy/Gamma**). This value determines the "speed" of the indicator.
* **Low Alpha:** High damping, smoother but slower.
* **High Alpha:** Low damping, faster and more reactive.
---
## 2. The Gamma Bandwidth: Coiling and Energy
The "Gamma Band" (the purple shaded area in your script, typically between and ) represents the "neutral" zone for market fractal energy.
### Market Coiling (Compression)
When the **Alpha (Gamma) line** climbs **above the Gamma Upper Bound** (e.g., ):
* This indicates the market is moving into a state of **high fractal efficiency** or "straight-line" movement.
* However, when Alpha is pinned high, it often signals **Coiling**. The market is burning through its energy efficiently, but it is reaching a state of "ordered" exhaustion.
* **The Interpretation:** The price is trending strongly, but the lack of "chaos" suggests a trend maturity is approaching.
### Alpha Exceeding the Bands (Exhaustion)
When the Alpha line spikes significantly outside the bands while the LRSI line (blue or pink) is pinned at the extremes (1.0 or 0.0), we observe **Exhaustion**.
* **Bullish Exhaustion:** LRSI is (Blue) and Alpha exceeds the upper band. The trend is so efficient that it has no room left to accelerate. A "reversion to the mean" or a period of "choppiness" (increasing fractal chaos) is likely.
* **Bearish Exhaustion:** LRSI is (Pink) and Alpha exceeds the upper band. This shows a vertical drop that is unsustainable in the long term.
---
## 3. Signal Mechanics: The "Hook"
The most potent signal occurs when the Alpha line begins to **descend back into the Gamma Bandwidth** while the LRSI line crosses the OB/OS levels.
| Signal Component | Market Condition | Actionable Insight |
| --- | --- | --- |
| **Alpha > 0.59** | High Efficiency / Coiling | Trend is strong, but watch for the "bend." |
| **Alpha < 0.41** | High Complexity / Choppiness | Market is trendless; energy is being stored for the next move. |
| **LRSI Cross < 0.8** | Bearish Reversal | Trend exhaustion confirmed; exit longs or enter shorts. |
| **LRSI Cross > 0.2** | Bullish Reversal | Mean reversion confirmed; exit shorts or enter longs. |
---
## 4. Summary of the Methodology
By integrating **Fractals Energy** (Gamma) directly into the Alpha of the Laguerre RSI, this version of Ehlers’ work allows the indicator to adapt its own speed based on the market’s complexity.
When Alpha exceeds the bands, it is a warning that the "clean" move is coming to an end. The market is "coiled" tight; the subsequent break back into the purple band signifies that the trend has lost its linear efficiency and is returning to a state of chaos—often resulting in a price reversal or significant consolidation.
> **Credit:** All mathematical foundations of the Laguerre Transform and the RSI implementation are credited to **John F. Ehlers**.
---
Would you like me to create a visual guide or table specifically for the **Fractal Energy** values and how they correlate to specific market phases?
Cerca negli script per "fractals"

3C FractalsIts based on Williams Fractals indicator, but instead of using 5 candles to mark the fractals, it uses only 3.

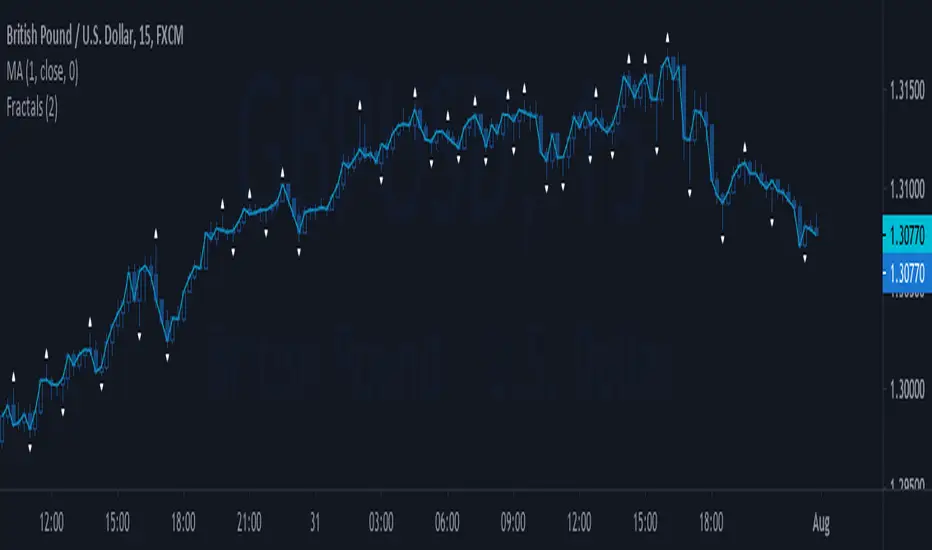
Williams Fractals with Buy/Sell Signals🧠 Concept:
This indicator is based on the concept of fractal swing highs and lows, commonly used in Bill Williams’ trading methods. A fractal forms when a candle’s high or low is higher/lower than a set number of candles on both sides. This structure helps identify local market turning points.
⚙️ Inputs:
Fractal Sensitivity (swingSensitivity):
Number of candles required on each side of the central bar to validate a fractal.
For example, if set to 2, a swing high is detected when a bar’s high is higher than the previous 2 bars and the next 2 bars.
✅ Features:
Fractal Detection:
Plots white triangles above swing highs (down fractals).
Plots white triangles below swing lows (up fractals).
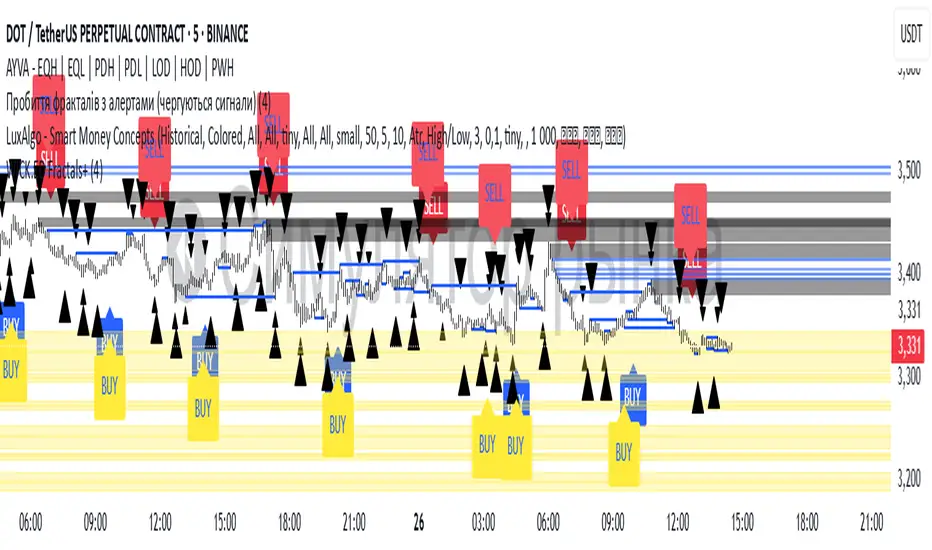
Buy/Sell Signals:
Buy Signal: Triggered when the candle closes above the most recent down fractal.
Sell Signal: Triggered when the candle closes below the most recent up fractal.
Signals alternate — a Buy must follow a Sell and vice versa to reduce noise.
Signal Labels:
"BUY" label appears below the candle in green.
"SELL" label appears above the candle in red.
Alerts:
Real-time alerts are available for both Buy and Sell signals via alertcondition().
📌 Use Case:
This indicator can help you:
Detect short-term reversals.
Confirm breakouts or structure shifts.
Time entries with clear logic based on price action.
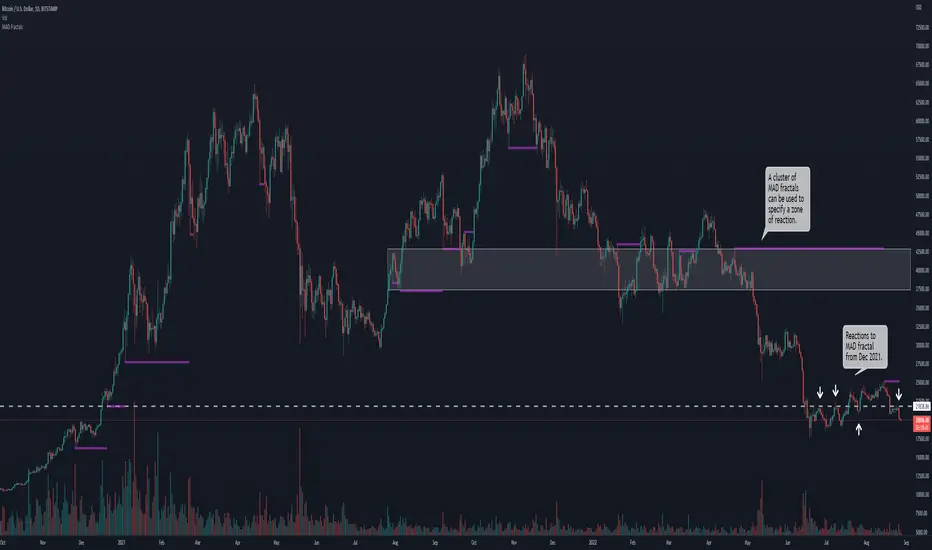
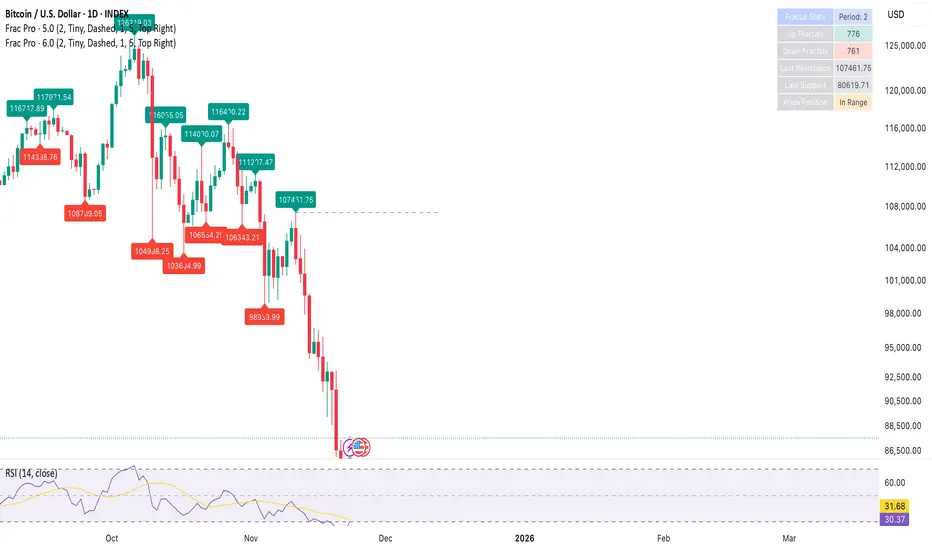
Median Absolute Deviation Outlier FractalsCore Concepts
Using Bill William's fractals (can be any types of pivots), we want to find outlier fractals using the median absolute deviation (MAD). When the true range falls outside the specified threshold, it is counted as an outlier. These outliers tend to have significance. Prices usually react to those levels in the future, sometimes a single level and other times a cluster of them to create a zone.
Usage
The baseline determines the trend. Above baseline is uptrend and below is downtrend.
MAD length is how much data you want to use for the MAD calculation.
Deviation limit is the multiple of MAD from median figure to determine if the true range prices exceeds it and if it does we have an outlier.
Notes:
The script is for informational and educational purposes only.
Any suggestions for improvement are welcome!
Makuchaku's Trade Tools - Pivots/Fractals & CrossoversPivots/Fractals are at minimum a 3 candlestick pattern.
Bearish pivot/fractal is formed when a candle is flanked by 2 lower candles on either side
Bullish pivot/fractal is formed when a candle is flanked by 2 higher candles on either side
They are great to determine market structure.
This indicator also prints boxes when those pivots/fractals are crossed over, printing bearish & bullish boxes.

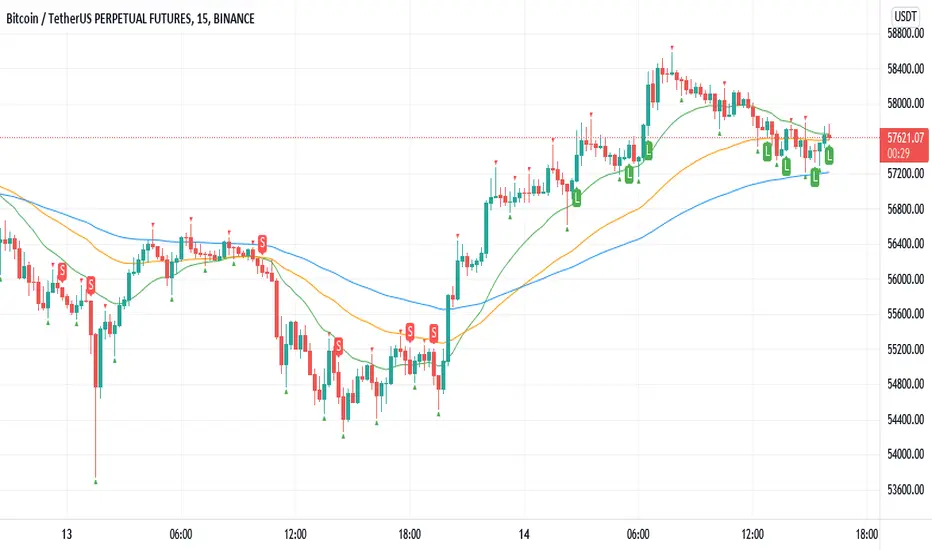
Williams Fractals BUY/SELL signals indicatorThis indicator made with using Williams Fractals, 20 50 100 Moving Averages and Relative Strength Index. You can easily find entry points by using Long (L), Short (S) signals.
This is a 15min scalping strategy for BTC:USDT Perpetual pair. For use different pairs or TFs you may need to change settings.
How to use
****************
When flashing Long (L) or Short (S) signal you should wait until the candle closing for the confirmation.
After that candle closed with the signal, you can enter a trade in next candle opening.
Your SL should be 3.1% from etnry and TP should be 0.5% from entry for best results. (You can use Long Position / Short Position tool in Prediction and Measurement Tools in drawing pannel to calculate this. This settings only for BTC:USDT Perp 15 min TF. For other TFs or Pairs settings may vary. You can easily change these settings and backtest your own.)
After entering a trade you can be ignored next signals until close the trade.
To learn more about this strategy, please try the "Williams Fractals Strategy" I coded. Thank you!
[BMAX] Fractals(ENGLISH)
This is a variation of the original Fractals indicator by Bill Williams - in this version we use the concept of three candles being in a swing low when the second candle has the highest high and on a swing high when the second candle has the lowest low.
(PORTUGUÊS)
Esta é uma variação do indicador original Fractals criado por Bill Williams - nesta versão usamos o conceito de três candles sendo considerado um pivô de baixa quando o segundo candle tem a máxima mais alta e um pivô de alta quando o segundo candle tem a mínima mais baixa.

Counting HH/LL w FractalsWork in progress. Will indicate when a certain number of highest/lowest fractals have occurred from a starting point.
E.g. if lowest in 50, start counting highest fractals until N number is reached.
You can see my current status/attempts in the code comments. I am publishing to invite others to help via TV chat and StackOverflow. I will update the script when a solution is achieved.
Thanks!

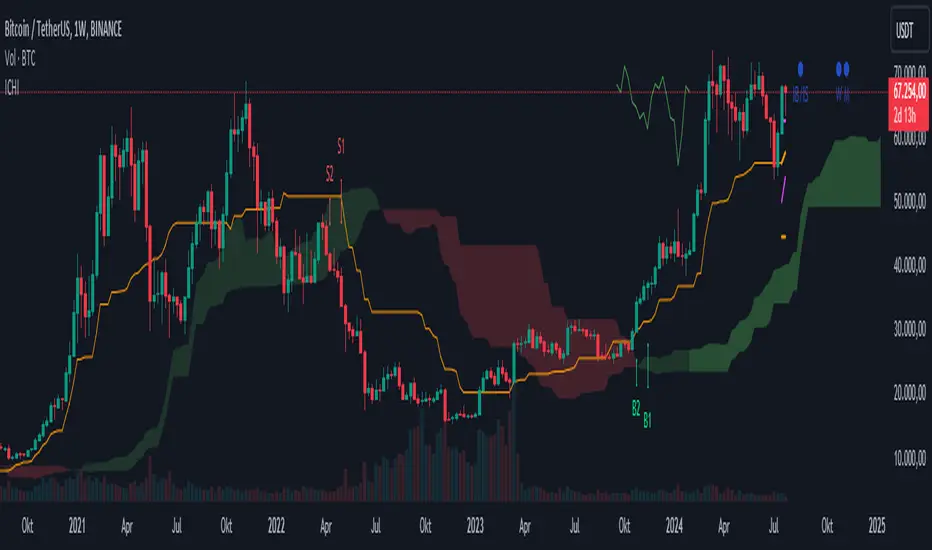
Ichimoku Kinko Hyo + FractalsIn contrast to my Ichimoku ++ Study this is a pure Ichimoku Konko Hyo Study with Bill Williams Fractals (I couldn't leave out the fractals as these levels are too important for Ichimoku trading).
In this study you can find many visualisation options for the Ichimoku Indicator and the signals the Ichimoku Tradingsystem can provide.
Tenkan-sen and Kijun-sen are provided optionally as mtf levels.
An mtf price cloud relationship is shown in the upper right.
The included signals are:
B1/S1 is a strong filtered signal. The condition for long entry is:
price > Kumo AND Chikou > price AND Chikou > Kumo AND Tenkan > Kijun AND Komo is green
B2/S2 is a less filtered signal. The condition for long entry is:
price > Kumo AND Chikou > price AND Tenkan > Kijun
IB/IS is a confluence signal. The condition for a long/short entry is: more than 50% of the 8 defined conditions must trigger a long signal. Below 50% long, it is a short signal because more than 50% of the entry conditions have triggered a short signal.
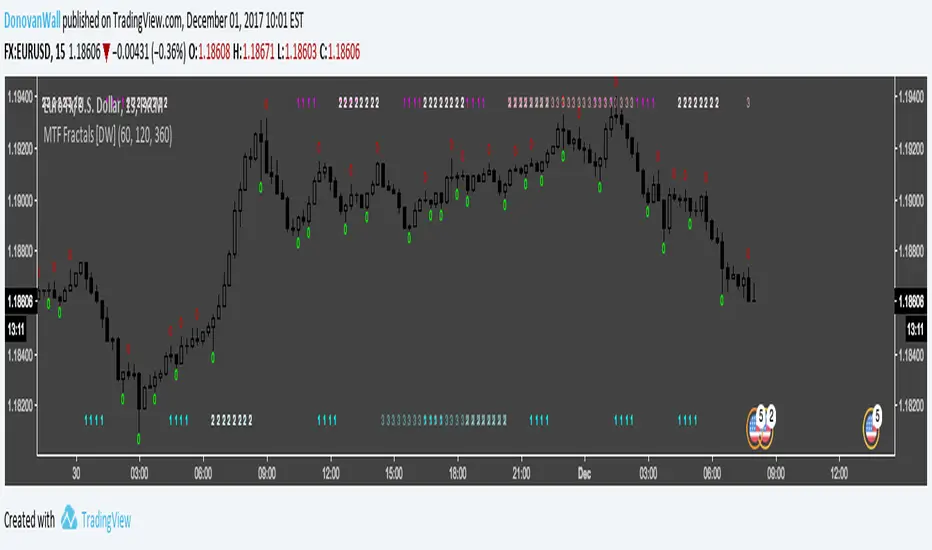
MultiTimeFrame Fractals D W M [xdecow]This indicator shows fractals in different timeframes. With the possibility of coloring the bars with any combination of current, daily, weekly and monthly timeframes.
The return points are calculated as follows:
high > last 3 highs and close above highest low
low < last 3 lows and closes below lowest high
The direction of higher timeframes fractals tend to be more durable and reliable. This indicator helps to find the fractal alignment of different timeframes, so that you can look for trade opportunities in the same direction as the higher timeframes and improve your chances.

Power Fractals Open Source I decided to make my power fractals indicator open source.
(/script/el8MaHcq-Power-Fractals/)
Feel free to use/change/improve.

Bill Williams. Alligator, Fractals & Res/Sup combined (by vlkvr)Bill Williams indicators (each separately) are simple and quite self-sufficient, however, are most often used together. The key ones (Alligator and Fractals) are freely available and everyone can use them, but why use them on the chart separately, when "together more fun", and not conceivable, in my opinion, they are one without the other.
So, I present "split/copypasta" of two key indicators of Bill Williams, plus (as a bonus) visualization of "Support/Resistance" levels (and in fact, lines from extremes or the same fractals).
As a result, before you indicator "three-in-one".

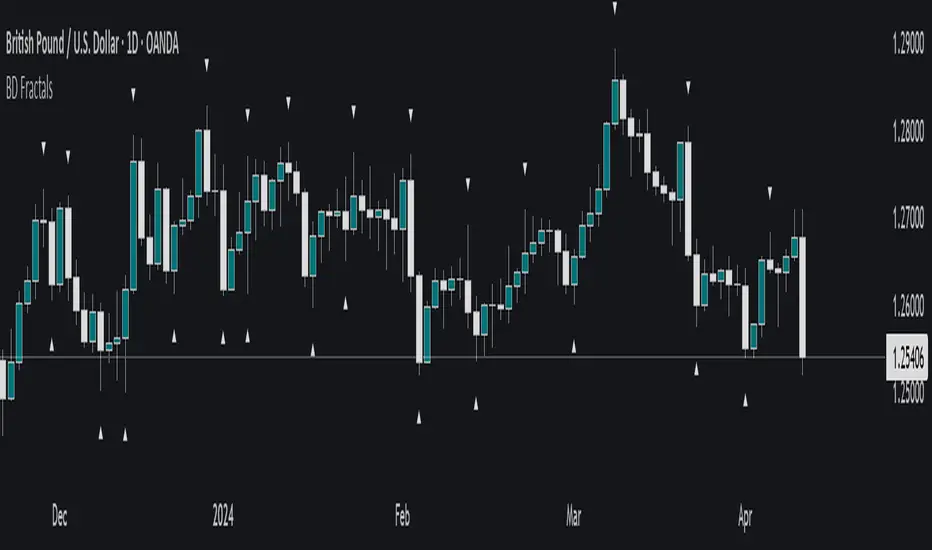
Multi-Timeframe Fractals [DW]This is a simple study designed to find fractals on multiple timeframes.
NOTE: Because higher timeframe levels are not certain until the interval is closed, refresh your chart as new fractals are drawn.
Williams Fractals Tiny IconsA version of Williams Fractals but the script has been altered to make the icons smaller. Use these for trailing stop loss, adding to positions, or entering a position late.
Price Action + Fractals DetectorThe Price Action Patterns Detector indicator also includes a Fractal (WICK.ED style). This way, you'll see Pinbar, Engulfing, Doji, Inside/Outside Bar, Morning/Evening Star formations, and fractals will appear. 🔥

[-_-] 2D FractalsThe sole purpose of this script is to demonstrate what's possible to make with Pinescript, namely to display images (2D Fractals in this case).
The script consists of two functions: one that generates the values of a fractal and one that displays them (utilising table) with each cell being used as a "pixel". We can control the "resolution" of image, as well as choose one of three fractal types.

Williams Fractals - LH/HLSame of original Williams Fractals, but with the following changes
- changed arrow directions
- added option to show Lower Highs and Higher Lows
- added alerts for Lower High and Higher Low
Enjoy~~

Williams Fractals with alerts ABCAll the original Williams Fractals algorithm but with a useful way to set up alerts.

5min Williams Fractals scalping (3commas)Another strategy I'm learning Pine Script on. It is inspired by a MoneyZG youtube strategy called "Easy 5 Minute Scalping Strategy (Simple to Follow Scalping Trading Strategy)".
Again this is a one order per trade strategy compatible with the 3commas bot (works also with the free 3commas subscription). This strategy is based on the signals from Williams Fractals, taking the signals in reverse - red triangle indicates a bottom and hence we go long. The green triangle indicates a top so we go short. By default these signals are only accepted if they occur between the two Emas. However, you can also turn this off and when a WF signal comes in, only the current price has to be between the Emas. Stop loss is set to the current Ema slow and the take profit is a multiple of the distance to the slow ema.
Like previously I have added different filters as well as the ability to view essential things like the WF signal and Emas. I hope the script will help you to be more successful and if so it would be great if you could share here your setups, or tips on what would be good to refine to make it an even a more profitable strategy. Kind of a community approach so that we help each other out :).
Instructions for the 3commas connector:
1. First, you need to prepare 3commas Long/Short bots that will only listen to custom TV signals.
2. Inputs for the 3commas bot can be found at the end of the user inputs.
3. Once you have entered the required details into the inputs, turn on 3commas comments. They should appear on the chart (looks messy).
4. Now you can add the alert where you should paste the 3commas Webhook URL: 3commas.io
5. For the alert message text insert the placeholder {{strategy.order.comment}} and delete the rest.
6. Once the alert is saved, you can turn off those 3commas comments to have a clearer chart.
7. With a new alert, the bot and trade should launch.
In the near future I would like to publish more scripts that will carry similar elements as the first two, incl. compatibility with 3commas (I don't have access to another bot system). I will choose some strategies myself, but I will also be glad for some tips on what strategy would be good to do and is still missing here on Tradingview (short youtube videos or brief strategy manuals would be great).
Thanks and keep it up
PS: My screen values starting at Long Target Profit and ending at Pullback NOT greater than: 1.5; 1.5; 0; ON; 1; 2; OFF; 17; 36; ON; 0.05; ON; Chart; 14; 46; 50; 48.5; 51; OFF; 1; ON; 4; 2.

Williams Fractals StrategyThis indicator made with using Williams Fractals, 20 50 100 Moving Averages and Relative Strength Index. You can easily find entry points by using Long (L), Short (S) signals.
Note : Settings are optimized for BTC:USDT Perpetual 15min TF. For use different pairs or TFs you may need to change settings.

Williams Fractals, A simpler scriptA simpler script to filter fractals and support large range parameter.

Normal FractalsNormal size fractal
For those who like Charts as clean as possible, I modified build in fractals in smaller size clean chart pollution