ICT - GAPs and Volume Imbalance
GAPs
Gaps are areas on chart where the price have moved sharply up or down, with no trading in between. Gaps often fill, but they don't have to.
Volume Imbalance
Volume imbalance - determined using 2 candles
Bullish Volume Imbalance - area between the close of 1st candle and the open of 2nd candle
Bearish Volume Imbalance - area between the close of 1st candle and the open of 2nd candle
How to use the indicator:-
When you find imbalance in volume or a GAP in the chart, you may expect price to rebalance it before continuation.
Importantly, GAPs/Imbalances do not always fill. Traders should never assume that a gap/imbalance will fill without understanding the reasons for the gap and monitoring trading activity around the gap.
Pair it with your current bias for better results.
Cerca negli script per "gaps"

Gaps + Imbalances + Wicks (MTF) - By LeviathanThis script will identify and draw price gaps, wicks and imbalances with customizable fill conditions, multi-timeframe function, zone size filtering, volume comparison, lookback filtering, as well as highly customizable appearance and settings.
I’ve made this indicator to combine the three similar but different elements that occur in price movements and serve as significant zones of interest or way of PA interpretation in various different strategies.
Imbalances (or Fair Value Gap/FVG/Inefficiency/whatever)
- The Imbalance “pattern” consists of 3 candles (1- candle before the sharp move, 2 - sharp move candle and 3- candle after the sharp move). When price makes a move downwards, the imbalance zone is defined as the area between the low of 1 and the high of 3 When price makes a move upwards, the imbalance zone is defined as the area between the high of 1 and the low of 3.
Gaps
A price gap is an area on a chart where no trading activity has taken place. A gap up means that the low of the current candle is higher than the high of the previous candle and a gap down means that the high of the current candle is lower than the low of the previous candle.
Wicks (or shadows/tails/whatever)
Wicks are used to indicate where the price has fluctuated relative to the opening and closing price of the candle. An upper wick is the zone between candle high and candle close/open (whichever is higher) and a lower wick is the zone between candle’s low and candle’s close/open (whichever is lower).
Settings Overview
“Zone Type” - This input lets you decide which zones should the script plot and on which timeframe. You should always pick a timeframe higher than your chat’s.
“Middle Line, Top Line, Bottom Line” - Show or hide the Middle Line (horizontal level in the middle of each zone), Show or hide Top Line (horizontal level at the top of the zone), Show or hide Bottom Line (horizontal level at the bottom of the zone)
“UP/DOWN Zones" - This input lets you show/hide UP Zones or DOWN Zones an pick their color, border color and label color.
”Fill Condition” - If turned ON, the zones will end drawing when your prefered Fill Condition is met (Full Filll = price mitigates the whole zone, Half Fill = zone is at least halfway mitigated and Touch = zone is touched by price). If turned OFF, the zones will only be plotted for the amount of bars defined it “Zone Length”.
”Lookback (D)” - This input lets you limit the amount of zones plotted on the chart by choosing how many days back in time should the script go to find and plot zones. For example, input 1 will only show you the zones of the past day, input 7 will only show you the zones of the past week.
”Hide Filled Zones” - If turned ON, the zones that have been filled will be removed from the chart.
”Show Boxes” - Show or hide the boxes that represent the zones. This is useful for those who want the zones to be visualized by just lines.
“Filter Type” - this input lets you create a filter that will make the script only show zones that are larger than ATR or larger than a certain percentage. You can choose the ATR Length and the multiplier (higher multiplier → larger zone required), as well as the Percentage (%) and its multiplier (higher percentage → larger zone required). If you choose “None”, the zones of all sizes will be plotted.
”Zone Labels” - this part of the settings lets you: show/hide labels, decide on the size of the labels and their positions, choose a custom name for each zone, choose the data that the labels present (Type of the zone/Timeframe/ Volume ).
”Other settings” - ‘Stop/Delete zone after X number of candles’ will force stop/delete the zone if it’s plotted for more than prefered number of bars. ‘Line Style’ lets you choose the style and the color of the lines, ‘Zone Length’ defines the length of the zone if Fill Condition is “None”.
More settings, modifications and improvements coming in future updates. This script is a bit old so I will clean up and optimize the code once I have more time.

Gaps (modified TradingView standard indicator)Based on standard TradingView "Gaps" indicator, but modified so that the gaps are displayed until fully closed (not jus paritally like the original indicator).

Gap Statistics (Zeiierman)█ Overview
The Gap Statistics (Zeiierman) indicator is crafted to monitor, analyze, and visually present price gaps on a trading chart. Price gaps are areas on a chart where the price jumps up or down from the previous close to the next open, creating a "gap" in the normal price pattern. This script delivers an extensive range of statistics related to these gaps, encompassing their size, direction (whether bullish or bearish), frequency of getting filled, as well as the average number of bars it takes for a gap to be filled. The indicator also visually represents the gaps, making it easier for traders to spot and analyze them.
█ How It Works
Gap Identification: The script identifies gaps by comparing the open price of a bar to the close price of the previous bar. If there is a discrepancy between the two, it is recognized as a gap.
Gap Classification: Once a gap is identified, it is classified based on its size (as a percentage of the previous close price) and direction (bullish or bearish). The gap is then added to a specific category based on its size.
Gap Tracking: The script keeps track of all identified gaps using arrays and user-defined types, storing details like their size, direction, and whether they have been filled.
Gap Filling: The script continuously monitors the price to check if any previously identified gaps get filled. A gap is considered filled if the price moves back into the gap area.
Statistics and Alerts: The script calculates various statistics like the total number of gaps, the number of filled gaps, the average number of bars it takes for a gap to fill, and the percentage of gaps that get filled. It also generates alerts when a new gap is identified or an existing gap gets filled.
█ How to Use
Gaps are often classified into four main types:
Common Gaps: These are not associated with any major news and are likely to get filled quickly.
Breakaway Gaps: These occur at the end of a price pattern and signal the beginning of a new trend.
Runaway Gaps: Also known as continuation gaps, these occur in the middle of a trend and signal a surge in interest in the stock.
Exhaustion Gaps: These occur near the end of a price pattern and signal a final attempt to hit new highs or lows.
The Gap Statistics (Zeiierman) indicator enhances a trader's ability to use gaps in their trading strategy in several ways:
Statistical Analysis: Traders get comprehensive statistics on gaps, such as their size, direction, and how often they get filled.
Performance Tracking: The indicator tracks how many bars it typically takes for a gap to fill, providing traders with an average timeframe for gap closure.
█ Settings
Display Gaps: Choose to display "All Gaps," "Active Gaps," or "None."
Show Gap Size: Toggle on/off the display of the gap size.
-----------------
Disclaimer
The information contained in my Scripts/Indicators/Ideas/Algos/Systems does not constitute financial advice or a solicitation to buy or sell any securities of any type. I will not accept liability for any loss or damage, including without limitation any loss of profit, which may arise directly or indirectly from the use of or reliance on such information.
All investments involve risk, and the past performance of a security, industry, sector, market, financial product, trading strategy, backtest, or individual's trading does not guarantee future results or returns. Investors are fully responsible for any investment decisions they make. Such decisions should be based solely on an evaluation of their financial circumstances, investment objectives, risk tolerance, and liquidity needs.
My Scripts/Indicators/Ideas/Algos/Systems are only for educational purposes!

Session Gap Fill [LuxAlgo]The Session Gap Fill tool detects and highlights filled and unfilled price gaps between regular sessions. It features a dashboard with key statistics about the detected gaps.
The tool is highly customizable, allowing users to filter by different types of gaps and customize how they are displayed on the chart.
🔶 USAGE
By default, the tool detects all price gaps between sessions. A price gap is defined as a difference between the opening price of one session and the closing price of the previous session. In this case, the tool uses the opening price of the first bar of the session against the closing price of the previous bar.
A bullish gap is detected when the session open price is higher than the last close, and a bearish gap is detected when the session open price is lower than the last close.
Gaps represent a change in market sentiment, a difference in what market participants think between the close of one trading session and the open of the next.
What is useful to traders is not the gap itself, but how the market reacts to it.
Unfilled gaps occur when prices do not return to the previous session's closing price.
Filled gaps occur when prices come back to the previous session's close price.
By analyzing how markets react to gaps, traders can understand market sentiment, whether different prices are accepted or rejected, and take advantage of this information to position themselves in favor of bullish or bearish market sentiment.
Next, we will cover the Gap Type Filter and Statistics Dashboard.
🔹 Gap Type Filter
Traders can choose from three options: display all gaps, display only overlapping gaps, or display only non-overlapping gaps. All gaps are displayed by default.
An overlapping gap is defined when the first bar of the session has any price in common with the previous bar. No overlapping gap is defined when the two bars do not share any price levels.
As we will see in the next section, there are clear differences in market behavior around these types of gaps.
🔹 Statistics Dashboard
The Statistics Dashboard displays key metrics that help traders understand market behavior around each type of gap.
Gaps: The percentage of bullish and bearish gaps.
Filled: The percentage of filled bullish and bearish gaps.
Reversed: The percentage of filled gaps that move in favor of the gap
Bars Avg.: The average number of bars for a gap to be filled.
Now, let's analyze the chart on the left of the image to understand those stats. These are the stats for all gaps, both overlapping and non-overlapping.
Of the total, bullish gaps represent 55%, and bearish ones represent 44%. The gap bias is pretty balanced in this market.
The second statistic, Filled, shows that 63% of gaps are filled, both bullish and bearish. Therefore, there is a higher probability that a gap will be filled than not.
The third statistic is reversed. This is the percentage of filled gaps where prices move in favor of the gap. This applies to filled bullish gaps when the close of the session is above the open, and to filled bearish gaps when the close of the session is below the open. In other words, first there is a gap, then it fills, and finally it reverses. As we can see in the chart, this only happens 35% of the time for bullish gaps and 29% of the time for bearish gaps.
The last statistic is Bars Avg., which is the average number of bars for a gap to be filled. On average, it takes between one and two bars for both bullish and bearish gaps. On average, gaps fill quickly.
As we can see on the chart, selecting different types of gaps yields different statistics and market behavior. For example, overlapping gaps have a greater than 90% chance of being filled, whereas non-overlapping gaps have a less than 40% chance.
🔶 SETTINGS
Gap Type: Select the type of gap to display.
🔹 Dashboard
Dashboard: Enable or disable the dashboard.
Position: Select the location of the dashboard.
Size: Select the dashboard size.
🔹 Style
Filled Bullish Gap: Enable or disable this gap and choose the color.
Filled Bearish Gap: Enable or disable this gap and choose the color.
Unfilled Gap: Enable or disable this gap and choose the color.
Max Deviation Level: Enable or disable this level and choose the color.
Open Price Level: Enable or disable this level and choose the color.

Unfilled Gaps TrackerIndicator Description: Unfilled Gaps Tracker
Overview:
The Unfilled Gaps Tracker is a powerful TradingView indicator designed to identify and visualize unfilled gaps on a price chart. This indicator highlights bullish and bearish gaps with continuous horizontal bars, helping traders quickly identify potential areas of support and resistance.
Features:
Gap Detection: Automatically detects bullish gaps (where the current low is higher than the previous close) and bearish gaps (where the current high is lower than the previous close).
Continuous Visualization: Displays gaps as horizontal bars extending to the most recent candle. Bullish gaps are filled with green, and bearish gaps are filled with red.
Single Label per Gap: Each gap is labeled once, ensuring a clean and uncluttered chart. Labels move with the gap's right edge as new bars are added.
Dynamic Updates: Gaps are dynamically updated, and the visualization adjusts as new bars are added. Gaps are removed from the chart once they are filled by subsequent price action.
Multiple Gaps: Tracks multiple gaps simultaneously, providing a comprehensive view of unfilled gaps over time.
Usage:
Adding the Indicator:
To add the Unfilled Gaps Tracker to your chart, search for "Unfilled Gaps Tracker" in the TradingView indicators menu and apply it to your desired chart.
Interpreting the Indicator:
Bullish Gaps: Represented by green horizontal bars with the label "Bull Gap." These indicate areas where the price gapped up, potentially acting as future support levels.
Bearish Gaps: Represented by red horizontal bars with the label "Bear Gap." These indicate areas where the price gapped down, potentially acting as future resistance levels.
Trading Strategy:
Use the identified gaps to inform your trading strategy. Unfilled bullish gaps can be potential buy zones, while unfilled bearish gaps can be potential sell zones.
Monitor how the price interacts with these gaps. A gap fill (where the price moves back to close the gap) can provide valuable trading signals.

FVG Maxing - Fair Value Gaps, Equilibrium, and Candle Patterns
What this script does
This open-source indicator highlights 3-candle fair value gaps (FVGs) on the active chart timeframe, draws their midpoint ("equilibrium") line, tracks when each gap is mitigated, and optionally marks simple candle patterns (engulfing and doji) for confluence. It is intended as an educational tool to study how price interacts with imbalances.
3-candle bullish and bearish FVG zones drawn as forward-extending boxes.
Equilibrium line at 50% of each gap.
Different styling for mitigated vs unmitigated gaps.
Compact statistics panel showing how many gaps are currently active and filled.
Optional overlays for bullish/bearish engulfing patterns and doji candles.
1. FVG logic (3-candle gaps)
The script focuses on a strict 3-candle definition of a fair value gap:
Three consecutive candles with the same body direction.
The wick of candle 3 is separated from the wick of candle 1 (no overlap).
A bullish gap is created when price moves up fast enough to leave a gap between candle 1 and 3. A bearish gap is the mirror case to the downside.
In Pine, the core detection looks like this:
// Three candles with the same body direction
bull_seq = close > open and close > open and close > open
bear_seq = close < open and close < open and close < open
// Wick gap between candle 1 and candle 3
bull_gap = bull_seq and low > high
bear_gap = bear_seq and high < low
// Final FVG flags
is_bull_fvg = bull_gap
is_bear_fvg = bear_gap
For each detected FVG:
Bullish FVG range: from high up to low (gap below current price).
Bearish FVG range: from low down to high (gap above current price).
Each zone is stored in a custom FVGData structure so it can be updated when price later trades back inside it.
2. Equilibrium line (0.5 of the gap)
Every FVG box gets an optional equilibrium line plotted at the midpoint between its top and bottom:
eq_level = (top + bottom) / 2.0
right_index = extend_boxes ? bar_index + extend_length_bars : bar_index
bx = box.new(bar_index - 2, top, right_index, bottom)
eq_ln = line.new(bar_index - 2, eq_level, right_index, eq_level)
line.set_style(eq_ln, line.style_dashed)
line.set_color(eq_ln, eq_color)
You can use this line as a neutral “fair value” reference inside the zone, or as a simple way to think in terms of premium/discount within each gap.
3. Mitigation rules and styling
Each FVG stays active until price trades back into the gap:
Bullish FVG is considered mitigated when the low touches or moves below the top of the gap.
Bearish FVG is considered mitigated when the high touches or moves above the bottom of the gap.
When that happens, the script:
Marks the internal FVGData entry as mitigated.
Softens the box fill and border colors.
Optionally updates the label text from "BULL EQ / BEAR EQ" to "BULL FILLED / BEAR FILLED".
Can hide mitigated zones almost completely if you only want to see unfilled imbalances.
This allows you to distinguish between current areas of interest and zones that have already been traded through.
4. Candle pattern overlays (engulfing and doji)
For additional confluence, the script can mark simple candle patterns on top of the FVG view:
Bullish engulfing — current candle body fully wraps the previous bearish body and is larger in size.
Bearish engulfing — current candle body fully wraps the previous bullish body and is larger in size.
Doji — candles where the real body is small relative to the full range (high–low).
The detection is based on basic body and range geometry:
curr_body = math.abs(close - open)
prev_body = math.abs(close - open )
curr_range = high - low
body_ratio = curr_range > 0 ? curr_body / curr_range : 1.0
bull_engulfing = close > open and close < open and open <= close and close >= open and curr_body > prev_body
bear_engulfing = close < open and close > open and open >= close and close <= open and curr_body > prev_body
is_doji = curr_range > 0 and body_ratio <= doji_body_ratio
On the chart, they appear as:
Small triangle markers below bullish engulfing candles.
Small triangle markers above bearish engulfing candles.
Small circles above doji candles.
All three overlays are optional and can be turned on or off and recolored in the CANDLE PATTERNS group of inputs.
5. Inputs overview
The script organizes settings into clear groups:
DISPLAY SETTINGS : Show bullish/bearish FVGs, show/hide mitigated zones, box extension length, box border width, and maximum number of boxes.
EQUILIBRIUM : Toggle equilibrium lines, color, and line width.
LABELS : Enable labels, choose whether to label unmitigated and/or mitigated zones, and select label size.
BULLISH COLORS / BEARISH COLORS : Separate fill and border colors for bullish and bearish gaps.
MITIGATED STYLE : Opacity used when a gap is marked as mitigated.
STATISTICS : Toggle the on-chart FVG statistics panel.
CANDLE PATTERNS : Show engulfing patterns, show dojis, colors, and the body-to-range threshold that defines a doji.
6. Statistics panel
An optional table in the corner of the chart summarizes the current state of all tracked gaps:
Total number of FVGs still being tracked.
Number of bullish vs bearish FVGs.
Number of unfilled vs mitigated FVGs.
Simple fill rate: percentage of tracked FVGs that have been marked as mitigated.
This can help you study how a particular market tends to treat gaps over time.
7. How you might use it (examples)
These are usage ideas only, not recommendations:
Study how often your symbol mitigates gaps and where inside the zone price tends to react.
Use higher-timeframe context and then refine entries near the equilibrium line on your trading timeframe.
Combine FVG zones with basic candle patterns (engulfing/doji) as an extra visual anchor, if that fits your process.
Hope you enjoy, give your feedback in the comments!
- officialjackofalltrades

BTC CME Gaps Detector [SwissAlgo]BTC CME Gaps Detector
Track Unfilled Gaps & Identify Price Magnets
------------------------------------------------------
Overview
The BTC CME Gap Detector identifies and tracks unfilled price gaps on any timeframe (1-minute recommended for scalping) to gauge potential trading bias.
Verify Gap Behavior Yourself : Use TradingView's Replay Mode on the 1-Minute chart to observe how the price interacts with gaps. Load the BTC1! ticker (Bitcoin CME Futures), enable Replay Mode, and play forward through time (for example: go back 15 days). You may observe patterns such as price frequently returning to fill gaps, nearest gaps acting as near-term targets, and gaps serving as potential support/resistance zones. Some gaps may fill quickly, while others may remain open for longer periods. This hands-on analysis lets you independently assess how gaps may influence price movement in real market conditions and whether you may use this indicator as a complement to your trading analysis.
------------------------------------------------------
Purpose
Price gaps occur when there is a discontinuity between consecutive candles - when the current candle's low is above the previous candle's high (gap up), or when the current candle's high is below the previous candle's low (gap down).
This indicator identifies and tracks these gaps on any timeframe to help traders:
Identify gap zones that may attract price (potential "price magnets")
Monitor gap fill progression
Assess potential directional bias based on nearest unfilled gaps (long, short)
Analyze market structure and liquidity imbalances
------------------------------------------------------
Why Use This Indicator?
Universal Gap Detection : Identifies all gaps on any timeframe (1-minute, hourly, daily, etc.)
Multi-Candle Mitigation Tracking : Detects gap fills that occur across multiple candles
Distance Analysis : Shows percentage distance to nearest bullish and bearish gaps
Visual Representation : Color-coded boxes indicate gap status (active vs. mitigated)
Age Filtering : Option to display only gaps within specified time periods (3/6/12/24 months), as older gaps may lose relevance
ATR-Based Sizing : Minimum gap size adjusts to instrument volatility to filter noise (i.e. small gaps)
------------------------------------------------------
Trading Concept
Gaps represent price zones where no trading occurred. Historical market behavior suggests that unfilled gaps may attract price action as markets tend to revisit areas of incomplete price discovery. This phenomenon creates potential trading opportunities:
Bullish gaps (above current price) may act as upside targets where the price could move to fill the gap
Bearish gaps (below current price) may act as downside targets where price could move to fill the gap
The nearest gap often provides directional bias, as closer gaps may have a higher probability of being filled in the near term
This indicator helps quantify gap proximity and provides a visual reference for these potential target zones.
EXAMPLE
Step 1: Bearish Gaps Appear Below Price
Step 2: Price Getting Close to Fill Gap
Step 3: Gap Mitigated Gap
------------------------------------------------------
Recommended Setup
Timeframe: 1-minute chart recommended for maximum gap detection frequency. Works on all timeframes (higher timeframes will show fewer, larger gaps).
Symbol: Any tradable instrument. Originally designed for BTC1! (CME Bitcoin Futures) but compatible with all symbols.
Settings:
ATR Length: 14 (default)
Min Gap Size: 0.5x ATR (adjust based on timeframe and noise level)
Gap Age Limit: 3 months (configurable)
Max Historical Gaps: 300 (adjustable 1-500)
------------------------------------------------------
How It Works
Gap Detection : Identifies price discontinuities on every candle where:
Gap up: current candle low > previous candle high
Gap down: current candle high < previous candle low
Minimum gap size filter (ATR-based) eliminates insignificant gaps
Mitigation Tracking : Monitors when price touches both gap boundaries. A gap is marked as filled when the price has touched both the top and bottom of the gap zone, even if this occurs across multiple candles.
Visual Elements :
Green boxes: Unfilled gaps above current price (potential bullish targets)
Red boxes: Unfilled gaps below current price (potential bearish targets)
Gray boxes: Filled gaps (historical reference)
Labels: Display gap type, price level, and distance percentage
Analysis Table: Shows :
Distance % to nearest bullish gap (above price)
Distance % to nearest bearish gap (below price)
Trade bias (LONG if nearest gap is above, SHORT if nearest gap is below)
------------------------------------------------------
Key Features
Detects gaps on any timeframe (1m, 5m, 1h, 1D, etc.)
Boxes extend 500 bars forward for active gaps, stop at the fill bar for mitigated gaps
Real-time distance calculations update on every candle
Configurable age filter removes outdated gaps
ATR multiplier ensures gap detection adapts to market volatility and timeframe
------------------------------------------------------
Disclaimer
This indicator is provided for informational and educational purposes only.
It does not constitute financial advice, investment recommendations, or trading signals. The concept that gaps attract price is based on historical observation and does not guarantee future results.
Gap fills are not certain - gaps may remain unfilled indefinitely, or the price may reverse before reaching a gap. This indicator should not be used as the sole basis for trading decisions.
All trading involves substantial risk, including the potential loss of principal. Users should conduct their own research, apply proper risk management, test strategies thoroughly, and consult with qualified financial professionals before making trading decisions.
The authors and publishers are not responsible for any losses incurred through the use of this indicator.

Etherium CME gaps multi-timeframe auto finderThis indicator is a powerful tool that automatically detects and visualizes price gaps (Gaps) in the Ethereum CME futures market across multiple timeframes and also provides alert functionality. Price gaps occur when the futures market is inactive for a certain period, often acting as potential support or resistance zones.
What is an Ethereum CME Gap?
CME (Chicago Mercantile Exchange) is one of the largest derivatives exchanges globally. The Ethereum CME futures market is closed on weekends and certain holidays. When the market reopens, a price difference may occur between the previous closing price and the new opening price, referred to as a "CME Gap."
Key Features of the Indicator
Multi-timeframe gap detection: Detects and displays gaps across 5m, 15m, 30m, 1h, 4h, 1d timeframes simultaneously.
Customizable CME Symbol: You can specify Ethereum CME futures symbols, such as ETH1!.
Two gap price display methods:
CME_price: Displays the gap based on the actual price levels in the CME futures market.
Chart_price: Adjusts the gap to match the price levels on the chart being viewed (e.g., spot market). This helps visualize the impact of futures gaps on the spot market.
Visual customization:
Individual color settings for bullish/bearish gap boxes for each timeframe.
Adjust the extension (display length) of gap boxes in bars.
Configure label display, position, text size, background, and text color.
Highlight significant gaps: Emphasize gaps above a specified percentage with a unique color and border thickness.
Alert functionality: Receive notifications when a gap is detected, with options to enable alerts only for specific timeframes.
Why CME Gaps Matter
Traders often consider CME gaps as significant price zones.
Gap Fill: Historical data shows that many gaps tend to get "filled" over time, meaning the price returns to the gap area, reaching the start or end point of the gap.
Support/Resistance: Unfilled gaps can serve as potential support (Bullish Gap) or resistance (Bearish Gap) zones.
Bullish Gap: Occurs when the current opening price is higher than the previous closing price. Typically leaves an unfilled gap below (previous high), which can act as potential support.
Bearish Gap: Occurs when the current opening price is lower than the previous closing price. Typically leaves an unfilled gap above (previous low), which can act as potential resistance.
How to Use the Indicator
Add Indicator on TradingView: Click the "Indicators" button on the TradingView chart.
Find the indicator in "My Scripts" or "Invite-Only Scripts" and add it to the chart.
Adjust Settings: Once the indicator is added, click the settings (gear) icon to adjust inputs.
CME Symbol (ETH): ETH1! is typically the default symbol for Ethereum CME futures. Confirm based on your broker or data feed.
Min gap %: Set the minimum gap size in percentage; smaller gaps will not be displayed.
Select Exchanges to Display gap price: Choose between "CME_price" or "Chart_price." For viewing futures gaps on a spot chart, "Chart_price" is recommended.
Show Xm/h/d gap boxes: Select which timeframe gap boxes to display.
Color, Extension, Label settings: Customize the visual aspects of gap boxes and labels.
Highlight gap % (>=): Set the minimum percentage for highlighting significant gaps.
Enable Alerts: Choose whether to receive alerts when a gap is detected.
Alert Timeframe: Select whether alerts apply to all timeframes or specific ones only.
Chart Analysis
Once the indicator is applied, gap boxes for the selected timeframes appear on the chart.
Green shades indicate Bullish Gaps, and red shades indicate Bearish Gaps (default green can be customized, and bearish gap color can be set separately).
Highlighted gaps may carry higher significance and should be monitored carefully.
Potential trading opportunities can be explored when the price approaches or attempts to fill a gap.
Usage Strategies (Examples)
Support/Resistance Confirmation: The lower boundary of a bullish gap can act as potential support, while the upper boundary of a bearish gap can act as potential resistance. Observe for reversals or breakouts when price reaches these areas.
Retracement Trading: Trade when the price returns to fill a gap after leaving it through a sharp move up or down.
Multi-timeframe Analysis: Gaps overlapping across multiple timeframes can form stronger support/resistance zones.
Considerations
* "Gap Filled" Condition: The indicator does not draw a gap if it determines that the gap has already been filled by the current bar’s low (bullish gap) or high (bearish gap).
* Tool Only: This indicator is a gap detection tool and should not be used alone for trading decisions. Always combine with other technical analysis tools and your trading strategy.
* Past Data ≠ Future Guarantee: Historical gap fill trends do not guarantee future occurrences.
This indicator allows effective tracking of Ethereum CME futures gaps and provides valuable insights for enhancing your trading strategy.

Greer Gap# Greer Gap Indicator (No mitigation: i.e. removing false signals)
## Summary
The **Greer Gap Indicator** identifies **Fair Value Gaps (FVGs)** and introduces specialized **Greer Bull Gaps (Blue)** and **Greer Bear Gaps (Orange)** to highlight high-probability trading opportunities. Unlike traditional FVG indicators, it avoids hindsight bias by not removing historical gaps based on future price action, ensuring transparency in signal accuracy. Built upon LuxAlgo’s FVG logic, it adds unique filtering: only the first Greer Gap after an opposite gap is plotted if its level (min for Bull, max for Bear) is not higher/lower than the previous Greer Gap of the same type, while all valid gaps are recorded for comparison. Traders can use these gaps as support/resistance or entry signals, customizable via timeframe, look back, and display options.
## Description
This indicator detects and displays **Fair Value Gaps (FVGs)** on the chart, with a focus on specialized **Greer Gaps**:
- **Bullish Gaps (Green)**: Areas where the low of the current candle is above the high of a previous candle (look back period), indicating potential upward momentum.
- **Bearish Gaps (Red)**: Areas where the high of the current candle is below the low of a previous candle, indicating potential downward momentum.
- **Greer Bull Gaps (Blue)**: A bullish gap that is above the latest bearish gap's max. Only the first such gap after a bearish gap is plotted if it meets criteria (not higher than the previous Greer Bull Gap's min), but all valid ones are recorded for comparison.
- **Greer Bear Gaps (Orange)**: A bearish gap that is below the latest bullish gap's min. Only the first such gap after a bullish gap is plotted if it meets criteria (not lower than the previous Greer Bear Gap's max), but all valid ones are recorded.
## How It Works
The script uses a dynamic look back period to detect FVGs. It maintains a record of all detected gaps and applies additional logic for Greer Gaps:
- **Greer Bull Gaps**: Checks if the new bullish gap's min is above the latest bearish gap's max. Plots only if it's the first since the last bearish gap and its min is <= previous Greer Bull min (or first one).
- **Greer Bear Gaps**: Checks if the new bearish gap's max is below the latest bullish gap's min. Plots only if it's the first since the last bullish gap and its max is >= previous Greer Bear max (or first one).
- **Resets**: A new bearish gap resets the Greer Bull Gap flag, and a new bullish gap resets the Greer Bear Gap flag.
## How to Use
- **Timeframe**: Set a higher timeframe (e.g., 'D' for daily) to detect gaps from that timeframe on the current chart.
- **Look back Period**: Adjust to change gap detection sensitivity (default: 34). Use 2 if you want to compare to LuxAlgo
- **Extend**: Controls how far right the gap boxes extend.
- **Show Options**: Toggle visibility of all bullish/bearish gaps or Greer Gaps.
- **Colors**: Customize colors for each gap type.
- **Application**: Use Greer Gaps as potential support/resistance levels or entry signals, but combine with other analysis for confirmation.
## Originality and Credits
This script is inspired by and builds upon the **"Fair Value Gap "** indicator by LuxAlgo (available on TradingView: ()).
**Credits**: Thanks to LuxAlgo for the core FVG detection logic.
**Significant Changes**:
- Added **Greer Bull and Bear Gap** logic for filtered, directional gaps with reset mechanisms.
- Introduced recording of all valid Greer Gaps without plotting all, to compare levels without hindsight bias.
- **No mitigation/removal of gaps**: Unlike LuxAlgo's approach, which mitigates (removes or alters) gaps based on future price action (e.g., when filled), this can create a hindsight bias where incorrect signals disappear over time. If a signal is used for a trade and later removed due to new data, it doesn't reflect real-time performance accurately. The Greer Gap avoids this by using gap comparisons to validate signals without altering historical boxes, ensuring transparency in when signals were right or wrong.

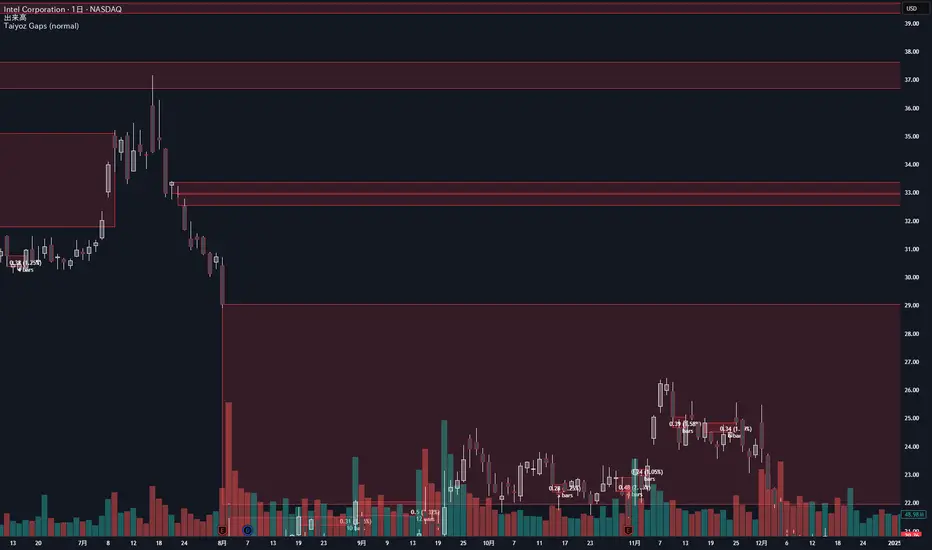
Taiyoz Gaps1. Purpose
Tyoz Gaps highlights “gaps” between yesterday’s close and today’s open directly on your chart. A gap occurs when the opening price is significantly above or below the prior bar’s close. By drawing persistent boxes around each gap, you can instantly see where price left a void and monitor when (or if) that void gets completely filled.
2. Gap Detection Logic
Threshold: A gap is only detected if the open-to-previous-close difference exceeds a user-defined “Minimal Deviation” (percentage of the 14-bar average high-low range).
Direction:
Gap Up: today’s open > yesterday’s close
Gap Down: today’s open < yesterday’s close
3. Box Drawing
For each detected gap, the script draws a rectangular box spanning from yesterday’s close level to today’s open level.
Border & Fill Colors are configurable separately for up-gaps and down-gaps.
Boxes extend to the right as new bars form.
4. Display & Filtering Options
Show Gap Up / Show Gap Down toggles let you hide bullish or bearish gaps independently.
Max Number of Gaps: Limits how many boxes remain on-screen; oldest boxes are removed when the limit is exceeded.
Limit Max Gap Trail Length: Optionally force-close any gap box after a given number of bars, even if unfilled.
5. Closing Logic
Full-Fill Only: A gap box stays visible until price fully “fills” it—i.e., for an up-gap, price must exceed the top edge (yesterday’s close); for a down-gap, price must cross below the bottom edge.
Once filled, the box is removed and a “Gap Closed” alert flag is set.
6. Labels & Alerts
Each active gap can optionally show a label at the gap’s lower edge containing:
Absolute size (in price points) and percentage of the gap
Bar count since the gap formed
Label Text Color and Label Text Size are both user-configurable.
Two built-in alertcondition()s fire when a new gap appears or when a gap closes.
Volumetric Fair Value Gaps [AlgoAlpha]🎯 Introducing the Volumetric Fair Value Gaps by AlgoAlpha 🎯
Embrace the power of volume and price action with the Volumetric Fair Value Gaps (VFVG) indicator, designed meticulously by AlgoAlpha. This innovative tool enhances your charting capabilities by highlighting fair value gaps in real-time, facilitating superior market entry and exit decisions. 🚀📈
🔍 Key Features:
🔹 Fair Value Gap Detection: Utilizes price action and volume to identify significant fair value gaps, offering potential high-probability trading opportunities.
🔹 Adjustability: Customize the sensitivity with 'FVG Noise Reduction Length' and 'Noise Reduction Factor' to match the volatility and characteristics of the asset being traded.
🔹 Visual Appeal: Displays bullish gaps in a soothing Bullish Color and bearish gaps in a striking Bearish Color, making it easy to spot and analyze trends on the fly.
🔹 Overlay Feature: Plots directly on the price chart for seamless integration and analysis.
🌟 Quick Guide to Using the Volumetric Fair Value Gaps Indicator:
🛠 Add the Indicator: Add the indicator to favourites and set it up with your desired settings.
📊 Market Analysis: Watch for the appearance of colored boxes (blue for bearish, gray for bullish) which represent the fair value gaps. These are high-probability areas for reversals or continuations. FVGs with higher volume are implied to induce a stronger reaction on price.
🔔 Alerts: Set up alerts to notify you when new gaps are detected, ensuring you never miss out on potential trades!
🛠 How It Works:
The Volumetric Fair Value Gaps (VFVG) indicator identifies significant price gaps that are not just based on price action but are also substantiated by volume, which are often overlooked in typical analyses. It operates by comparing the current candle’s price range against historical averages and is calculated over a user-defined period, displayed with volume for further insights. For a gap to be recognized as significant (either bullish or bearish), it must exceed a certain size relative to these averages, which can be adjusted for sensitivity using the provided settings. Bullish gaps are identified when the current low is higher than the second previous high after surpassing the threshold, and bearish gaps are marked when the current high is below the second previous low, similarly surpassing the threshold. This dual-confirmation (volume and price deviation) approach minimizes false signals and enhances the reliability of identified gaps.
Maximize your trading strategy with the VFVG Indicator by AlgoAlpha and turn those gaps into opportunities! 🌈✨

Volumatic Fair Value Gaps [BigBeluga]🔵 OVERVIEW
The Volumatic Fair Value Gaps indicator detects and plots size-filtered Fair Value Gaps (FVGs) and immediately analyzes the bullish vs. bearish volume composition inside each gap. When an FVG forms, the tool samples volume from a 10× lower timeframe , splits it into Buy and Sell components, and overlays two compact bars whose percentages always sum to 100%. Each gap also shows its total traded volume . A live dashboard (top-right) summarizes how many bullish and bearish FVGs are currently active and their cumulative volumes—offering a quick read on directional participation and trend pressure.
🔵 CONCEPTS
FVGs (Fair Value Gaps) : Imbalance zones between three consecutive candles where price “skips” trading. The script plots bullish and bearish gaps and extends them until mitigated.
Size Filtering : Only significant gaps (by relative size percentile) are drawn, reducing noise and emphasizing meaningful imbalances.
// Gap Filters
float diff = close > open ? (low - high ) / low * 100 : (low - high) / high *100
float sizeFVG = diff / ta.percentile_nearest_rank(diff, 1000, 100) * 100
bool filterFVG = sizeFVG > 15
Volume Decomposition : For each FVG, the indicator inspects a 10× lower timeframe and aggregates volume of bullish vs. bearish candles inside the gap’s span.
100% Split Bars : Two inline bars per FVG display the % Bull and % Bear shares; their total is always 100%.
Total Gap Volume : A numeric label at the right edge of the FVG shows the total traded volume associated with that gap.
Mitigation Logic : Gaps are removed when price closes through (or touches via high/low—user-selectable) the opposite boundary.
Dashboard Summary : Counts and sums the active bullish/bearish FVGs and their total volumes to gauge directional dominance.
🔵 FEATURES
Bullish & Bearish FVG plotting with independent color controls and visibility toggles.
Adaptive size filter (percentile-based) to keep only impactful gaps.
Lower-TF volume sampling at 10× faster resolution for more granular Buy/Sell breakdown.
Per-FVG volume bars : two horizontal bars showing Bull % and Bear % (sum = 100%).
Per-FVG total volume label displayed at the right end of the gap’s body.
Mitigation source option : choose close or high/low for removing/invalidating gaps.
Overlap control : older overlapped gaps are cleaned to avoid clutter.
Auto-extension : active gaps extend right until mitigated.
Dashboard : shows count of bullish/bearish gaps on chart and cumulative volume totals for each side.
Performance safeguards : caps the number of active FVG boxes to maintain responsiveness.
🔵 HOW TO USE
Turn on/off FVG types : Enable Bullish FVG and/or Bearish FVG depending on your focus.
Tune the filter : The script already filters by relative size; if you need fewer (stronger) signals, increase the percentile threshold in code or reduce the number of displayed boxes.
Choose mitigation source :
close — stricter; gap is removed when a closing price crosses the boundary.
high/low — more sensitive; a wick through the boundary mitigates the gap.
Read the per-FVG bars :
A higher Bull % inside a bullish gap suggests constructive demand backing the imbalance.
A higher Bear % inside a bearish gap suggests supply is enforcing the imbalance.
Use total gap volume : Larger totals imply more meaningful interest at that imbalance; confluence with structure/HTF levels increases relevance.
Watch the dashboard : If bullish counts and cumulative volume exceed bearish, market pressure is likely skewed upward (and vice versa). Combine with trend tools or market structure for entries/exits.
Optional: hide volume bars : Disable Volume Bars when you want a cleaner FVG map while keeping total volume labels and the dashboard.
🔵 CONCLUSION
Volumatic Fair Value Gaps blends precise FVG detection with lower-timeframe volume analytics to show not only where imbalances exist but also who powers them. The per-gap Bull/Bear % bars, total volume labels, and the cumulative dashboard together provide a fast, high-signal read on directional participation. Use the tool to prioritize higher-quality gaps, align with trend bias, and time mitigations or continuations with greater confidence.

BTC CME Futures Gaps (BTCGapHunt_CME)BTC CME Futures Gaps Indicator
Overview
This indicator visualises price gaps between the daily close and open of Bitcoin CME futures (CME:BTC1!). These gaps are often revisited ("filled") by market price action and may serve as technical targets.
Thanks
... to Maven and the Blockchain Masons (x.com/Masons_DAO) to push me on this topic.
What Is a CME Gap?
CME Bitcoin Futures do not trade 24/7. Gaps form when the market reopens at a different price than where it last closed.
Gaps are often used as support/resistance or liquidity targets.
This indicator tracks, visualises, and alerts on these gaps.
Key Features
Automatic gap detection using daily open/close on CME:BTC1!
Dynamic gap size threshold based on ATR (Average True Range)
Highlight unfilled gaps and track partial fills visually
Alerts for gap formation and fill events
Parameter overlay showing real-time settings
Supported and Overrideable Parameters
ATR Length: Defines the lookback period for ATR calculation (default: 14)
Gap Size Multiplier: Multiplies the ATR to set the dynamic gap threshold (default: 1.0)
Proximity Threshold: Price distance from gap edge to consider it filled (default: 100 USD)
Max Gaps Tracked: Maximum number of concurrent gaps shown (default: 50)
Alerts Enabled: Toggle alerts for gap formation and gap fill events
How the Gap Size Is Calculated
Minimum Gap Size = ATR(14) * Gap Size Multiplier
ATR Length and Gap Size Multiplier are configurable.
Gap threshold adjusts dynamically with market volatility.
Visual Guide
Red Box: Fully unfilled gap
Lemon Yellow Box: Partially filled gap
Right Margin Boxes: Snapshot of unfilled gaps for quick access
Top-Right Panel: Current ATR, Gap Size, Thresholds, etc.
Alerts
Gap Formed: A new gap is detected.
Gap Filled: The gap is either partially or fully filled.
Recommended Timeframes
1H, 4H, 1D (best resolution)
Designed for BTC spot/perpetual charts (e.g., BTCUSD, BTCUSDT)
How To Use
Add the script to your BTC chart.
Monitor red/yellow boxes for unfilled gaps.
Check config panel for current threshold and settings.
Enable alerts via TradingView for real-time updates.
Notes
Up to 50 gaps are tracked (adjustable).
Data source: CME futures via request.security.
All visuals and alerts are time-synced with your chart.
Disclaimer
This script is for educational purposes only. Trade at your own risk.

Fair Value Gaps
Introducing the Fair Value Gaps (FVG) Indicator by OmegaTools, a distinctive and analytical tool designed for TradingView. This script meticulously identifies and visualizes fair value gaps within the market, offering traders a nuanced understanding of potential price movement areas that are not immediately apparent through traditional analysis.
Concept and Methodology:
Fair Value Gaps are identified as areas on a chart where the price has skipped over, leaving a 'gap' that has not been filled. These gaps often occur due to sudden market movements triggered by news events, changes in market sentiment, or large orders that move the price significantly. The FVG Indicator detects these gaps by analyzing price action and identifying discrepancies between high and low prices over a specified period. This approach is rooted in the belief that markets tend to return to these unfilled spaces, providing potential opportunities for traders.
How It Works:
The indicator scans the chart for gaps between the high of one session and the low of the next (or vice versa), marking these gaps visually for easy identification.
Users can customize the lookback period to adjust the sensitivity of the indicator to recent versus historical data.
The FVG Indicator employs color-coding to distinguish between bullish and bearish gaps, allowing traders to quickly gauge market sentiment around these gaps.
Using the FVG Indicator:
Apply the indicator to any chart on TradingView and adjust the input settings, including the extension of FVGs and aesthetic preferences like color, to suit your analysis style.
Use the visual cues provided by the FVG Indicator to identify potential areas where the market may move to fill the gaps.
Combine the insights from the FVG Indicator with other technical analysis tools or fundamental analysis to validate potential trading opportunities.
Originality and Usefulness:
The FVG Indicator stands out due to its focused approach to identifying and visualizing fair value gaps, a concept that is often overlooked in conventional market analysis. By providing a clear visual representation of these gaps, the indicator adds depth to market analysis, aiding in the identification of potential price reversal zones or continuation signals.
Disclaimer and Responsible Use:
The financial markets are complex and unpredictable. The FVG Indicator is designed to offer analytical insights and should be used as part of a comprehensive trading strategy. It does not guarantee profits or predict market movements with absolute certainty. Traders are encouraged to use this tool judiciously, alongside proper risk management practices. Remember, past performance does not guarantee future results, and trading involves risks, including the potential loss of investment.

(Quartile Vol.; Vol. Aggregation; Range US Bars; Gaps) [Kioseff]Hello!
This indicator is a multifaceted tool that's, hopefully, useful for price action and volume analysis.
(This script makes use of the newly introduced "text_font" parameter)
With this script you'll have access to:
Range US Chart
Volume Aggregation Chart
Gaps Chart
Volume by Quartile
Consequently, you'll have access to:
First Quartile Volume Threshold
Second Quartile Volume Threshold
Third Quartile Volume Threshold
90th Percentile Volume Threshold
Fourth Quartile Volume Threshold
Q2 - Q1 Dispersion
Q3 - Q2 Dispersion
Q4 - Q3 Dispersion
Quartile Deviation
Interquartile Range
Avg. "n" bar return following "high" volume
Avg. "n" bar positive return following "high" volume
Avg. "n" bar negative following "high" volume
# of Positive Returns Following a Gap
# of Negative Returns Following a Gap
# of Gaps
# of Up Gaps
# of Down Gaps
Average # of bars to fill Up Gaps
Average # of bars to dill Down Gaps
Average Gap Up % increase
Average Gap Down % decrease
Cumulative % increase of all Up Gaps
Cumulative % decrease of all Down Gaps
Sort gaps by distance from price
Hide gaps that price substantially deviates from (gaps will reappear when price trades near the gap)
Segment Range US bars by date
Manually configure Range US price thresholds
Identify "congestion" areas with Range US bars
Range US Levels that must be exceeded for a new Range US bar to produce
Manually configure cumulative volume threshold for Volume Aggregation bars
Segment Volume Aggregation bars by date
Largest Volume Aggregation bar increases
Largest Volume Aggregation bar decreases
Calculate log returns after "high" volume sessions
Quartile Volume
The Quartile Volume portion of the script segments price/volume intervals by quartile.
The image above shows features of the indicator.
For statistics, the following metrics are recorded:
First Quartile
Second Quartile
Third Quartile
90th Percentile
Fourth Quartile
Q2 - Q1 Dispersion
Q3 - Q2 Dispersion
Q4 - Q3 Dispersion
Quartile Deviation
Interquartile Range
Color-coordinated price bars (by volume quartiles)
The percent rank for the volume of the current bar
Avg. "n" bar return following "high" volume
Avg. "n" bar positive return following "high" volume
Avg. "n" bar negative following "high" volume
The script colors bars via gradient.
By default, bars are colored lime when volume for the interval is "high" (exceeds upper quartile thresholds). The greener the bar, the higher the volume for the interval.
Bars are colored red when volume for the interval is "low" (fails to exceed lower quartile thresholds). The redder the bar, the lower the volume for the interval.
Naturally, brownish-colored bars reflect a volume interval that concluded near the median.
The image above exemplifies the process. This feature might be useful to categorize / objectively define high-volume clusters, low-volume clusters, high-volume price moves, low-volume price moves, etc.
For greater precision, you can select to color bars by volume quartile they belong to.
The image above shows color-coordinated price bars. More details shown in the image.
Additionally, you can select to plot the quartile/percentile that a price bar belongs to on the chart.
The image above shows price bars numbered by the volume quartile they belong to.
The script will distinguish successive 90th percentile violations, superimpose a linear regression channel atop the data sequence, and record pertinent statistics.
The image above shows the process.
Lastly, the user can plot an anchored VWAP using a built-in time function.
The image above shows the anchored VWAP.
Range US Chart
A Range US chart operates irrespective of time and volume - simply - bars produce after a user-defined price move is achieved/exceeded in either direction. A range us chart produces “trend candles” and “reversal candles”. A reversal candle always moves against the most immediate bar; a trend candle always moves in favor of the most immediate bar. The user defines the dollar amount price must travel up/down for a trend candle to fulfill, and for a reversal candle to fulfill.
Note: if a “down reversal” candle (red) Is produced, it’s impossible for the next candle to also be a down reversal candle - for the downside move to continue the criteria for a down trend candle must be fulfilled. Similarly, if an “up reversal” candle (green) Is produced, it’s impossible for the next candle to also be an up reversal candle - for the upside move to continue, the criteria for an uptrend trend candle must be fulfilled. Consequently, Range US bars frequently trade at the same level for extended periods. This is intentional, as this chart type is theorized to “filter noise” (whether Range US charts fulfill this theory is to your discretion).
Lastly, if an up trend candle (green) is produced, the next candle cannot be up a reversal up candle - only a trend up candle or reversal down candle can produce - vice versa for a trend down candle (the subsequent candle cannot be a reversal down candle). In this sense, an uptrend continues on successive trend up candles; a down trend continues on successive trend down candles.
The image above exemplifies Range US chart functionality.
The lower-right stats table shows the requisite price move for a "Trend" candle to produce and for a "Reversal" candle to produce.
The default settings for this chart time automatically calculate the required "Trend" candle price move and the required "Reversal" candle price move. However, both settings are configurable.
The image above shows manually configured parameters for a trend bar and reversal bar to produce. This feature allows the user to replicate the Range US chart hosted on extrinsic charting platforms.
However, please consider that this script does not use tick data; 1-minute OHLC data is used for calculations.
Consequently, configuring the trend bar and reversal bar requirement too low may return inaccurate data. For instance, if you set trend candles to form after a $1 price move then trend candles will form if price moves up $1 from a green Range US bar or down $1 from a red Range US bar. This is sufficient for lower priced assets; however, if you were trading, for instance, Bitcoin - a $1 price move can happen numerous times in one minute. This script can’t plot bars and record data until a 1-minute bar closes and a new 1-minute bar opens. Further, if Bitcoin moves up $1 twenty times and down $1 twenty times in a 1-minute bar - your Range US chart will record such variations as one price move. This data is inaccurate and likely useless.
To counter this quandary, a warning message will appear if you configure trend bar price moves or reversal bar price moves too low.
The image above shows the concealable warning message.
The image above is a flow diagram (made with shaky hands) illustrating the Range US bar formation process.
A google search will return additional information on the Range US chart type.
Volume Aggregation Bars
TradingView user and member of the TradingView Discord server @ferreirajames informed me of the Volume Aggregation chart type. The user commented in the "Suggestions" channel for the TradingView Discord server asking for the Volume Aggregation chart type. As an interim fix, I tried my hand at recreating the process, which is available in this script.
Similar to the Range US chart type, Volume Aggregation bars aren’t bound to a time-axis; the bars form after a user-defined, cumulative amount of volume is achieved or exceeded. Consequently, once the cumulative amount of volume is achieved or exceeded - a bar is produced at the corresponding price level.
Underlying theory: The chat type is conducive to identifying price levels where traders are “trapped”. Whether the process adequately distinguishes this circumstance is to your discretion.
The image above exemplifies the Volume Aggregation chart type.
Regardless of the current price, Volume Aggregation bars for after a requisite amount of volume is achieved/exceeded. Tick data isn't used; therefore, remainder values are carry over.
By default, the script automatically calculates a proportional cumulative volume total to dictate the formation of Volume Aggregation bars. However, the cumulative threshold is configurable.
The image above shows Volume Aggregation bars forming subsequent a user-defined cumulative volume total being exceeded.
Note: This chart type uses OHLC data from the timeframe of your chart. Therefore, for instance, setting the volume threshold too low will produce inaccurate, useless data.
A warning message will appear for such occurrence.
Gaps
The indicator incorporates a "Gaps" chart type.
The image above shows accompanying features.
A list of all unfilled gaps is accessible - gaps for this list are sorted by distance from current price.
Partially filled gaps are displayed in the corresponding gap box - the percentage amount the gap was filled is also displayed.
Gap statistics show:
# of Gaps
# of Up Gaps
# of Down Gaps
Average # of bars to fill Up Gaps
Average # of bars to dill Down Gaps
Average Gap Up % increase
Average Gap Down % decrease
Cumulative % increase of all Up Gaps
Cumulative % decrease of all Down Gaps
Naturally, there may be gaps formed thousands of bars ago that aren't close to price. Showing these gaps on the chart will "scrunch" the y-axis and make prices indistinguishable.
I've added a setting that allows the user to hide gaps that are "n" % away from the current price. The gap, if unfilled, will reappear when price trades within the user-defined percentage.
The image above shows an example. There's an unfilled down gap that's "hidden" because the current price is a further % away from price than what I've specified in the settings (1%). When prices trade back within 1% of the gap - it will reappear.
The image above shows the process in action. Prices moved back within 1% (can be any %) of the gap; therefore, it reappeared on the chart.
You can also set the % distance a gap must achieve for it to be considered a gap, recorded and plotted. Additionally, you can select to "visualize" gaps. Similar to the Range US chart and the Volume Aggregation chart, this setting will bars reflecting the most recent sequence of gaps - date and percentage distance of the gap are superimposed atop the bar.
Let me know if there's anything else you'd like included!
Note: The initial compilation time for this script is.... high. However, once the script's compiled, calculation load times are quick and you can sift through assets and timeframes relatively quick.
There's also a setting to "Improve Load Times" in the user-inputs table. This setting only improves the load times for post-compilation calculations and plots. The initial compilation load time is unchanged. Simply, once the indicator has "first loaded", all subsequent loads are quick.
Thank you! (:

Daily GAP StatsI did not write the script from scratch but rather started editing code of an existing one. The original code came from a script called GAP DETECTOR by @Asch-
First up: I am a trader, not a programmer and therefore my code most likely is inefficient. If someone with more expertise would like to help and optimize it - feel free to get in touch, I am always happy to learn some new tricks. :)
This script does 2 things:
- It shows daily gaps stats based on user inputs
- It shows color coded labels on gap days with additional information in tooltips ( important: make sure to read 'known issues/limitations' at the end )
User Inputs
==========
Although the input dialog is pretty straight forward, I do a quick rundown:
- Length: max lookback time
- Gap Direction: self explanatory
- Show All Gaps | Cont Only | Reversal Only | Off:
This refers to the way labels are displayed on gap days (again: make sure to read known issues/limitations!)
- Show All Gaps: does what it says
- Cont Only: only shows gaps where price continued in the gap direction. If you filter for gap ups and chose 'Cont only' you will only see labels on gap days where price closed above the open (and vice versa if you scan for gap downs).
- Reversal Only: you will only see labels for closes below the open on gap up days (and the opposite on gap down days)
- Off: self explanatory
- Gap Measure in ATR/PCT: self explanatory, ATR is calculated over a 10d period
- Gap Size (Abs Values): no negative values allowed here. If you filter for gap downs and enter 3 it means it will show gaps where the stock fell more than 3 ATR/PCT on the open.
- RVOL Factor: along with significant gaps should come significant volume. RVOL = volume of the gap day / 20d average volume
- Viewing Options: Placing the stats label in the window is a bit tricky (see knonw issues/limitations) and I was not sure which way I liked better. See for yourself what works best for you.
Known Isusses/Limitations:
=======================
- Positioning of the stats table:
As to my knowledge, Tradingview only allows label positioning relative to price and not relative to the chart window. I tried to always display the gap stats table in the upper right corner, using 52wk high as y-coordinate. This works ok most of the time, but is not pretty. If anybody has some fancy way to tag the label in a fixed position, please get in touch.
- Max number of labels per script:
TradingView has a limitation that allows a maxium of ~50 labels per script. If there are more labels, TradingView will automatically cut the oldest ones, without any notification. I have found this behaviour to be rather inconsistent - sometimes it'll dump labels even if there are a lot fewer than 50. Hopefully TradingView will drop this limitation at one point in the future.
Important: The inconsistent display of the gap day labels has NO INFLUENCE on the calculations in the gap stats table - the count and the calculations are complete and correct!

Levels S/R Boxes + Gaps + SL/TPWhat It Does:
Automatically identifies and displays:
🟦 Support/Resistance zones (horizontal boxes)
🟨 Price gaps (unfilled gaps from market open/close)
🎯 Stop Loss levels (where to protect trades)
💰 Take Profit levels (where to exit trades)
Purpose: Shows you exactly where price is likely to bounce, reverse, or break through.
Best Practices:
✅ Trade at the boxes - Don't chase price
✅ Use SL/TP lines - Automatic risk management
✅ Wait for confirmation - Candle pattern + S/R level
✅ Gaps get filled - Trade towards yellow boxes
✅ Solid lines = stronger - Prefer 3+ touch levels
❌ Don't ignore SL - Always protect yourself
❌ Don't trade middle - Wait for S/R zones
❌ Don't fight strong levels - Respect solid boxes
Settings (Quick Reference):
S/R Strength: 10 (default) - Lower = more levels, Higher = fewer stronger levels
Max Levels: 5 (default) - Number of S/R boxes to show
Show Gaps: ON - Display yellow gap boxes
Show SL/TP: ON - Display entry/exit suggestions

BornInvestor Gap Detector📈 BornInvestor Gap Detector
The BornInvestor Gap Detector is a powerful visual tool for identifying and analyzing price gaps on any chart. It automatically detects up and down gaps, highlights them with customizable boxes, and offers detailed labeling and alerting functionality.
🔍 Key Features:
Automatic Detection of bullish and bearish gaps based on customizable deviation settings.
Visual Highlighting of gaps using colored boxes with optional trail length limitation.
Gap Size Labels showing the percentage size of the gap, with the ability to display them only on the most recent N gaps.
Alerts for:
New gap appearance
Gap fully or partially closed
Price entering a gap zone (ideal for breakout/backfill strategies)
Customizable Colors for up/down gap borders and backgrounds.
Optional Message when no gaps are found on the current chart.
💡 Usefulness:
Gaps are an edge. They frequently act as support or resistance—especially on the first retest—when aligned with high-volume areas or other key price zones. Many strong stock moves begin with gaps, a concept central to strategies like Episodic Pivots.
This indicator helps you:
Identify gaps as potential entry zones on secondary setups
Quantify gaps via percentage size
Filter gaps based on size to suit your specific trading approach
Set alerts when price enters a gap or meets your custom criteria
Volume Gaps and ImbalancesThis Pine script indicator is designed to visually depict price inefficiencies, as identified by Volume Imbalances (VI) or Gaps. A Volume Gap is a scenario where the wicks of two successive candles don’t intersect, while an Imbalance occurs when only the wicks overlap, leaving the bodies apart. These zones of inefficiency frequently act as magnets for price, with the market striving rebalance in accordance with ICT principles.
Relevance:
Volume Gaps/Imbalances are zones of highly inefficient price delivery as per ICT concepts and represent a very strong draw to price. Price will often seek to rebalance those zones to ensure efficient price delivery. Consequently, these zones can provide good targets for entries in the opposite direction or take profit targets for previous entries in the direction of the Gap/Imbalance.
How It Works:
The indicator keeps track of all Gaps/Imbalances from the beginning of the available history. It automatically removes all mitigated Gaps/Imbalances, which are situations where the price has at least reached the bottom of a bullish gap or the top of a bearish gap.
On the last bar, the most recent valid gaps are highlighted with a box drawn from the start to the end of the gap. The start of a bullish gap is determined by the highest price of the previous candle’s open or close, while for bearish gaps, it’s the lowest price of the previous candle’s open or close. Conversely, the end of a bullish gap is the lowest price of the current candle’s open or close, and for bearish gaps, it’s the highest price of the current candle’s open or close.
To enhance the indicator’s speed and minimize chart noise, only the most recent gaps will be displayed, up to the limit set in the indicator settings.
Each displayed VI/GAP will indicate the size of the imbalance in ticks. For imbalances greater than 3 ticks, which represent stronger draws of liquidity, the color transparency will be reduced, and the text will be made more prominent. Volume Gaps are also marked with a 🧲 emoji for easy visual identification.
The indicator will automatically extend the boxes representing valid imbalances to the current bar for as long as the imbalance is not mitigated.
If an imbalance has been tapped, but not mitigated, the indicator will append 🚩emoji to denote that the imbalance has been partially mitigated and may no longer have as strong of a draw for price.
Configurability:
A user may configure the number of imbalances to show, the setting applies to bullish/bearish imbalances individually. This setting can be set to any value from 1 – 50.
Appearance wise, color, style and color transparency of each box representing an imbalance can be configured. The imbalance box label can be configured by setting the text size, along with the vertical & horizontal alignment.
What makes this indicator different:
Designed with high performance in mind, to reduce impact on chart render time.
Only keeps valid imbalances on the chart, with a limit on the # drawn
Indicates the size of the gap and provides visual markets to denote stronger, weaker and partially mitigated gaps

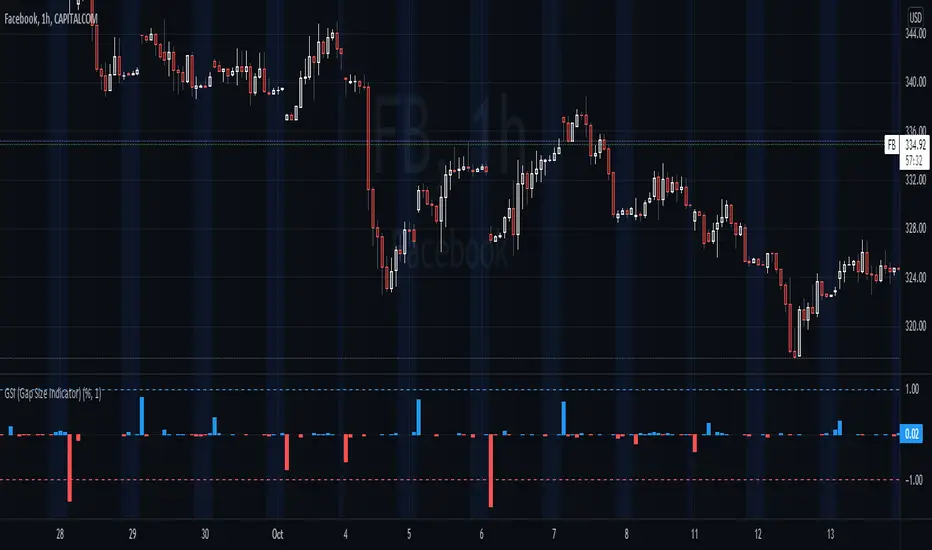
GSI (Gap Size Indicator)The purpose of this indicator is to give a quick view of a gap size between two candles, and to detect any gap bigger than the trigger setting.
Options
Mode: Select the display mode (% or Value)
Variation Trigger: Defines the minimum gap size to give a signal, for both positive and negative sides. This option depends on the Mode setting
Show trigger lines: Enable/Disable the display of the Variation Trigger setting lines
Color signals only: When enabled, bars crossing the trigger value are still colored, but other are gray
Show signals only: When enabled, will only show bars corresponding to gaps crossing the trigger value
Notes
Basic alerts on Bullish , Bearish and All gaps are available.
Feel free to suggest any improvement.
[BMAX] Daily Gaps(ENGLISH)
This indicator was built to allow traders to observe the open gaps between sessions in the Market. It can be used either on daily or weekly timeframes. Also it incluses a standard deviation band (such as bollinger band) in order to verify the gaps variance. This indicator can be used to check what is the variance on the session open gaps and prepare to protect the positions against market volatility when swing or position trading.
(PORTUGUÊS)
Este indicador foi construído para permitir que traders observem os gaps de abertura de seção no Mercado. Ele pode ser utilizado no tempo gráfico Diário ou Semanal. Também inclui uma banda de desvio padrão (assim como usado nas Bandas de Bolinger) que permite verifcar a variância dos gaps. Este indicador pode ser usado para se preparar para proteger uma posição em swing ou position trading onde o mercado pode abrir com forte gap em situações de alta volatilidade.

RSI Ignoring Gaps Between DaysThe RSI Ignoring Gaps Between Days indicator is an advanced modification of the traditional Relative Strength Index (RSI) designed to exclude price gaps that occur between the last bar of one trading day and the first bar of the next. This ensures that the RSI calculations remain focused on the actual price action during the trading session, avoiding distortions caused by overnight price gaps.
Key Features:
Gap Ignoring Mechanism: The indicator detects when a new day begins and skips the price change between the last bar of the previous day and the first bar of the current day. This ensures that only the intra-day price changes are included in the RSI calculation.
Intra-day Price Movement: The RSI calculations are based on real price changes within each trading day, providing a clearer reflection of momentum without interference from overnight events.
Dynamic RSI Calculation: The traditional RSI formula is preserved, but gains and losses are recalculated based on price changes from bar to bar within the same day.
Overbought/Oversold Levels: The indicator retains standard RSI overbought (70) and oversold (30) levels, allowing traders to easily identify potential reversal zones.
Alerts for Crossovers: Built-in alert conditions trigger when the RSI crosses key levels (30 or 70), signaling potential buying or selling opportunities.
This indicator is particularly useful for traders looking to focus on intra-day price action and avoid the influence of gaps caused by overnight market activity. It is suitable for intraday trading strategies where consistency in price movement measurement is crucial.