High/Low Anchored VWAPHigh/Low Anchored VWAP simply plots an Anchored VWAP at High and Low, within a set range (D,W,M) , with a central "Basis" plot of the High and Low anchored VWAPs
*DISCLAMER* This indicator repaints. DO NOT set alerts or backtest using this indicator.
Cerca negli script per "high low"

High - Low Trend TunnelHigh - Low Trend Tunnel Experiment.
Using latest pinescript Array support!
Plotting Highest highs and Lowest lows for specific length (can be defined in settings).
The blue line is whom determinate the direction.
Blue line is the average of the highest highs and lowest lows smoothed by EMA.
Green - Up Trending.
Red - Down Trending.
Yellow - Squeeze, a reversal might be coming.
Any suggestions/comments are welcome as this is an experiment.

High Low Yearly Support ResistanceDecided to repost to get clean chart up. This gives you lines showing the current years highs and lows along with the previous years high and lows.
Requested by "N"

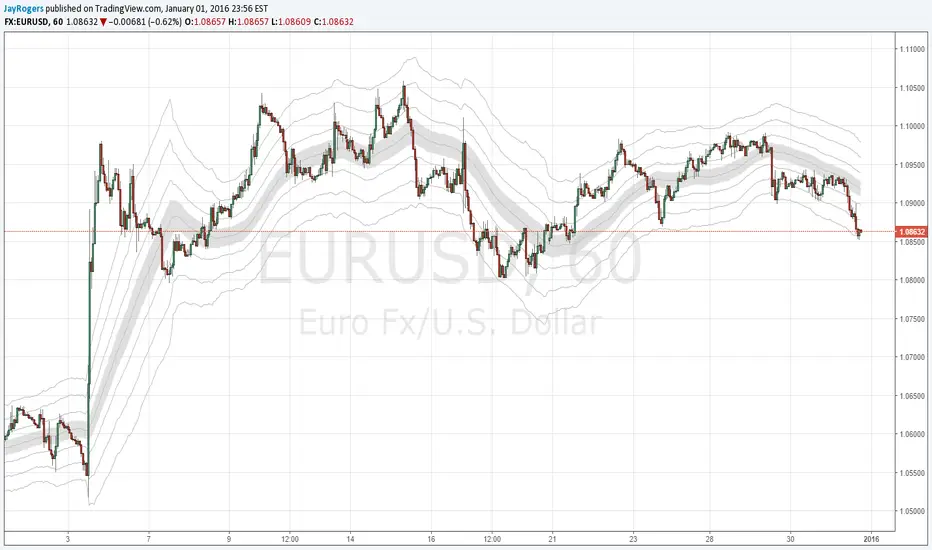
High Low Envelope SigmaDescription:
High and Low Envelope channel with median line and 'sigma' offsets to try and encapsulate price flow and quickly locate likely areas of support and resistance on the fly.
High-Low Difference Channels - SMA/EMAI wrote this up as a potential replacement for my BB based strategies, and so far it's looking pretty nice.
Description / Usage:
Adjust length and multiplier much the same way you would expect with Bollinger Bands.
Multiplier of 1 gives you a base channel consisting of one high, and one low sourced SMA (or EMA)
The outer channels are increments of the base channels width, away from the median hl2 sourced SMA (..or EMA)

High/Low MA Touch with Golden CrossHigh/Low MA Touch with Golden Cross
You can check short MA / Long MA Golden Cross
You can check buy timing with touching the short MA and oversole Stoch RSI
You can also check buy timing with touching the Long MA and oversole Stoch RSI


High-Low IndexHello All,
High-Low Index is a breadth indicator based on Record High Percent (RHP). RHP is based on new 52-week highs and new 52-week lows. RHP => 100 * (new highs) / (new highs + new lows). High-Low Index is a 10-day Simple Moving Average of the RHP, which makes it a smoothed version of RHP. You can find many articles about High-Low Index on the net.
High-Low Index above 50 indicates that there are more new highs than new lows, and considered as Bullish.
High-Low Index below 50 indicates that there are more new lows than new highs, and considered as Bearish.
High-Low Index = 0 indicates there is no new highs (0% new highs).
High-Low Index = 100 indicates that there is at least 1 new high and no new lows.
and High-Low Index = 50 indicates that new highs and new lows is equal.
by default 40 cryptos are used in the script and shows High-Low Index for these cryptos. but you can change them as you wish. for example you can set all of them as stocks and see High-Low Index for these stocks.
You can set " Time frame " and the " Length " using the options. For example; if you set " Time frame " = 1 Week and the " Length " = 52 then it finds High-Low Index for 52weeks .
or another example; if you set " Time frame " = 1 Day and the " Length " = 22 the High-Low Indexn it finds High-Low Index for 22days.
You can enable/disable Record High Percent or Simple Moving Average of High-Low Index. Some traders use High-Low Index with its SMA, for example; High-Low Index generates a buy signal when it crosses above its moving average, and a sell signal when it crosses below its moving average.
Optionally you can see the securities in a table on the left bottom, you can change table size by usşng the options.
In the Table, for each security/cell;
=> if background is green then it has New High
=> if background is red then it has New Low
=> if background is gray then no New High, no New Low
=> if background is back then Data is not available for the security
As you can see in the screenshot below, the securities were changed and stocks are used instead of cryptos, so it calculates & shows High-Low Index for these stocks.
you can also find explanation in this screenshot:
Enjoy!

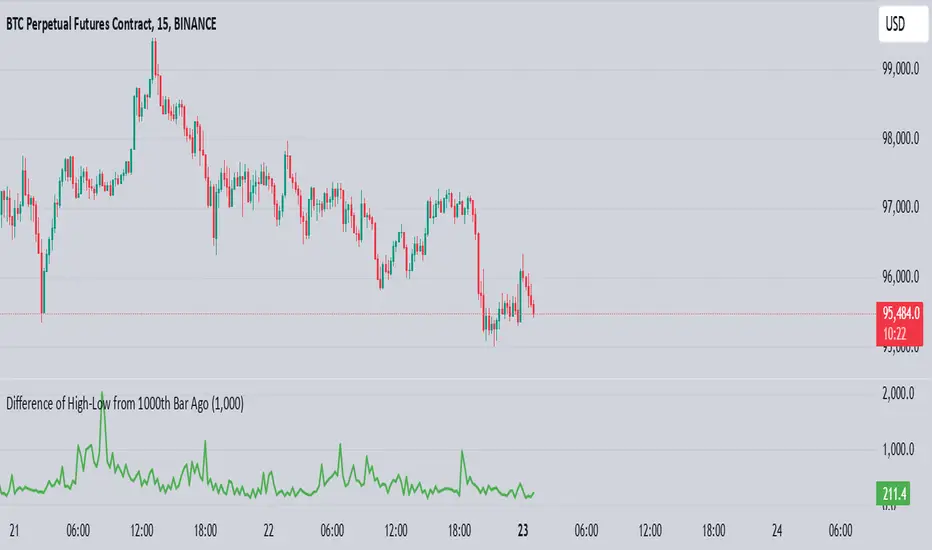
High-Low of X BarOverview
The High-Low of X Bar indicator allows traders to visualize historical high and low values from a specific number of bars ago directly on the chart.
Provides insight into past price action by displaying high, low, and their difference at the most recent bar.
Customizable inputs and color settings for labels enhance usability and visual integration with your chart.
Key Features
Historical Data Analysis: Displays the high, low, and the difference between these values from a specified number of bars ago.
Customizable Inputs: Set the number of bars ago to review historical price points, with a range from 1 to 2000 bars. Premium users can exceed this range.
Dynamic Labeling: Option to show high, low, and difference values as labels on the chart, with customizable text and background colors.
Color Customization: Customize label colors for high, low, and difference values, as well as for cases with insufficient bars.
Inputs
Number of Bars Ago: Enter the number of bars back from the current bar to analyze historical high and low values.
Show High Value: Toggle to display the historical high value.
Show Low Value: Toggle to display the historical low value.
Show Difference Value: Toggle to display the difference between high and low values.
Color Settings
High Label Background Color: Set the background color of the high value label.
High Label Text Color: Choose the text color for the high value label.
Low Label Background Color: Set the background color of the low value label.
Low Label Text Color: Choose the text color for the low value label.
Difference Label Background Color: Set the background color of the difference label.
Difference Label Text Color: Choose the text color for the difference label.
Not Enough Bars Label Background Color: Set the background color for the label shown when there are insufficient bars.
Not Enough Bars Label Text Color: Choose the text color for the insufficient bars label.
Usage Instructions
Add to Chart: Apply the High-Low of X Bar indicator to your TradingView chart.
Configure Settings: Adjust the number of bars ago and display options according to your analysis needs.
Customize Appearance: Set the colors for the labels to match your chart's style.
Analyze: Review the high, low, and their difference directly on your chart for immediate insights into past price movements.
Notes
Ensure your chart has sufficient historical data for the indicator to function properly.
Customize label visibility and colors based on your preference and trading strategy.
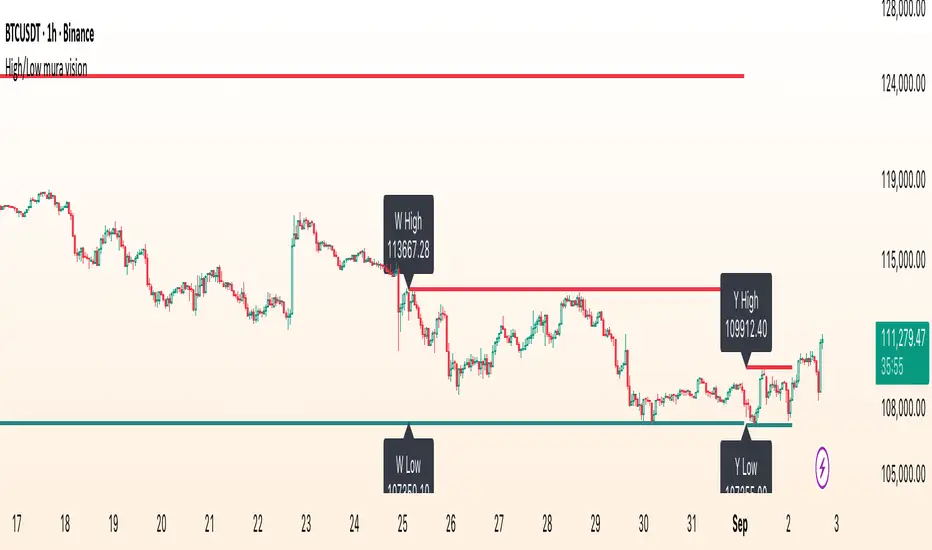
High/Low mura visionDescription
High/Low mura vision plots static support and resistance lines based on the completed high and low values of the prior trading day, week and calendar month.
This script:
Anchors each level to the exact start and end bars of the completed period
Does not repaint or extend levels into the current period
Uses request.security() to retrieve only historical data (no lookahead)
This indicator was built to give traders clear, unambiguous reference points for breakout entries, pullback targets or confirmation of supply/demand zones without guessing where to draw manually.
How It Works
At the close of each daily candle, the script captures high and low via request.security() and draws flat lines spanning only that day’s bars.
Similarly, at the close of Friday’s weekly candle and the last bar of each calendar month, it draws the completed week’s and month’s high/low ranges.
All lines are deleted and redrawn only once per period completion, ensuring no forward painting or hidden repainting logic.
Key Features
No repaint: levels appear exactly once, immediately after the period closes
Period‑specific: lines confined to the bars of the prior day, week or month
Customizable: toggle each period on/off; choose independent colors, line styles (Solid, Dotted, Dashed) and width
Lightweight: minimal calculations for maximum performance on any timeframe
How to Use
Apply to any chart (M1 to MN).
In the Inputs panel, enable the levels you need: Yesterday, Last Week or Last Month.
Adjust High and Low line color, style and thickness to suit your chart layout.
Use these historic levels for support/resistance, breakout confirmation or confluence with other tools.
Inputs
Show Yesterday’s High: toggle yesterday’s high line
Show Yesterday’s Low: toggle yesterday’s low line
Show Last Week’s High: toggle last week’s high line
Show Last Week’s Low: toggle last week’s low line
Show Last Month’s High: toggle last month’s high line
Show Last Month’s Low: toggle last month’s low line
High Line Color / Low Line Color: choose colors for each set of lines
High Line Style / Low Line Style: select Solid, Dotted or Dashed
Line Width: adjust overall thickness
Disclaimer
This script is provided “as‐is” under the Public License. It is intended for educational and analytical purposes only and does not constitute trading or investment advice. Past performance does not guarantee future results. Always perform your own analysis and manage risk responsibly.
High Low Levels by JZCustom High Low Levels Indicator - features
Clearly plotted high and low levels for specific trading sessions. This indicator provides visual representations of key price levels during various trading periods. Below are the main features and benefits of this indicator:
1. Display high and low levels for each session
- previous day high/low: display the high and low from the previous day, giving you a better understanding of how the price moves compared to the prior day.
- asia, london, and custom sessions: track the high and low levels for the major trading sessions (asian and london) and two custom user-defined sessions.
2. Complete line and label customization
- custom line appearance: choose the color, line style (solid, dashed, dotted), and line thickness for each trading session. you can also decide if the lines should extend beyond the current price action.
- custom labels: define your own label texts for each custom session. this way, you can label the levels precisely and easily track price movements.
3. Define your own trading sessions
- add up to two custom sessions (custom and custom 2), which can be defined using precise start and end times (hour and minute).
- each custom session allows you to specify the label text for the high and low levels, enabling you to easily differentiate different parts of the day on the chart.
4. Clear and intuitive design
- grouped settings: all settings are grouped based on trading sessions, so you can easily customize every aspect of the visual representation.
- simple toggle on/off: you can easily enable or disable each line (previous day, asia, london, custom 1, custom 2). this allows you to keep your chart clean and focus only on the important levels you need at any moment.
5. Flexible time zones
- time zone settings: set the time zone (utc, europe/london, america/new_york, asia/tokyo) to properly align the timeframes for each level depending on the market you're focusing on.
6. Automatic cleanup of old lines and labels
- old levels removal: automatically remove old lines and labels to prevent clutter on your chart. this ensures that only current, relevant levels for each trading day or session are displayed.
7. Precise plotting and line extension
- accurate level markings: the indicator calculates the precise times when the high and low levels were reached and plots lines that visually represent these levels.
- line extension options: you have the option to extend the high/low lines beyond their point of calculation, which helps with identifying price action trends beyond the current period.
Dec 7, 2024
Release Notes
Changes and Improvements for Users:
1. Customizable Offset for Lines and Labels:
- A new input, `Line and Label Offset`, allows users to control how far the lines and their associated text labels extend. This ensures the labels and lines remain aligned and can be adjusted as needed.
2. Unified Offset Control:
- The same offset value is applied to all types of lines and labels (e.g., Previous Day High/Low, Asia High/Low, London High/Low, and custom sessions). Users can change this in one place to affect the entire script consistently.
3. Enhanced Flexibility:
- Users now have more control over the appearance and position of their lines and labels, making the indicator adaptable to different chart setups and personal preferences.
These updates aim to enhance user convenience and customization, ensuring a more tailored charting experience.

High-Low DifferenceThe "High-Low Difference" indicator calculates the difference between the high and low prices within a specified period. In technical analysis, the high and low prices of an asset over a given period can provide valuable insights into the price volatility and trading range. By subtracting the low price from the high price, this indicator quantifies the range covered by price movements during the selected timeframe.
Understanding the high-low difference is essential for traders and analysts to gauge the volatility and potential price movements of an asset. A larger difference indicates higher volatility, implying greater price fluctuation within the chosen period. Conversely, a smaller difference suggests lower volatility, indicating relatively stable price movements.
Traders often use the high-low difference as part of their technical analysis toolkit to identify potential trading opportunities. For instance, a significant increase in the high-low difference may signal a breakout or increased market activity, prompting traders to adjust their trading strategies accordingly. Conversely, a narrowing high-low difference may indicate decreased volatility or a period of consolidation, suggesting potential price range-bound trading conditions.
Overall, the high-low difference serves as a simple yet valuable metric for understanding price volatility, identifying trading opportunities, and making informed decisions in the financial markets.

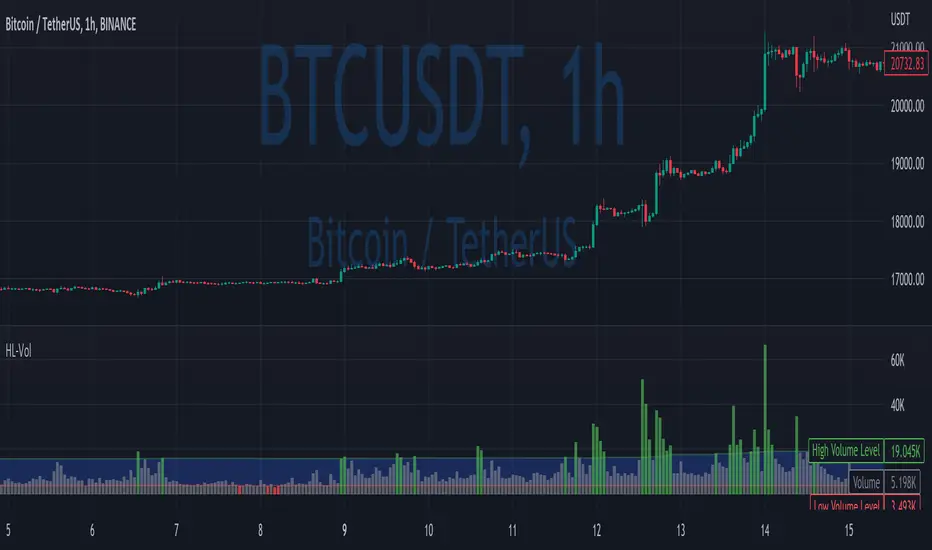
High/Low VolumeIn this indicator, I show you a better way to define high/low values of volume (or any other indicator).
Quite often, I get requests from my clients that an indicator level should be “high” or that it should be above a certain absolute level.
The first request is hard to interpret mathematically, but traders can easily spot it on the chart. The second one is not flexible, and it might not make sense in another market regime.
To solve that, you can compute dynamic high/low levels that represent unexpected extreme values that are adaptable to recent conditions.
There are two pretty simple methods I’m using quite often in my scripts percentiles and sigma (standard deviations).
Percentile looks back at X bars and computes the value under which a certain % of data points are located. So, for example, if we’re computing 90%tile and we’re looking at 100 bars, we’ll get a value under which we have values of precisely 90 bars for this indicator. It’s a good idea to use something like 5%tile for low level and 95%tile for high level.
Sigma(σ) is related to standard deviation. If we assume that our data is normally distributed, then 68% of data points should be in the range of mean +-1σ, 95% → mean +-2σ. So we can assume that something above 2σ is a pretty rare and extreme event.
In this script, I give you an example of how to compute both on volume, but you can easily change this to another indicator.
The issue with volume is that it’s not normally distributed, and your low level will be quite often too low to detect any low levels. Ideally, we have to use a more sophisticated formula that fits volume distribution better.
In this indicator, you can set the following parameters:
Choose type: Percentile or Sigma
Lookback Period
High/Low Percentiles
Sigmas #
You can also receive alerts for high/low volume events.
Disclaimer
Please remember that past performance may not indicate future results.
Due to various factors, including changing market conditions, the strategy may no longer perform as well as in historical backtesting.
This post and the script don’t provide any financial advice.
High/Low Liquidation LevelsThe Visible High/Low Liquidation Levels indicator is designed to help traders better understand potential liquidation zones within a visible range on the chart. It does this by identifying dynamic high and low median price levels and plotting corresponding liquidation levels based on various leverage ratios.
This tool visually marks these critical zones, offering insight into areas where over-leveraged positions (such as x1, x2, x5, up to x100) are more likely to get liquidated, either above the recent low or below the recent high. This can support risk management and decision-making, especially in volatile markets.
Features:
Displays median high and low levels based on a configurable number of visible bars.
Plots liquidation levels above the low median and below the high median for multiple leverage tiers: x1, x2, x3, x5, x10, x25, x50, x75, x100.
Full customization over which leverage levels to show.
Color-coded lines for easy visual distinction.
Configurable bar range for calculating highs and lows separately.
Built-in legend table for clear reference to level color mappings.

High-Low Index [LazyBear]-- Fixed ---
Source: pastebin.com
Fixes an issue with "Combined" mode, using wrong symbols.
--- Original ---
The High-Low Index is a breadth indicator based on Record High Percent, which is based on new 52-week highs and new 52-week lows.
Readings below 50 indicate that there were more new lows than new highs. Readings above 50 indicate that there were more new highs than new lows. 0 indicates there were zero new highs (0% new highs). 100 indicates there was at least 1 new high and no new lows (100% new highs). 50 indicates that new highs and new lows were equal (50% new highs).
Readings consistently above 70 usually coincide with a strong uptrend. Readings consistently below 30 usually coincide with a strong downtrend.
More info:
stockcharts.com
List of my public indicators: bit.ly
List of my app-store indicators: blog.tradingview.com
Just noticed @Greeny has already published this -> Linking it here.

High-Low Cloud Trend [ChartPrime]The High-Low Cloud Trend - ChartPrime indicator, combines the concepts of trend following and mean reversion into a dynamic cloud representation. This indicator constructs high and low bands based on lookback periods, which adjust dynamically to reflect market conditions. By highlighting the upper and lower extremes, it provides a visual gauge for potential reversals and continuation points.
◆ KEY FEATURES
Dynamic Cloud Bands : Uses high and low derived from user-defined lookback periods to create reactive bands that illustrate trend strength and potential reversal zones.
Color-coded Visualization : Applies distinct colors to the bands based on the trend direction, improving readability and decision-making speed.
Mean Reversion Detection : Identifies points where price extremes may revert to a mean, signaling potential entry or exit opportunities based on deviation from expected values.
Flexible Visualization : Offers options to display volume or price-based metrics within labels, enhancing analytical depth.
◆ FUNCTIONALITY DETAILS
Band Formation : Calculates two sets of bands; one based on a primary lookback period and another for a shorter period to capture mean reversion points.
◆ USAGE
Trend Confirmation : Use the main bands to confirm the prevailing market trend, with the cloud filling acting as a visual guide.
Breakout Identification : Monitor for price breaks through the cloud to identify strong momentum that may suggest a viable breakout.
Risk Management : Adjust positions based on the proximity of price to either band, using these as potential support or resistance areas.
Mean Reversion Strategies : Apply mean reversion techniques when price touches or crosses the bands, indicating a possible return to a central value.
⯁ USER INPUTS
Lookback Period : Sets the primary period for calculating high and low bands.
Mean Reversion Points : Toggles the identification of mean reversion opportunities within the bands.
Volume/Price Display : Chooses between displaying volume or price information in the indicator's labels for enhanced detail.
The High-Low Cloud Trend indicator is a versatile and powerful tool for traders who engage in both trend following and mean reversion strategies. It provides a clear visual representation of market dynamics, helping traders to make informed decisions based on established and emerging patterns. This indicator's dual approach ensures that it is suitable for various trading styles and market conditions.

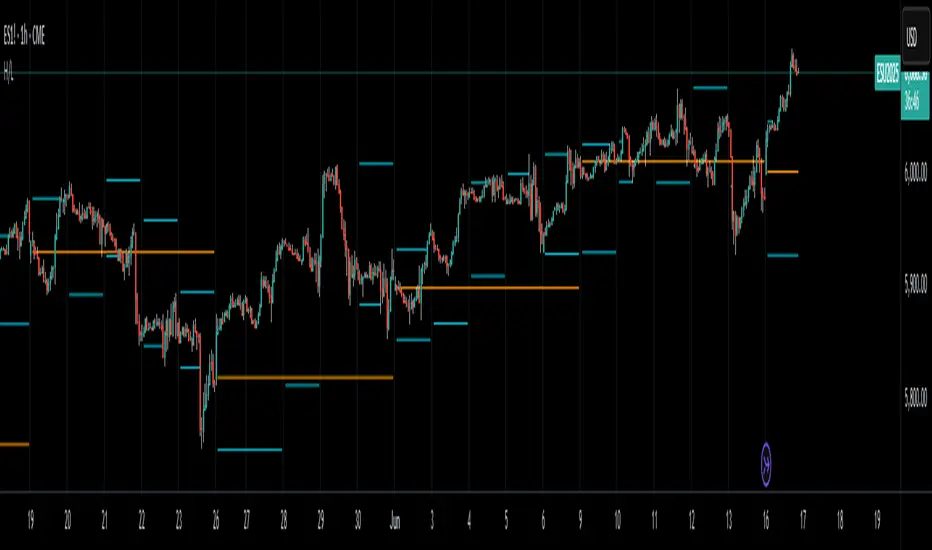
High/LowPrevious Day High/Low & Weekly Open Indicator
A clean and simple indicator that displays key reference levels for intraday trading.
Features:
Previous day's high and low levels
Current week's opening price
Auto-hides levels once broken (prevents clutter)
Resets automatically at the start of each trading day
No repainting - uses proper security function calls
How it works:
The indicator plots yesterday's high/low as horizontal lines on your chart. When price breaks above the previous day's high, that level disappears. Same for the low. This keeps your chart clean and shows only unbroken levels.
Perfect for:
Day traders using previous day's range as reference
Breakout trading strategies
Support/resistance analysis
Clean chart setup without manual level drawing
The cyan lines show previous day's high/low, while the orange line displays the weekly open. All levels use non-repainting data for reliable backtesting.
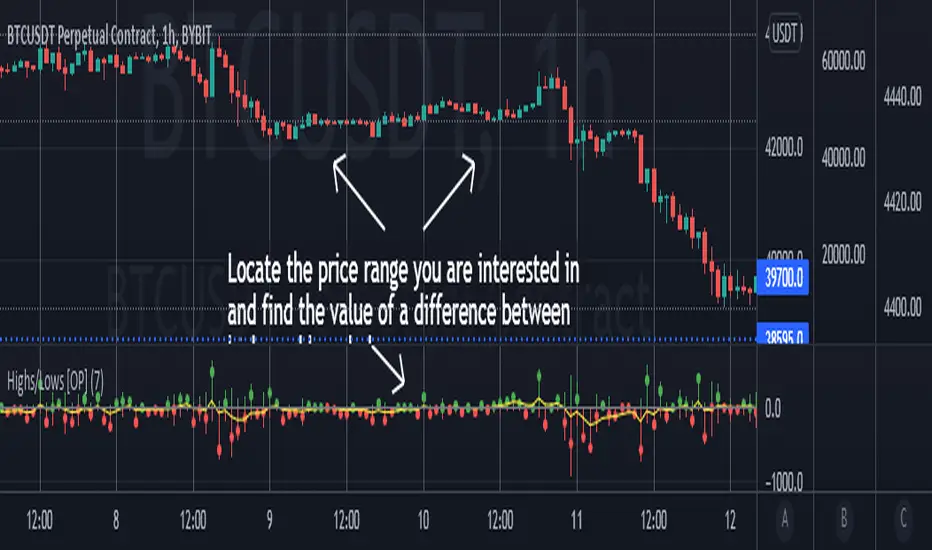
Highs/Lows difference [OrganicPunch]Highs/Lows difference indicator
To visually evaluate the difference between highs and lows of a price range.
This handsome indicator shows:
difference between highs of 2 candles by displaying it in green histogram
difference between lows of 2 candles by displaying it in red histogram
difference between both highs and lows by displaying a circle at the level of the difference
To read the numerical value, point at the circle of the relevant bar you are interested in, and see the scale.
Indicator is useful in creating strategies where you want to filter out consolidations/ranges (or to locate them), e.g. "Open trade when H/L difference is larger than 200", or "Look for candles with H/L difference lesser than 50".
The exact value of needed H/L difference can be found using this indicator.
High Low Index SPY Top 40Modification from original code for "High Low Index" by © LonesomeTheBlue
- Made modification specifically for Top 40 AMEX:SPY holdings
- Added Market sentiment histogram (Total count green vs red), and SMA line for it
- Added arrows for peaks and dips on High Low Index and Market Sentiment MA
Idea behind this indicator is that SPY should follow the overall sentiment of its top holdings. I believe this bring great value to SPY traders.
Enjoy~!

High Low Yesterday & Last week & Last monthJapanese below. 日本語の説明は下記
This indicator shows high/low price of previous day(yesterday), last week and last month.
Yesterday’s high/low are shown on 4 hour or lower timeframe charts.
Last week’s high/low are shown on Daily or lower timeframe charts.
Last month’s high/low are shown on Weekly or lower timeframe charts.
Each price can be enabled/disabled to show at selection parameters.
——————————————————————————————
前日の高値・安値、先週の高値・安値、先月の高値・安値を表示するインジケーターです。
前日の高値・安値: 4時間足以下のタイムフレームで表示
先週の高値・安値: 日足以下のタイムフレームで表示
先月の高値・安値: 週足以下のタイムフレームで表示
それぞれの価格はインジケーターの設定画面で表示・非表示設定可能です。

High – Low Trend Indicator Signal (Expo)High - Low Trend Indicator Signal - (Expo)
DESCRIPTION
This indicator is derived from my previous one called High – Low Trend Indicator (Expo) , but the difference is that this one generates Long signals and detects market changes. These two indicators are intended to be used in the same chart for better accuracy and validation of signals. The indicator is perfectly used to identify pullbacks in positive trends!
HOW TO USE
When a signal appears, consider enter long, or look for confirmation patterns. Such confirmation could be seen in the High – Low Trend Indicator (Expo) when the red cloud disappears or when the black price line crosses out from the red cloud, or when the black price line crosses up over the blue midline.
So,
1. Use the indicator to identify Long signals.
2. Use the indicator to find Entry points in positive trends.
3. Use the indicator to detect market changes.
4. Combine it with High – Low Trend Indicator (Expo).
INDICATOR IN ACTION
The indicator is best presented live, the graphs below are a good guide.
EURUSD
DAX
WALL STREET
GOLD
I hope you find this indicator useful , and please comment or contact me if you like the script or have any questions/suggestions for future improvements. Thanks!
I will continue to work on this indicator, so please share your experience and feedback with me so that I can continuously improve it. Thanks to everyone that have contacted me regarding my scripts. Your feedback is valuable for future developments!
ACCESS THE INDICATOR
• Contact me on TradingView or use the links below
-----------------
Disclaimer
Copyright by Zeiierman.
The information contained in my scripts/indicators/ideas does not constitute financial advice or a solicitation to buy or sell any securities of any type. I will not accept liability for any loss or damage, including without limitation any loss of profit, which may arise directly or indirectly from use of or reliance on such information.
All investments involve risk, and the past performance of a security, industry, sector, market, financial product, trading strategy, or individual’s trading does not guarantee future results or returns. Investors are fully responsible for any investment decisions they make. Such decisions should be based solely on an evaluation of their financial circumstances, investment objectives, risk tolerance, and liquidity needs.
My scripts/indicators/ideas are only for educational purposes!
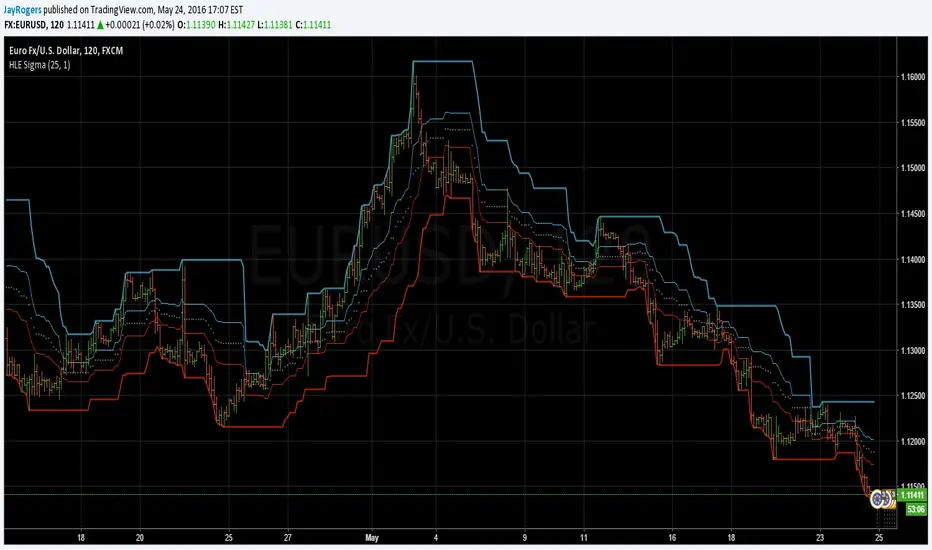
High - Low Trend Indicator - (Expo)High - Low Trend Indicator - (Expo)
DESCRIPTION
This trend indicator is derived from the highest (High) and lowest (Low). The unique formula enables clarity in trends and fast response to market changes.
Negative trend
The market could be considered to be in a negative trend when the black price line is under the blue Midline and a major red cloud is created. For some markets, the orange- trendline can be switched on to identify the long-term trend in the market. So, if the price line is under the orange trendline the market is in a negative trend.
Positive trend
The market could be considered to be in a positive trend when the black price line is above the blue Midline and close to the upper-line. For some markets, the orange-trendline can be switched on to identify the long-term trend in the market. So, if the price line is above the orange trendline the market is in a positive trend.
The indicator should be used in combination with High – Low Trend Indicator Signal (Expo) to identify market changes.
HOW TO USE
1. Use the indicator to identify trends.
2. Use the indicator to find Entry points in trends.
3. Combine it with High – Low Trend Indicator Signal (Expo).
INDICATOR IN ACTION
The indicator is best presented live, the graphs below are a good guide.
EURUSD
DAX
WALL STREET
EURJPY
GOLD
I hope you find this indicator useful , and please comment or contact me if you like the script or have any questions/suggestions for future improvements. Thanks!
I will continue to work on this indicator, so please share your experience and feedback with me so that I can continuously improve it. Thanks to everyone that have contacted me regarding my scripts. Your feedback is valuable for future developments!
ACCESS THE INDICATOR
• Contact me on TradingView or use the links below
-----------------
Disclaimer
Copyright by Zeiierman.
The information contained in my scripts/indicators/ideas does not constitute financial advice or a solicitation to buy or sell any securities of any type. I will not accept liability for any loss or damage, including without limitation any loss of profit, which may arise directly or indirectly from use of or reliance on such information.
All investments involve risk, and the past performance of a security, industry, sector, market, financial product, trading strategy, or individual’s trading does not guarantee future results or returns. Investors are fully responsible for any investment decisions they make. Such decisions should be based solely on an evaluation of their financial circumstances, investment objectives, risk tolerance, and liquidity needs.
My scripts/indicators/ideas are only for educational purposes!