Ichimoku Cloud +Ichimoku Cloud Plus - Advanced Technical Analysis Indicator
Ichimoku Cloud Plus is an advanced technical analysis tool that combines the traditional Ichimoku Cloud system with Pearson correlation analysis and multi-timeframe momentum tracking. This innovative approach provides traders with a comprehensive view of market trends, momentum, and potential reversal points across multiple time frames.
Core Components
Enhanced Ichimoku Cloud Analysis
The traditional Ichimoku Cloud components have been preserved and enhanced with customizable visual parameters:
The indicator includes:
- Conversion Line (Tenkan-sen) - Short-term trend identifier
- Base Line (Kijun-sen) - Medium-term trend identifier
- Leading Span A and B (Senkou Span A and B) - Future cloud projections
- Lagging Span (Chikou Span) - Historical price momentum confirmation
The cloud (Kumo) formations provide dynamic support and resistance levels, with color-coding to instantly identify bullish and bearish market conditions.
Pearson Correlation Analysis
A sophisticated Pearson correlation coefficient calculation has been integrated to provide statistical validation of trend strength and direction. This component:
- Calculates correlation between price movement and time
- Provides real-time correlation coefficients
- Identifies trend strength through correlation thresholds
- Generates signals for trend changes and potential reversals
Multi-Timeframe Momentum Tracking
The indicator incorporates a unique multi-timeframe analysis system that:
- Displays momentum calculations across five timeframes (15m, 30m, 1h, 4h, 1d)
- Provides percentage-based momentum values
- Includes volatility adjustment capabilities
- Offers volume-weighted calculations for enhanced accuracy
Advanced Features
Statistical Analysis Panel
A comprehensive statistical panel provides real-time analysis including:
- Current Pearson coefficient value
- Correlation strength classification
- Trend direction identification
- Analysis period information
Dynamic Alert System
The indicator includes sophisticated alert conditions for:
- Bearish trend initiation (positive correlation threshold breach)
- Bullish trend initiation (negative correlation threshold breach)
- Trend direction changes (zero-line crossovers)
Visual Optimization
Advanced visualization features include:
- Customizable color schemes for all components
- Adjustable label sizes and positions
- Transparency controls for better chart visibility
- Warning indicators for potential trend weakening
Technical Implementation
The indicator combines multiple calculation methods:
- Donchian Channel calculations for Ichimoku components
- Pearson correlation coefficient computation with customizable periods
- EMA smoothing for momentum calculations
- Volume-weighted averaging capabilities
- Volatility adjustment mechanisms
Trading Applications
This indicator is particularly effective for:
1. Trend Direction Confirmation
- Multiple timeframe analysis provides comprehensive trend validation
- Pearson correlation adds statistical confidence to trend identification
- Ichimoku cloud formations confirm support and resistance levels
2. Entry and Exit Point Identification
- Cloud breakouts combined with correlation strength indicate potential entry points
- Multi-timeframe momentum alignment helps identify high-probability trades
- Warning indicators assist in timing market exits
3. Risk Management
- Dynamic support and resistance levels from the cloud
- Statistical trend strength measurement
- Multi-timeframe confirmation reduces false signals
Performance Considerations
The indicator uses efficient calculations to maintain good performance while providing comprehensive analysis. The smoothing parameters and analysis periods can be adjusted to balance between responsiveness and reliability.
Future Applications and Research
This combination of indicators opens possibilities for:
- Machine learning integration for pattern recognition
- Additional statistical measures for trend validation
- Enhanced alert systems based on multiple condition combinations
- Further optimization of calculation methods
The innovative combination of traditional Ichimoku analysis with modern statistical methods and multi-timeframe momentum tracking provides traders with a powerful tool for market analysis and decision-making.
Cerca negli script per "ichimoku"

Ichimoku Wave Oscillator with Custom MAIchimoku Wave Oscillator with Custom MA - Pine Script Description
This script uses various types of moving averages (MA) to implement the concept of Ichimoku wave theory for wave analysis. The user can select from SMA, EMA, WMA, TEMA, SMMA to visualize the difference between short-term, medium-term, and long-term waves, while identifying potential buy and sell signals at crossover points.
Key Features:
MA Type Selection:
The user can select from SMA (Simple Moving Average), EMA (Exponential Moving Average), WMA (Weighted Moving Average), TEMA (Triple Exponential Moving Average), and SMMA (Smoothed Moving Average) to calculate the waves. This script is unique in that it combines TEMA and SMMA, distinguishing it from other simple moving average-based indicators.
TEMA (Triple Exponential Moving Average): Best suited for capturing short-term trends with quick responsiveness.
SMMA (Smoothed Moving Average): Useful for identifying long-term trends with minimal noise, providing more stable signals.
Wave Calculations:
The script calculates three waves: Wave 9-17, Wave 17-26, and Wave 9-26, each of which analyzes different time horizons.
Wave 9-17 (blue): Primarily used for analyzing short-term trends, ideal for detecting quick changes.
Wave 17-26 (red): Used to analyze medium-term trends, providing a more stable market direction.
Wave 9-26 (green): Represents long-term trends, suitable for understanding broader trend shifts.
Baseline (0 Line):
Each wave is visualized around the 0 line, where waves above the line indicate an uptrend and waves below the line indicate a downtrend. This allows for easy identification of trend reversals.
Crossover Signals:
CrossUp: When Wave 9-17 (short-term wave) crosses Wave 17-26 (medium-term wave) upward, it is considered a buy signal, indicating a potential upward trend shift.
CrossDown: When Wave 9-17 (short-term wave) crosses Wave 17-26 downward, it is considered a sell signal, indicating a potential downward trend shift.
Background Color for Signal:
The script visually highlights the signals with background colors. When a buy signal occurs, the background turns green, and when a sell signal occurs, the background turns red. This makes it easier to spot reversal points.
Calculation Method:
The script calculates the difference between moving averages to display the wave oscillation. Wave 9-17, Wave 17-26, and Wave 9-26 represent the difference between the moving averages for different time periods, allowing for analysis of short-term, medium-term, and long-term trends.
Wave 9-17 = MA(9) - MA(17): Represents the difference between the short-term moving averages.
Wave 17-26 = MA(17) - MA(26): Represents the difference between medium-term moving averages.
Wave 9-26 = MA(9) - MA(26): Provides insight into the long-term trend.
This calculation method effectively visualizes the oscillation of waves and helps identify trend reversals at crossover points.
Uniqueness of the Script:
Unlike other moving average-based indicators, this script combines TEMA (Triple Exponential Moving Average) and SMMA (Smoothed Moving Average) to capture both short-term sensitivity and long-term stability in trends. This duality makes the script more versatile for different market conditions.
TEMA is ideal for short-term traders who need quick signals, while SMMA is useful for long-term investors seeking stability and noise reduction. By combining these two, this script provides a more refined analysis of trend changes across various timeframes.
How to Use:
This script is effective for trend analysis and reversal detection. By visualizing the crossover points between the waves, users can spot potential buy and sell signals to make more informed trading decisions.
Scalping strategies can rely on Wave 9-17 to detect quick trend changes, while those looking for medium-term trends can analyze signals from Wave 17-26.
For a broader market overview, Wave 9-26 helps users understand the long-term market trend.
This script is built on the concept of wave theory to anticipate trend changes, making it suitable for various timeframes and strategies. The user can tailor the characteristics of the waves by selecting different MA types, allowing for flexible application across different trading strategies.
Ichimoku Wave Oscillator with Custom MA - Pine Script 설명
이 스크립트는 다양한 이동 평균(MA) 유형을 활용하여 일목 파동론의 개념을 기반으로 파동 분석을 시도하는 지표입니다. 사용자는 SMA, EMA, WMA, TEMA, SMMA 중 원하는 이동 평균을 선택할 수 있으며, 이를 통해 단기, 중기, 장기 파동 간의 차이를 시각화하고, 교차점에서 상승 및 하락 신호를 포착할 수 있습니다.
주요 기능:
이동 평균(MA) 유형 선택:
사용자는 SMA(단순 이동 평균), EMA(지수 이동 평균), WMA(가중 이동 평균), TEMA(삼중 지수 이동 평균), SMMA(평활 이동 평균) 중 하나를 선택하여 파동을 계산할 수 있습니다. 이 스크립트는 TEMA와 SMMA의 독창적인 조합을 통해 기존의 단순한 이동 평균 지표와 차별화됩니다.
TEMA(삼중 지수 이동 평균): 빠른 반응으로 단기 트렌드를 포착하는 데 적합합니다.
SMMA(평활 이동 평균): 장기적인 추세를 파악하는 데 유용하며, 노이즈를 최소화하여 안정적인 신호를 제공합니다.
파동(Wave) 계산:
이 스크립트는 Wave 9-17, Wave 17-26, Wave 9-26의 세 가지 파동을 계산하여 각각 단기, 중기, 장기 추세를 분석합니다.
Wave 9-17 (파란색): 주로 단기 추세를 분석하는 데 사용되며, 빠른 추세 변화를 포착하는 데 유용합니다.
Wave 17-26 (빨간색): 중기 추세를 분석하는 데 사용되며, 좀 더 안정적인 시장 흐름을 보여줍니다.
Wave 9-26 (녹색): 장기 추세를 나타내며, 큰 흐름의 방향성을 파악하는 데 적합합니다.
기준선(0 라인):
각 파동은 0 라인을 기준으로 변동성을 시각화합니다. 0 위에 있는 파동은 상승세, 0 아래에 있는 파동은 하락세를 나타내며, 이를 통해 추세의 전환을 쉽게 확인할 수 있습니다.
파동 교차 신호:
CrossUp: Wave 9-17(단기 파동)이 Wave 17-26(중기 파동)을 상향 교차할 때, 상승 신호로 간주됩니다. 이는 단기적인 추세 변화가 발생할 수 있음을 의미합니다.
CrossDown: Wave 9-17(단기 파동)이 Wave 17-26(중기 파동)을 하향 교차할 때, 하락 신호로 해석됩니다. 이는 시장이 약세로 돌아설 가능성을 나타냅니다.
배경 색상 표시:
교차 신호가 발생할 때, 상승 신호는 녹색 배경, 하락 신호는 빨간색 배경으로 시각적으로 강조되어 사용자가 신호를 쉽게 인식할 수 있습니다.
계산 방식:
이 스크립트는 이동 평균 간의 차이를 계산하여 각 파동의 변동성을 나타냅니다. Wave 9-17, Wave 17-26, Wave 9-26은 각각 설정된 주기의 이동 평균(MA)의 차이를 통해, 시장의 단기, 중기, 장기 추세 변화를 시각적으로 표현합니다.
Wave 9-17 = MA(9) - MA(17): 단기 추세의 차이를 나타냅니다.
Wave 17-26 = MA(17) - MA(26): 중기 추세의 차이를 나타냅니다.
Wave 9-26 = MA(9) - MA(26): 장기적인 추세 방향을 파악할 수 있습니다.
이러한 계산 방식은 파동의 변동성을 파악하는 데 유용하며, 추세의 교차점을 통해 상승/하락 신호를 잡아냅니다.
스크립트의 독창성:
이 스크립트는 기존의 이동 평균 기반 지표들과 달리, TEMA(삼중 지수 이동 평균)와 SMMA(평활 이동 평균)을 함께 사용하여 짧은 주기와 긴 주기의 트렌드를 동시에 파악할 수 있도록 설계되었습니다. 이를 통해 단기 트렌드의 민감한 변화와 장기 트렌드의 안정성을 모두 반영합니다.
TEMA는 단기 트레이더에게 빠르고 민첩한 신호를 제공하며, SMMA는 장기 투자자에게 보다 안정적이고 긴 호흡의 트렌드를 파악하는 데 유리합니다. 두 지표의 결합으로, 다양한 시장 환경에서 추세의 변화를 더 정교하게 분석할 수 있습니다.
사용 방법:
이 스크립트는 추세 분석과 변곡점 포착에 효과적입니다. 각 파동 간의 교차점을 시각적으로 확인하고, 상승 또는 하락 신호를 포착하여 매매 시점 결정을 도울 수 있습니다.
스캘핑 전략에서는 Wave 9-17을 주로 참고하여 빠르게 추세 변화를 잡아내고, 중기 추세를 참고하고 싶은 경우 Wave 17-26을 사용해 신호를 분석할 수 있습니다.
장기적인 시장 흐름을 파악하고자 할 때는 Wave 9-26을 통해 큰 트렌드를 확인할 수 있습니다.
이 스크립트는 파동 이론의 개념을 기반으로 시장의 추세 변화를 예측하는 데 유용하며, 다양한 시간대와 전략에 맞추어 사용할 수 있습니다. 특히, 사용자가 선택한 MA 유형에 따라 파동의 특성을 변화시킬 수 있어, 여러 매매 전략에 유연하게 대응할 수 있습니다.

Ichimoku Cloud conversion/base line crossIchimoku conversion/base line crossover to determine trade entrances and exits. Compare crossover point to relationship with the Ichimoku cloud (under, over or within) to determine strength of signal.
Ichimoku OscillatorIchimoku trading signals mapped to an oscillator.
Primarily to indicate bullish and bearish trends.
Forked from:
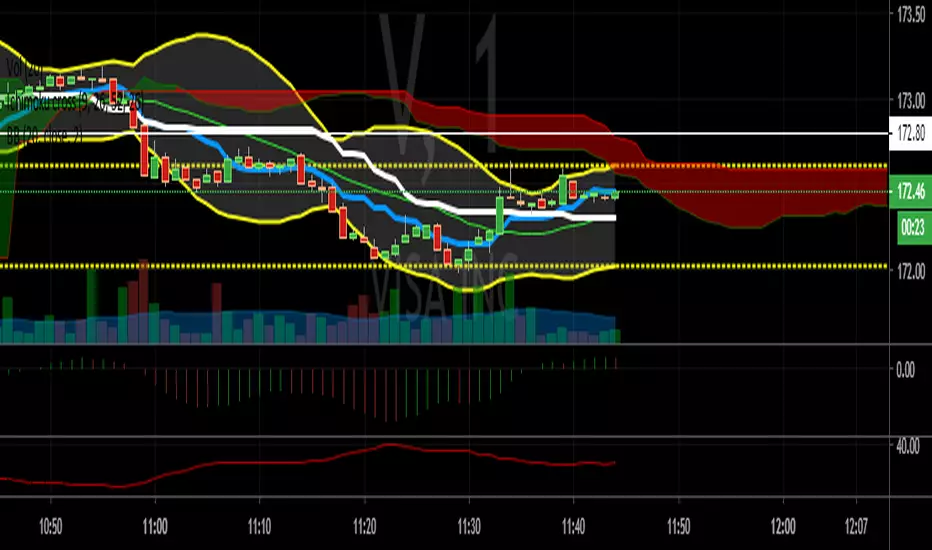
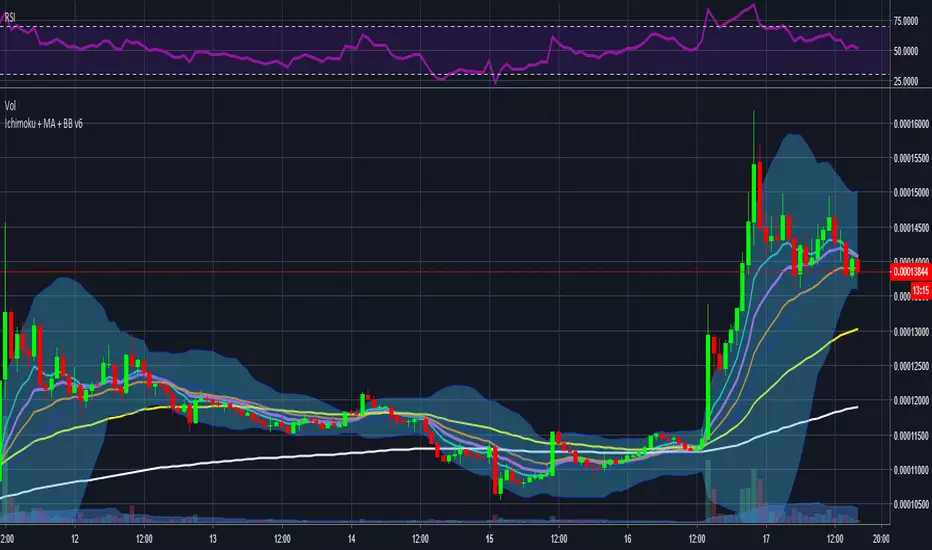
Ichimoku + Moving Average + Bollinger Bands v6Ichimoku cloud + bollinger bands + ema in one single script
Ichimoku Cloud - Stays on 4 hourichimoku cloud that does not leave the 4 hour + doesnt show up at all above 4 hour

Ichimoku And DD Bollinger BandsIchimoku System Plus Double Bolliner Bands
Made in Mexico City with Love.
Alexmoku Genesis v0.2.6 — Runtime BulletproofAlexmoku Genesis v0.2.6 – Reinventing Ichimoku with Precision and Intelligence
Built by Alex • Engineered for traders who demand more than lagging clouds
🔬 Overview
Alexmoku Genesis is a ground-up reimagining of the traditional Ichimoku system — retaining its philosophical foundations of harmony, balance, and structure, while infusing it with modern logic, advanced volatility modeling, and AI-aligned signal classification.
This is not your grandfather’s Ichimoku. Genesis transforms it into a forward-sensing, volatility-aware system that adapts in real time and guides discretionary and algorithmic traders alike with smarter signals, predictive structure, and built-in trade intelligence.
⚙️ Core Enhancements
📐 Volatility-Responsive Smoothing
Tenkan-sen and Kijun-sen lengths are dynamically adjusted based on recent price volatility (ATR-based).
Prevents overreaction in choppy markets and improves responsiveness during strong trends.
🌀 Adaptive Cloud Projection
Span A and Span B are still projected 52 periods forward — but cloud width adapts to market rhythm, not just static values.
🕵️ Enhanced Chikou Span (CKS+)
Chikou logic is upgraded to emphasize structure interaction, not just simple price overlay.
Useful for identifying support/resistance echoes and divergence validation.
🌐 Multi-Timeframe Cloud Awareness (Genesis Core)
Internal alignment checks between higher and lower timeframe Kumo positioning.
Future module support for overlaying MTF clouds.
🔖 Signal Classifier Engine (Experimental)
Each major structure event is tagged with signal intent:
📦 prep
🚀 launch
🔁 reversion
🪤 trap
Enables faster discretionary reads or future automation.
🧠 Trust Score Logic (Coming soon)
Future versions will assign numerical trust scores (1–10) to trade setups based on confluence.
🧰 Settings
🔧 Volatility Scaling Factor – Adjusts how reactive the indicator is to volatility. Default: 300.
🌫 Displacement (Kumo) – Cloud projection forward. Default (and required): 52.
⛅ Cloud Display Toggle – Show/hide Kumo visuals without affecting logic.
⚡️ Future expansion modules already scaffolded (MTF overlays, color-coded signal classifiers, Trust Score engine, etc.)
🧘 Philosophy Behind the System
"This isn’t just about catching runners — it’s about becoming the kind of person who can trade with clarity, peace, and precision."
Alexmoku Genesis reflects the W.E.A.L.T.H. System's holistic philosophy:
Wealth
Engineered
Algorithmic
Leveraged
Trading
Holistically
Trading isn't just a strategy. It's a mirror. Genesis is designed to train both your execution and your awareness.
⚠️ Disclaimer
This tool is designed for experienced technical traders and is still in active development. Use judgment and proper risk management. This is not financial advice.

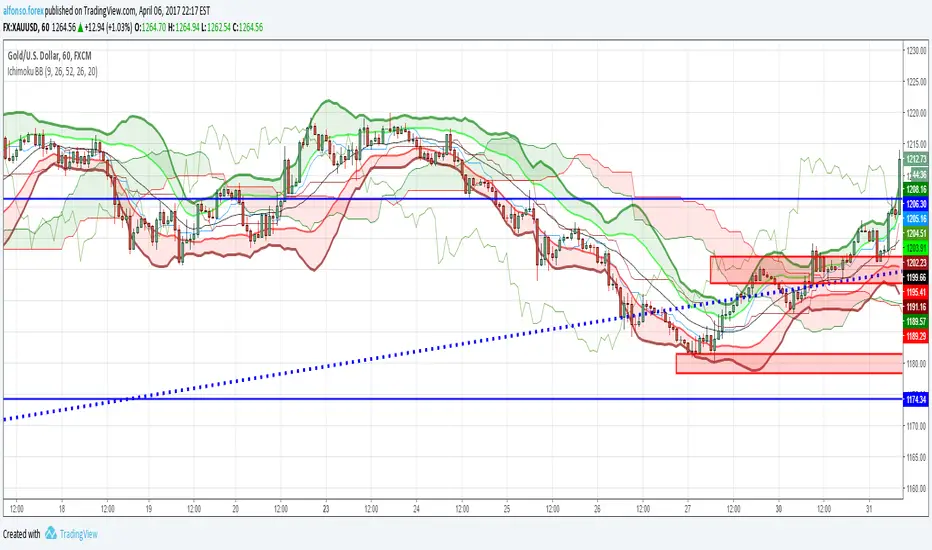
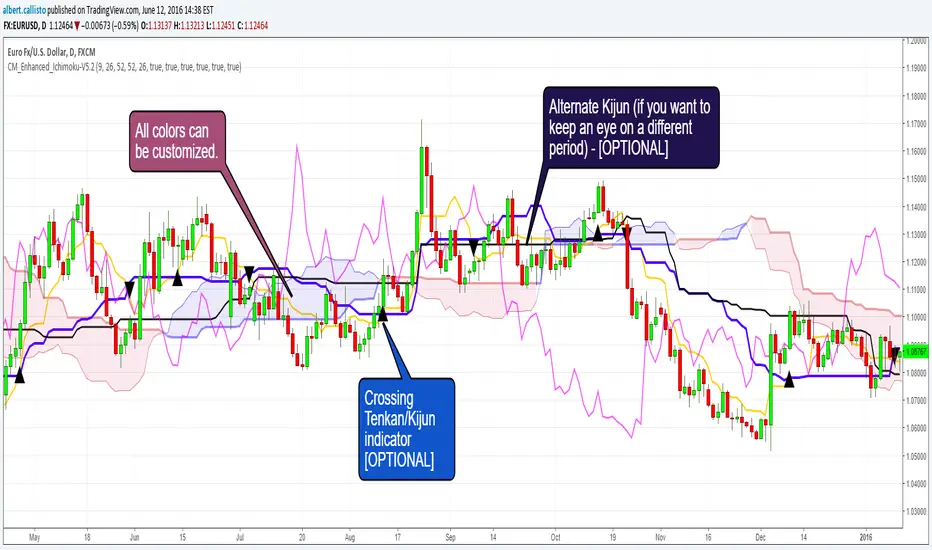
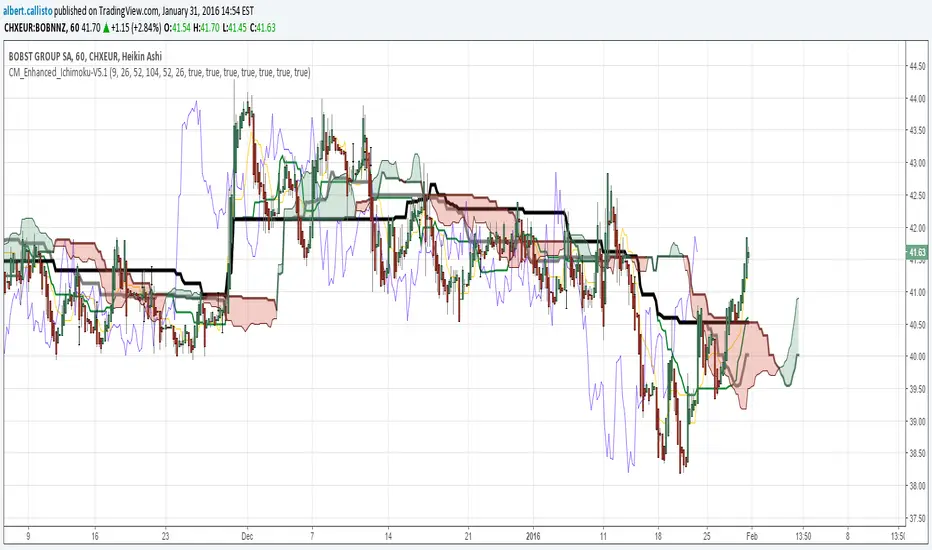
CM_Enhanced_Ichimoku Cloud-V5.2New version of the improved Ichimoku cloud
Original by Chris Moody, great work.
This indicator is a colorized Ichimoku with colors that you can change for any component. Not many changes between 5.1 and 5.2, I fixed some labels and the crossing detection, as well as the default colors.
There's not much more left we can do without radically changing the original Ichimoku. We could implement full-multiframe but you can already do that by adding several times this indicator and changing the periods.
Displayed components:
Kijun-Sen: middle of the highest/lowest prices during the last 26 periods
Tenkan-Sen: middle of the highest/lowest prices during the last 9 periods
Senkou Span A (SSA) : average of Kijun and Tenkan, projected 26 periods ahead
Senkou Span B (SSB): middle of the highest/lowest prices during the last 52 periods, and projected 26 periods ahead
Chikou Span: the closing price projected 26 periods behind.
Kumo: the cloud itself, the area between SSA/SSB.
The script also provides indication of the crossings between Tenkan and Kijun, some trading strategies are based upon that. There is also a separate Kijun with its own period for those you'd like to have this information at another timeframe. I removed the third Kijun that was in version 5.1, I don't think it was widely used and made the configuration screen too crowded. If you really need this, take a look at Donchian indicators, the Kijun is basically a Donchian on 26 periods.
Chris Moody Version (v5):
[DN]DNKUMOThis script draws some of MA line with momentum bar on your chart.
These lines looks like ICHIMOKU. You could use this script like ICHIMOKU, I hope :-)

Macro Risk On/Off SentimentOverview
As an Ichimoku trader, I've always found it crucial to understand the broader market sentiment before entering trades. That's why I developed this Macro Risk On/Off Sentiment Indicator. It's designed to provide a comprehensive view of global market risk sentiment by analysing multiple factors across different asset classes. By combining nine key market indicators, it produces an overall risk sentiment score, giving me a clearer picture of the market's mood before I apply my Ichimoku strategy.
Rationale
While Ichimoku is powerful for identifying trends and potential entry points, I realised it doesn't always capture the broader market context. Markets don't exist in isolation—they're influenced by a myriad of factors including volatility, economic indicators, and cross-asset relationships. By creating this indicator, I aimed to fill that gap, providing myself with a macro view that complements my Ichimoku analysis.
How It Works
The indicator analyses nine different market factors:
VIX (Volatility Index): Measures market expectations of near-term volatility.
S&P 500 Performance: Represents the overall US stock market performance.
US 10-Year Treasury Yield: Indicates bond market sentiment and economic outlook.
Gold Price Movement: Often seen as a safe-haven asset.
US Dollar Index: Measures the strength of the USD against a basket of currencies.
Emerging Markets Performance: Represents risk appetite for higher-risk markets.
High Yield Bond Spreads: Indicates credit market risk sentiment.
Copper/Gold Ratio: An economic growth indicator.
Put/Call Ratio: Measures overall market sentiment based on options trading.
Each factor is assigned a score based on its z-score relative to its recent history, then weighted according to its perceived importance. The overall risk score is a weighted average of these individual scores.
How I Use It
Before applying my Ichimoku strategy, I first check this indicator to gauge the overall market sentiment:
I look at the blue line plotted on the chart, which represents the overall risk score.
I note the background colour: green for risk-on (positive score) and red for risk-off (negative score).
I check the label in the lower-left corner, which provides specific FX pair recommendations and market expectations.
In a risk-on environment (positive score):
I focus on long positions in AUD/JPY, NZD/JPY, EUR/USD, etc.
I look for short opportunities in USD/CAD, USD/NOK, etc.
I expect commodities and yields to rise
In a risk-off environment (negative score):
I focus on long positions in USD/JPY, USD/CHF, USD/CAD
I look for short opportunities in AUD/USD, NZD/USD, EUR/USD
I expect increased volatility and falling yields
The strength of the sentiment is reflected in how close the score is to either 1 (strong risk-on) or -1 (strong risk-off). This helps me gauge how aggressive or conservative I should be with my Ichimoku trades.
Customisation
I've designed this indicator to be flexible. You can modify it to:
Adjust the lookback period and moving average length (both default to 30)
Change the weighting of different factors in the final score calculation
Include or exclude specific factors based on your analysis needs
By combining this Macro Risk On/Off Sentiment Indicator with my Ichimoku analysis, I've found I can make more informed trading decisions, taking into account both the technical setups I see on the chart and the broader market context.

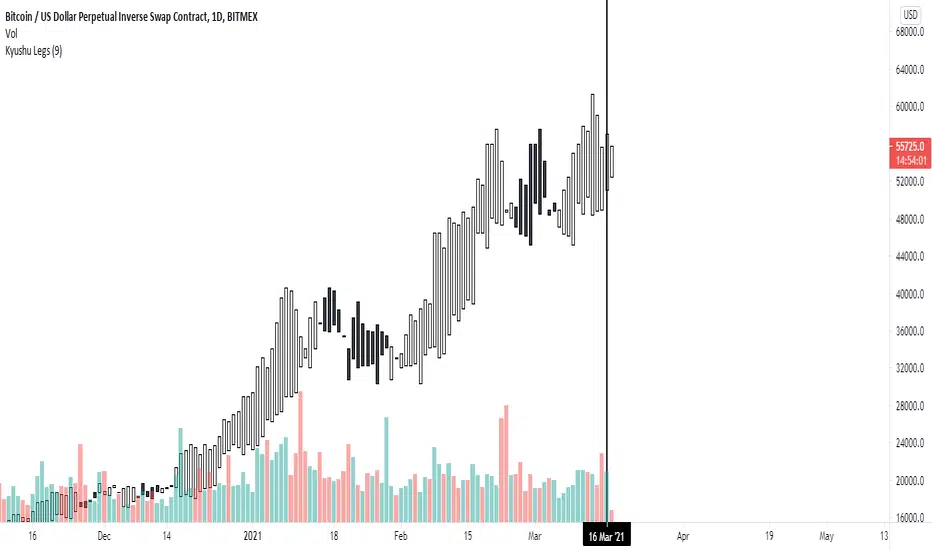
Kyushu LegsKyushu Legs is part of the Ichimoku strategy. Kyushu Legs shows new candle bars which help to find a change of trend.
Legs Kyushu is created every candle based on close 9 candles before the actual open candle. Also, there is a possibility of changing the settings of counting the Legs Kyushu.
Colors change based on trend: the white candles show that the market is bullish, black candles that the market is bearish.
source of the code:


CM_Enhanced_Ichimoku Cloud-V5.1Based upon
Thanks Chris Moody !
Here are my changes, I looked at comments on the original page.
Thinner default lines, changed colors
Added options to add two extra Kijun with their own periods, useful to check resistance/support lines on different scales
Decreased height of arrows
[RS]MTF Ichimoku Cloud V0Request for T_C
The displacement cant be converted (a approximation is possible by calculating the n_bars the time frame occupies by the displacement).

Atareum Volume Ichimuku CandleAVIC (Atareum Volume Ichimoku Candles) is clearly an awesome indicator that is based on Ichimoku concepts by combination with volume. This is a new approach of volume candles that is combined with Ichimoku concepts and creates such a powerful tool to trace the market and assists traders to make better decisions, truly.
Concept:
Using Ichimoku leading periods and calculations on redesigning new candles in combination with volume, that makes unique reform candles on Tenkansen movement, but these new candles clearly omit noises in combination with volume, and then the new redesigned system of cloud calculations builds, new series of data for Senko Span A and Senko Span B which is so odd in first view, because they will barely ever cross each other, but they show very more informative and useful.
Parameters:
Section 1 : Candle colour setting for flourishing just as you desire !
Section 2 : Defining Periods of standard Ichimoku and source of candle data in combination with determining the smoothing type of moving averages and signal period.
Section 3 : Select using Heikin Ashi based candles alongside with redesigned cloud calculation type and three additional moving averages which can plot on each newly generated candles and standard candles on a chart with the type mode defined in the previous section.
Note: if you want to omit any or all of these moving averages, you can use 0 in period, instead of selecting "None" in the plot moving option!
Usage :
Overall:
Regardless of the additional moving averages which will lead to so many situations of market according to their types and designs, that is four different period for new redesign AVIC and three period for standard chart. You can easily select periods and type for these moving averages. Also, do not forget that signal moving averages is shown only on AVIC chart and have two different colour for upward and downward trends. Other moving averages are plot by just one single colour.
Cloud levels are so important because AVIC candles show respect to them and when they break the clouds upward or downward it's surly beginning of a trend that is may last long. Also when cloud levels flatten, it is determining a support or resistance according to up cloud or down cloud nature and as long as they will continue or repeated periodically on same level of AVIC chart, it will implement their weakness or strength.
Support and Resistance:
Any flattens of cloud up or down level means the support or resistance level due to its nature, but important thing is how long the cloud lasts flatten or how many times repeated in the same level in AVIC chart.
For plotting the support or resistance you should trace first candle of start of flattens in standard chart just like following picture.
Divergence:
All Higher high or Lower low of standard chart has its reflect in AVIC chart but there is secret in it, It is named divergence. When standard chart price candles generating lower low but the AVIC chart candles do not cross the bottom, it means we will spike high as soon as AVIC candle chart complete its divergence. You can see perfect example in following picture.
Cloud level Ends
When cloud down level become flattens and cloud up level start a bull run it means we will face a great up trend movement but as soon as cloud down level starts to move up it mean we are going to finish the bull run and maybe it goes with consolidation phase or reversal phase. This reaction is exactly happen in vice versa for bear run trend. You can see both examples in following pictures.
Note: if we face end of bull run and cloud down level make a U turn shape upside down it means we will have reversal phase even not too long but it is sharp and fast reversal. If cloud down level just turn right slightly, it means we should have consolidation phase, mostly or we can continue the last trend slightly. All these situations can happen in vice versa bear run. You can see example in following picture.
Signals:
Long but risky:
You can go long when AVIC candles are green and be in position as long as they are not change in colour.
Long and safe :
You can go long when AVIC candles cross up cloud down level and be in position as long as AVIC candles cross down cloud up level.
Long and sure:
You can go long when AVIC candles cross up cloud up level and be in position as long as AVIC candles cross down cloud down level.
Short but risky:
You can go short when AVIC candles are red and be in position as long as they are not change in colour.
Short and safe :
You can go short when AVIC candles cross down cloud up level and be in position as long as AVIC candles cross up cloud down level.
Short and sure:
You can go short when AVIC candles cross down cloud down level and be in position as long as AVIC candles cross up cloud up level.
Notice : Candles with large body are so strong but if a body candle is weak or flatten it may a signal of changing colour and direction, especially when using Heikin Ashi type.
It is the result of many years of experience in markets and there are so many details about this AVIC chart which I am in the experiment phase to publish in the future, so please help me with your ideas and do not hesitate to comment and inform me any suggestions or criticism.

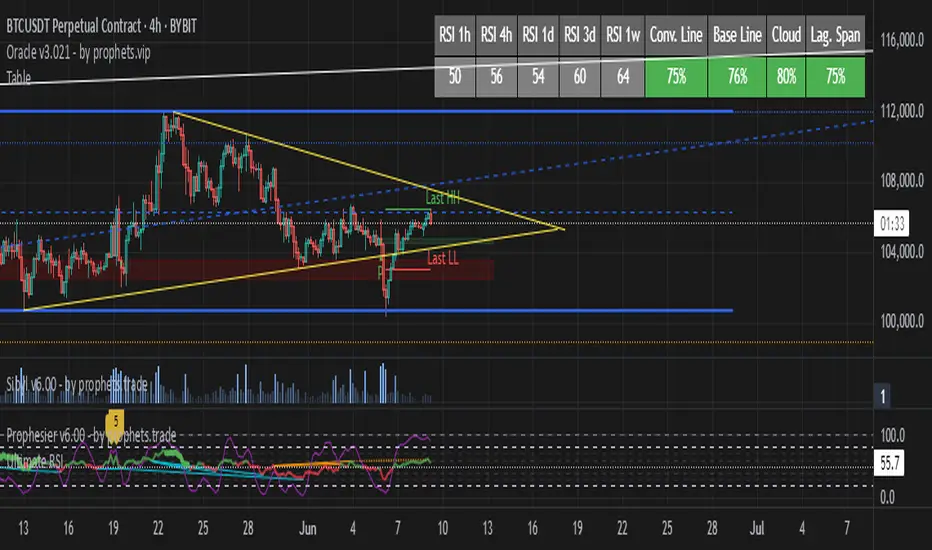
TableRSI and Ichimoku Strength Table
This indicator displays whole-number RSI values (1h, 4h, 1d, 3d, 1w) and Ichimoku strengths (Conversion Line, Base Line, Cloud, Lagging Span) in a customizable table. Toggle between horizontal (9x2) or vertical (2x10) layouts, with adjustable position (e.g., Top Right), text size (Tiny to Large), and colors (border, header, text, RSI: >70 red, <30 green, 30-70 yellow; Ichimoku: >50 green, <50 red). Ichimoku components are plotted on the chart. It offers a clear view of momentum and trend strength for traders.
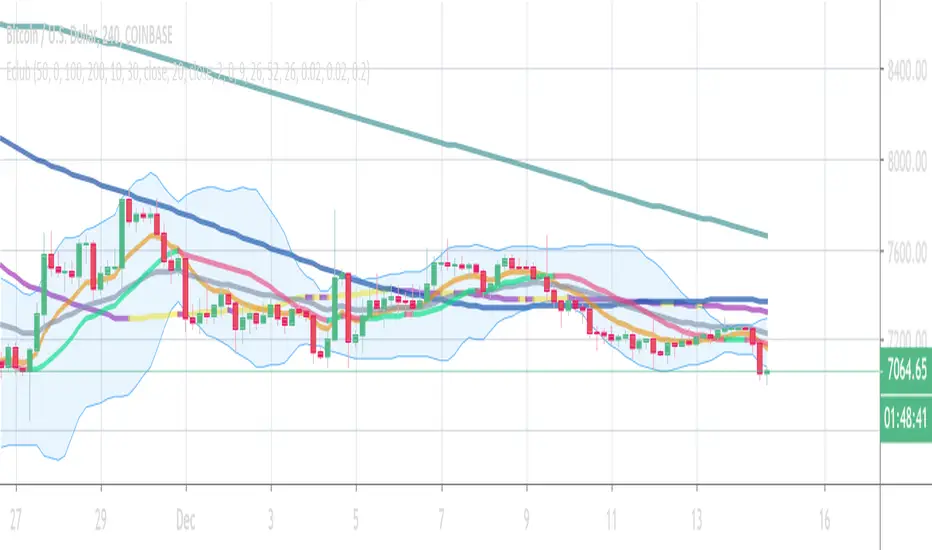
Eclub Multi IndicatorThis multi Indicator includes:
3 Moving Averages
2 Exponential Moving Averages
Bollinger Band
Ichimoku
Parabolic SAR
You can change the colors if you want. Go to setting to enable Ichimoku or SAR or disable others.
The color tolerance is by default zero which results in a very sensitive color change. You can change it to decrease the sensitivity. The value should be the last decimal of the price or the last two decimals of price etc.
If you like this indicator donate some BTC to the following address:
BTC address:
18NSD2xdJyYWoC4CSr4xg1hMk2q5cBbr8T
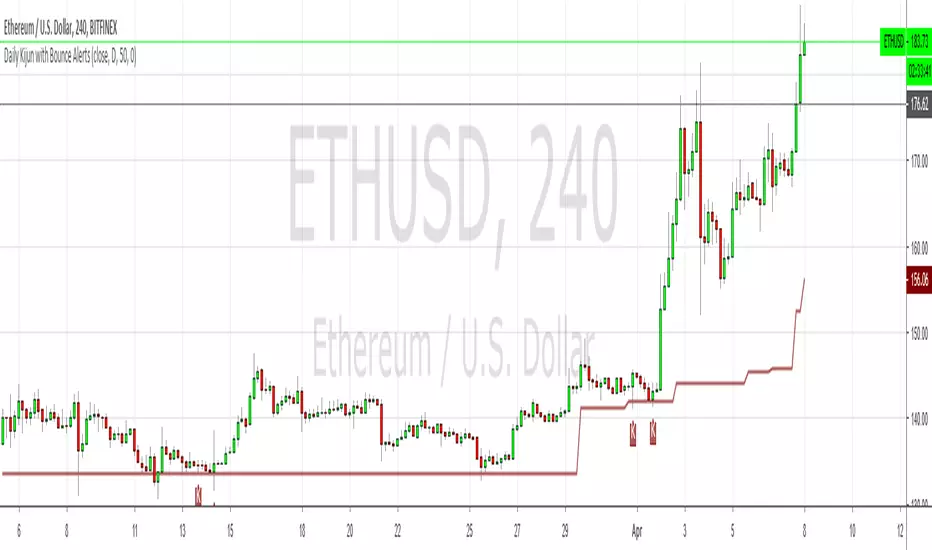
Daily Kijun with Bounce AlertsShows the daily Kijun on all timeframes using a period of 50, which makes it into a dynamic 50% fib of sorts, especially when it's flat. Also shows Kijun bounces labeled with Ks, and allows you to set alerts for bullish, bearish or bi-directional bounces.
It doesn't show any of the other Ichimoku components.
9Week_CandleThe 9-week candle is a candlestick writing method introduced in "Ichimoku Kinko Hyo, Weekly”, which creates positive and negative candles at the closing price of the current week and the opening price of 9 weeks ago to know the current state of the market. By combining the period of the basic numerical value of 9 as one candlestick, it becomes easier to grasp the direction and time relationship.
By default, the upper and lower shadows are displayed, but if you set the shadow color to the same as the background color in the settings, you can display the positive and negative of only the body.
I also created a 3-day candle based on the same method, so please use it as well.
9週足は「一目均衡表週間編」で発表されたローソク足の書き方で、当週の終値と9週前の始値で陽線・陰線を作成し、相場の現在性を知ろうとするものです。9という基本数値の期間を1本のローソク足としてまとめることで方向性と時間関係が把握しやすくなります。
デフォルトでは上ヒゲと下ヒゲが表示されていますが、設定でヒゲの色を背景色と同じにすれば実体のみの陰陽表示が可能です。
同じ考え方で3日足も作成しましたので、併せてご利用ください。