CCT StochRSI [LazyBear]CCT StochRSI, proposed by Steve Karnish of Cedar Creek Trading, reconfigures classic StochRSI using custom parameters and smoothing.
There are 6 types supported.
Common formula:
(rsi - lowest(rsi, x)) / (highest(rsi, y) - lowest(rsi, z)) * 100
Smoothed formula:
ema(common formula result, len)
Settings (values for x/y/z/len in the above formulae):
Type 1: RSILength=21, x=8, y=13, z=13, len=N/A
Type 2: RSILength=21, x=21, y=21, z=21, len=N/A
Type 3: RSILength=14, x=14, y=14, z=14, len=N/A
Type 4: RSILength=21, x=13, y=8, z=13, len=8
Type 5: RSILength=5, x=5, y=5, z=5, len=3
Type 6: RSILength=13, x=13, y=13, z=13, len=3
Apart from these default types, this also supports user-specified custom type (select "0" for "Type" option).
All 6 types:
CCT StochRSI compared against normal StochRSI:
List of my public indicators: bit.ly
List of my app-store indicators: blog.tradingview.com
Cerca negli script per "indicator"

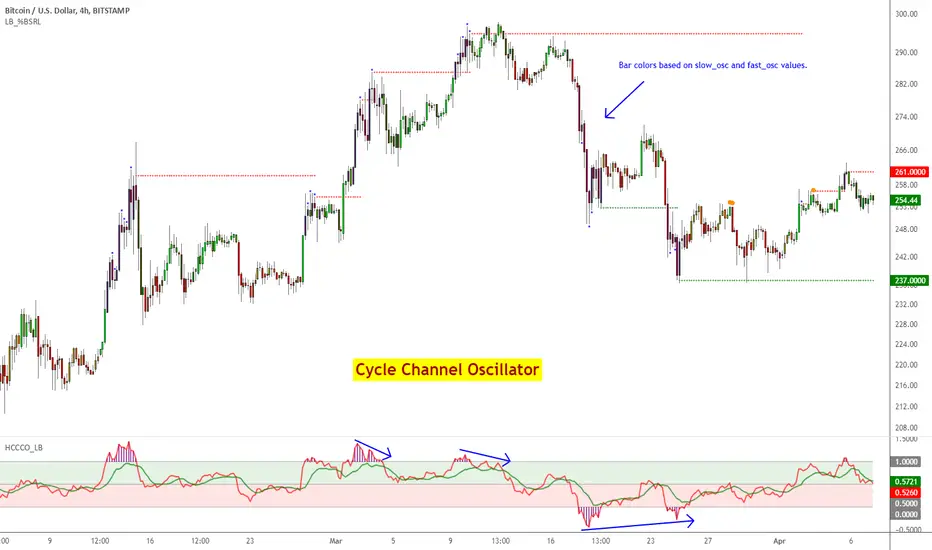
Cycle Channel Oscillator [LazyBear]Here's an oscillator derived from my previous script, Cycle Channel Clone ().
There are 2 oscillator plots - fast & slow. Fast plot shows the price location with in the medium term channel, while slow plot shows the location of short term midline of cycle channel with respect to medium term channel.
Usage of this is similar to %b oscillator. The slow plot can be considered as the signal line.
Bar colors can be enabled via options page. When short plot is above 1.0 or below 0, they are marked purple (both histo and the bar color) to highlight the extreme condition.
This makes use of the default 10/30 values of Cycle Channel, but may need tuning for your instrument.
More info:
List of my free indicators: bit.ly
List of my app-store indicators: blog.tradingview.com (More info: bit.ly)
Liquidity Entry Triggers (4-Model System) | WarRoomXYZLiquidity Entry Triggers is an open-source, price-action-based analytical framework designed to highlight recurring institutional liquidity behaviors that appear across all liquid markets.
The script focuses on how and where liquidity is taken, rather than attempting to predict direction using oscillators or lagging indicators.
It is optimized for XAUUSD, FX pairs, indices, and crypto , particularly on 1m–15m timeframes where session behavior and liquidity reactions are most visible.
This tool is not a buy/sell signal generator .
It provides contextual entry zones based on structural liquidity logic, allowing traders to apply their own execution rules.
Core Philosophy
Markets move because of:
•Trapped traders
•Forced liquidations
•Session-based liquidity cycles
•Reactions at prior institutional participation zones
This script visualizes four repeatable entry triggers that emerge from those mechanisms.
🔹 1. Failed Breakout / Trapped Trader Model
When price breaks a clearly defined range high or low, breakout traders often enter expecting continuation.
If price fails to hold outside the range and closes back inside, those traders become trapped.
The script detects:
•Breaks beyond recent highs/lows
•Immediate rejection back into the range
•Structural failure of momentum
These conditions frequently lead to mean reversion or reversal moves as trapped traders exit and fuel movement in the opposite direction.
Markers are plotted at the point of failure to highlight potential trap zones.
🔹 2. Liquidation Flush Detection
Sharp impulsive candles with abnormally large wicks often represent liquidation cascades rather than healthy trend continuation.
The script identifies liquidation behavior by measuring:
•Wick-to-body imbalance
•Sudden expansion followed by rejection
•Temporary price inefficiencies
These flushes commonly occur near:
•Session highs/lows
•Range extremes
•Trend exhaustion points
Such events often lead to rebalance moves , where price partially or fully fills the wick.
🔹 3. Orderblock Reaction Zones
Orderblocks represent areas where heavy participation occurred before a strong displacement move.
The script highlights:
•Clean bullish and bearish orderblock structures
•Zones formed during consolidation prior to expansion
•Areas likely to be defended when revisited
Orderblocks with minimal noise and clean departure are prioritized, as they often reflect institutional positioning rather than retail activity.
These zones are intended as reaction areas , not automatic entry signals.
🔹 4. London Session Liquidity Sweep Model
The London session frequently establishes the initial daily high or low.
Later in the session or during New York, price often:
•Sweeps internal liquidity around that level
•Rejects after the sweep
•Continues with the higher-timeframe bias
The script monitors London session behavior and marks:
•Liquidity runs above/below London highs and lows
•Rejections back inside the prior structure
This model is especially effective when combined with broader daily context.
🔹4. How the Components Work Together
The framework is designed as a context stack , not a checklist of signals:
Liquidity Event → Location → Timing → Trader Execution
Each model reinforces the others:
•Failed breakouts often occur after liquidity sweeps
•Liquidation wicks frequently form near orderblocks
•London sweeps often trigger failed momentum moves
•Confluence increases probability, not certainty
🔹 Practical Usage Guide
✔ Identify context
Determine whether price is approaching a range extreme, session level, or prior participation zone.
✔ Wait for a liquidity event
Look for a sweep, failed breakout, or liquidation wick.
✔ Observe reaction
Rejection, displacement, or reclaim behavior provides confirmation.
✔ Execute manually
Stops are commonly placed beyond the liquidity extreme.
Targets are typically internal liquidity, prior highs/lows, or imbalance zones.
The indicator does not manage trades or enforce rules.
Execution and risk management remain the trader’s responsibility.
🔹 5. Originality & Design Notes
This script does not replicate or bundle existing indicators.
It introduces:
•A multi-model liquidity entry framework
•Structural failed breakout detection
•Wick-based liquidation imbalance logic
•Session-aware liquidity sweep visualization
•A unified, minimal, non-lagging design
All concepts are based on observable market behavior and integrated into a single analytical tool.
🔹 6. Suitable Markets & Timeframes
Works best on:
•XAUUSD
•Major FX pairs
•Indices
•Liquid crypto markets
Recommended timeframes:
•1m
•5m
•15m
•30m
🔹7. Limitations & Notes
•This is an analytical framework , not a trading system
•All markings are confirmed at candle close (non-repainting)
•No open interest or order flow data is used
•Results depend on user interpretation and execution
•Best used alongside session bias and higher-timeframe structure
Disclaimer
This script is provided for educational and informational purposes only.
It does not constitute financial advice, investment advice, or a recommendation to buy or sell any instrument.
Trading involves risk, and losses can exceed initial deposits.
The author assumes no responsibility for trading decisions made using this tool.
Users are strongly encouraged to test this script in demo or simulation environments and to apply proper risk management, position sizing, and personal discretion at all times.
By using this script, you acknowledge and accept all associated risks.

Bollinger Bands + VWAP + 4-State MACD BackgroundBollinger Bands + VWAP + 4-State MACD Background
An all-in-one technical analysis indicator combining three proven tools with an intelligent momentum-based background visualization system.
📊 FEATURES
Bollinger Bands
Standard Bollinger Bands implementation with full customization options:
Adjustable period length (default: 20)
Multiple moving average types: SMA, EMA, SMMA (RMA), WMA, VWMA
Configurable standard deviation multiplier (default: 2.0)
Visual fill between bands to highlight volatility zones
Offset capability for forward/backward display
Session VWAP (Volume Weighted Average Price)
Automatically resets at the start of each trading session:
Calculates true volume-weighted average price
Resets daily to provide fresh reference levels
Customizable source input (default: HLC3)
Adjustable line appearance (color and width)
Can be toggled on/off as needed
4-State MACD Background System
This is the unique feature of this indicator. The chart background dynamically changes based on MACD momentum analysis, providing instant visual feedback on trend strength and direction:
🟢 Strong Bullish (Bright Green)
MACD line is above signal line
Histogram is growing (momentum accelerating upward)
Indicates strong upward momentum
🟢 Weak Bullish (Pale Green)
MACD line is above signal line
Histogram is shrinking (momentum decelerating)
Early warning signal that uptrend may be weakening
🔴 Strong Bearish (Bright Red)
MACD line is below signal line
Histogram is falling (momentum accelerating downward)
Indicates strong downward momentum
🔴 Weak Bearish (Pale Red)
MACD line is below signal line
Histogram is rising (momentum decelerating)
Early warning signal that downtrend may be weakening
🎯 HOW TO USE
For Trend Trading:
Strong colored backgrounds indicate confirmed momentum in that direction - consider staying with the trend
Weak colored backgrounds signal potential momentum exhaustion - watch for possible reversals
Use VWAP as a dynamic support/resistance level
Bollinger Band breakouts combined with strong MACD backgrounds can confirm trend strength
Price above VWAP + strong bullish background = bullish bias
Price below VWAP + strong bearish background = bearish bias
For Mean Reversion:
Price touching upper/lower Bollinger Bands with weak MACD background may suggest potential reversal
VWAP acts as a mean reversion anchor during range-bound sessions
Background color shifts from strong to weak often precede price direction changes
Look for price return to VWAP when extended beyond bands with weakening momentum
Signal Confirmation:
Strongest signals occur when multiple indicators align:
BB breakout + MACD strong color + price above/below VWAP
Price rejection at BB bands + MACD color weakening
VWAP support/resistance hold + MACD color change
⚙️ SETTINGS
All components are fully customizable through organized input groups:
Bollinger Bands Group:
Period length
Moving average type (SMA/EMA/SMMA/WMA/VWMA)
Source (close/open/high/low/etc.)
Standard deviation multiplier
Offset
VWAP Group:
Toggle show/hide
Source calculation method
Line color
Line width
MACD Group:
Toggle background on/off
Fast length (default: 12)
Slow length (default: 26)
Signal length (default: 9)
Source
Four separate color settings for each momentum state
All colors include transparency controls
💡 EDUCATIONAL VALUE
This indicator teaches important concepts:
How volatility (Bollinger Bands) relates to price movement
The importance of volume-weighted pricing (VWAP)
Momentum analysis through MACD
How combining multiple timeframes and indicators can provide confluence
The difference between trend strength and trend direction
⚠️ IMPORTANT NOTES
This indicator is for educational and informational purposes only
No indicator is perfect - always use proper risk management
Past performance does not guarantee future results
Combine with your own analysis and risk tolerance
Test thoroughly on historical data before live trading
This is not financial advice - use at your own risk
🔧 TECHNICAL DETAILS
Pine Script Version 6
Overlay indicator (displays on price chart)
All calculations use standard, well-documented formulas
Minimal lag due to efficient coding
Compatible with all timeframes and instruments
No repainting - all signals are confirmed on bar close
📝 CHANGELOG
Version 1.0
Initial release
Bollinger Bands with multiple MA types
Session VWAP with daily reset
4-state MACD background system
Full customization options
Developed for traders who want multiple confirmation signals in a clean, organized format without cluttering their charts with separate indicator panels.

Hidden Impulse═══════════════════════════════════════════════════════════════════
HIDDEN IMPULSE - Multi-Timeframe Momentum Detection System
═══════════════════════════════════════════════════════════════════
OVERVIEW
Hidden Impulse is an advanced momentum oscillator that combines the Schaff Trend Cycle (STC) and Force Index into a comprehensive multi-timeframe trading system. Unlike standard implementations of these indicators, this script introduces three distinct trading setups with specific entry conditions, multi-timeframe confirmation, and trend filtering.
═══════════════════════════════════════════════════════════════════
ORIGINALITY & KEY FEATURES
This indicator is original in the following ways:
1. DUAL-TIMEFRAME STC ANALYSIS
Standard STC implementations work on a single timeframe. This script
simultaneously analyzes STC on both your trading timeframe and a higher
timeframe, providing trend context and filtering out low-probability signals.
2. FORCE INDEX INTEGRATION
The script combines STC with Force Index (volume-weighted price momentum)
to confirm the strength behind price moves. This combination helps identify
when momentum shifts are backed by genuine buying/selling pressure.
3. THREE DISTINCT TRADING SETUPS
Rather than generic overbought/oversold signals, the indicator provides
three specific, rule-based setups:
- Setup A: Classic trend-following entries with multi-timeframe confirmation
- Setup B: Divergence-based reversal entries (highest probability)
- Setup C: Mean-reversion bounce trades at extreme levels
4. INTELLIGENT FILTERING
All signals are filtered through:
- 50 EMA trend direction (prevents counter-trend trades)
- Higher timeframe STC alignment (ensures macro trend agreement)
- Force Index confirmation (validates volume support)
═══════════════════════════════════════════════════════════════════
HOW IT WORKS - TECHNICAL EXPLANATION
SCHAFF TREND CYCLE (STC) CALCULATION:
The STC is a cyclical oscillator that combines MACD concepts with stochastic
smoothing to create earlier and smoother trend signals.
Step 1: Calculate MACD
- Fast MA = EMA(close, Length1) — default 23
- Slow MA = EMA(close, Length2) — default 50
- MACD Line = Fast MA - Slow MA
Step 2: First Stochastic Smoothing
- Apply stochastic calculation to MACD
- Stoch1 = 100 × (MACD - Lowest(MACD, Smoothing)) / (Highest(MACD, Smoothing) - Lowest(MACD, Smoothing))
- Smooth result with EMA(Stoch1, Smoothing) — default 10
Step 3: Second Stochastic Smoothing
- Apply stochastic calculation again to the smoothed stochastic
- This creates the final STC value between 0-100
The dual stochastic smoothing makes STC more responsive than MACD while
being smoother than traditional stochastics.
FORCE INDEX CALCULATION:
Force Index measures the power behind price movements by incorporating volume:
Force Raw = (Close - Close ) × Volume
Force Index = EMA(Force Raw, Period) — default 13
Interpretation:
- Positive Force Index = Buying pressure (bulls in control)
- Negative Force Index = Selling pressure (bears in control)
- Force Index crossing zero = Momentum shift
- Divergences with price = Weakening momentum (reversal signal)
TREND FILTER:
A 50-period EMA serves as the trend filter:
- Price above EMA50 = Uptrend → Only LONG signals allowed
- Price below EMA50 = Downtrend → Only SHORT signals allowed
This prevents counter-trend trading which accounts for most losing trades.
═══════════════════════════════════════════════════════════════════
THE THREE TRADING SETUPS - DETAILED
SETUP A: CLASSIC MOMENTUM ENTRY
Concept: Enter when STC exits oversold/overbought zones with trend confirmation
LONG CONDITIONS:
1. Higher timeframe STC > 25 (macro trend is up)
2. Primary timeframe STC crosses above 25 (momentum turning up)
3. Force Index crosses above 0 OR already positive (volume confirms)
4. Price above 50 EMA (local trend is up)
SHORT CONDITIONS:
1. Higher timeframe STC < 75 (macro trend is down)
2. Primary timeframe STC crosses below 75 (momentum turning down)
3. Force Index crosses below 0 OR already negative (volume confirms)
4. Price below 50 EMA (local trend is down)
Best for: Trending markets, continuation trades
Win rate: Moderate (60-65%)
Risk/Reward: 1:2 to 1:3
───────────────────────────────────────────────────────────────────
SETUP B: DIVERGENCE REVERSAL (HIGHEST PROBABILITY)
Concept: Identify exhaustion points where price makes new extremes but
momentum (Force Index) fails to confirm
BULLISH DIVERGENCE:
1. Price makes a lower low (LL) over 10 bars
2. Force Index makes a higher low (HL) — refuses to follow price down
3. STC is below 25 (oversold condition)
Trigger: STC starts rising AND Force Index crosses above zero
BEARISH DIVERGENCE:
1. Price makes a higher high (HH) over 10 bars
2. Force Index makes a lower high (LH) — refuses to follow price up
3. STC is above 75 (overbought condition)
Trigger: STC starts falling AND Force Index crosses below zero
Why this works: Divergences signal that the current trend is losing steam.
When volume (Force Index) doesn't confirm new price extremes, a reversal
is likely.
Best for: Reversal trading, range-bound markets
Win rate: High (70-75%)
Risk/Reward: 1:3 to 1:5
───────────────────────────────────────────────────────────────────
SETUP C: QUICK BOUNCE AT EXTREMES
Concept: Catch rapid mean-reversion moves when price touches EMA50 in
extreme STC zones
LONG CONDITIONS:
1. Price touches 50 EMA from above (pullback in uptrend)
2. STC < 15 (extreme oversold)
3. Force Index > 0 (buyers stepping in)
SHORT CONDITIONS:
1. Price touches 50 EMA from below (pullback in downtrend)
2. STC > 85 (extreme overbought)
3. Force Index < 0 (sellers stepping in)
Best for: Scalping, quick mean-reversion trades
Win rate: Moderate (55-60%)
Risk/Reward: 1:1 to 1:2
Note: Use tighter stops and quick profit-taking
═══════════════════════════════════════════════════════════════════
HOW TO USE THE INDICATOR
STEP 1: CONFIGURE TIMEFRAMES
Primary Timeframe (STC - Primary Timeframe):
- Leave empty to use your current chart timeframe
- This is where you'll take trades
Higher Timeframe (STC - Higher Timeframe):
- Default: 30 minutes
- Recommended ratios:
* 5min chart → 30min higher TF
* 15min chart → 1H higher TF
* 1H chart → 4H higher TF
* Daily chart → Weekly higher TF
───────────────────────────────────────────────────────────────────
STEP 2: ADJUST STC PARAMETERS FOR YOUR MARKET
Default (23/50/10) works well for stocks and forex, but adjust for:
CRYPTO (volatile):
- Length 1: 15
- Length 2: 35
- Smoothing: 8
(Faster response for rapid price movements)
STOCKS (standard):
- Length 1: 23
- Length 2: 50
- Smoothing: 10
(Balanced settings)
FOREX MAJORS (slower):
- Length 1: 30
- Length 2: 60
- Smoothing: 12
(Filters out noise in 24/7 markets)
───────────────────────────────────────────────────────────────────
STEP 3: ENABLE YOUR PREFERRED SETUPS
Toggle setups based on your trading style:
Conservative Trader:
✓ Setup B (Divergence) — highest win rate
✗ Setup A (Classic) — only in strong trends
✗ Setup C (Bounce) — too aggressive
Trend Trader:
✓ Setup A (Classic) — primary signals
✓ Setup B (Divergence) — for entries on pullbacks
✗ Setup C (Bounce) — not suitable for trending
Scalper:
✓ Setup C (Bounce) — quick in-and-out
✓ Setup B (Divergence) — high probability scalps
✗ Setup A (Classic) — too slow
───────────────────────────────────────────────────────────────────
STEP 4: READ THE SIGNALS
ON THE CHART:
Labels appear when conditions are met:
Green labels:
- "LONG A" — Setup A long entry
- "LONG B DIV" — Setup B divergence long (best signal)
- "LONG C" — Setup C bounce long
Red labels:
- "SHORT A" — Setup A short entry
- "SHORT B DIV" — Setup B divergence short (best signal)
- "SHORT C" — Setup C bounce short
IN THE INDICATOR PANEL (bottom):
- Blue line = Primary timeframe STC
- Orange dots = Higher timeframe STC (optional)
- Green/Red bars = Force Index histogram
- Dashed lines at 25/75 = Entry/Exit zones
- Background shading = Oversold (green) / Overbought (red)
INFO TABLE (top-right corner):
Shows real-time status:
- STC values for both timeframes
- Force Index direction
- Price position vs EMA
- Current trend direction
- Active signal type
═══════════════════════════════════════════════════════════════════
TRADING STRATEGY & RISK MANAGEMENT
ENTRY RULES:
Priority ranking (best to worst):
1st: Setup B (Divergence) — wait for these
2nd: Setup A (Classic) — in confirmed trends only
3rd: Setup C (Bounce) — scalping only
Confirmation checklist before entry:
☑ Signal label appears on chart
☑ TREND in info table matches signal direction
☑ Higher timeframe STC aligned (check orange dots or table)
☑ Force Index confirming (check histogram color)
───────────────────────────────────────────────────────────────────
STOP LOSS PLACEMENT:
Setup A (Classic):
- LONG: Below recent swing low
- SHORT: Above recent swing high
- Typical: 1-2 ATR distance
Setup B (Divergence):
- LONG: Below the divergence low
- SHORT: Above the divergence high
- Typical: 0.5-1.5 ATR distance
Setup C (Bounce):
- LONG: 5-10 pips below EMA50
- SHORT: 5-10 pips above EMA50
- Typical: 0.3-0.8 ATR distance
───────────────────────────────────────────────────────────────────
TAKE PROFIT TARGETS:
Conservative approach:
- Exit when STC reaches opposite level
- LONG: Exit when STC > 75
- SHORT: Exit when STC < 25
Aggressive approach:
- Hold until opposite signal appears
- Trail stop as STC moves in your favor
Partial profits:
- Take 50% at 1:2 risk/reward
- Let remaining 50% run to target
───────────────────────────────────────────────────────────────────
WHAT TO AVOID:
❌ Trading Setup A in sideways/choppy markets
→ Wait for clear trend or use Setup B only
❌ Ignoring higher timeframe STC
→ Always check orange dots align with your direction
❌ Taking signals against the major trend
→ If weekly trend is down, be cautious with longs
❌ Overtrading Setup C
→ Maximum 2-3 bounce trades per session
❌ Trading during low volume periods
→ Force Index becomes unreliable
═══════════════════════════════════════════════════════════════════
ALERTS CONFIGURATION
The indicator includes 8 alert types:
Individual setup alerts:
- "Setup A - LONG" / "Setup A - SHORT"
- "Setup B - DIV LONG" / "Setup B - DIV SHORT" ⭐ recommended
- "Setup C - BOUNCE LONG" / "Setup C - BOUNCE SHORT"
Combined alerts:
- "ANY LONG" — fires on any long signal
- "ANY SHORT" — fires on any short signal
Recommended alert setup:
- Create "Setup B - DIV LONG" and "Setup B - DIV SHORT" alerts
- These are the highest probability signals
- Set "Once Per Bar Close" to avoid false alerts
═══════════════════════════════════════════════════════════════════
VISUALIZATION SETTINGS
Show Labels on Chart:
Toggle on/off the signal labels (green/red)
Disable for cleaner chart once you're familiar with the indicator
Show Higher TF STC:
Toggle the orange dots showing higher timeframe STC
Useful for visual confirmation of multi-timeframe alignment
Info Panel:
Cannot be disabled — always shows current status
Positioned top-right to avoid chart interference
═══════════════════════════════════════════════════════════════════
EXAMPLE TRADE WALKTHROUGH
SETUP B DIVERGENCE LONG EXAMPLE:
1. Market Context:
- Price in downtrend, below 50 EMA
- Multiple lower lows forming
- STC below 25 (oversold)
2. Divergence Formation:
- Price makes new low at $45.20
- Force Index refuses to make new low (higher low forms)
- This indicates selling pressure weakening
3. Signal Trigger:
- STC starts turning up
- Force Index crosses above zero
- Label appears: "LONG B DIV"
4. Trade Execution:
- Entry: $45.50 (current price at signal)
- Stop Loss: $44.80 (below divergence low)
- Target 1: $47.90 (STC reaches 75) — risk/reward 1:3.4
- Target 2: Opposite signal or trail stop
5. Trade Management:
- Price rallies to $47.20
- STC reaches 68 (approaching target zone)
- Take 50% profit, move stop to breakeven
- Exit remaining at $48.10 when STC crosses 75
Result: 3.7R gain
═══════════════════════════════════════════════════════════════════
ADVANCED TIPS
1. MULTI-TIMEFRAME CONFLUENCE
For highest probability trades, wait for:
- Primary TF signal
- Higher TF STC aligned (>25 for longs, <75 for shorts)
- Even higher TF trend in same direction (manual check)
2. VOLUME CONFIRMATION
Watch the Force Index histogram:
- Increasing bar size = Strengthening momentum
- Decreasing bar size = Weakening momentum
- Use this to gauge signal strength
3. AVOID THESE MARKET CONDITIONS
- Major news events (Force Index becomes erratic)
- Market open first 30 minutes (volatility spikes)
- Low liquidity instruments (Force Index unreliable)
- Extreme trending days (wait for pullbacks)
4. COMBINE WITH SUPPORT/RESISTANCE
Best signals occur near:
- Key horizontal levels
- Fibonacci retracements
- Previous day's high/low
- Psychological round numbers
5. SESSION AWARENESS
- Asia session: Use lower timeframes, Setup C works well
- London session: Setup A and B both effective
- New York session: All setups work, highest volume
═══════════════════════════════════════════════════════════════════
INDICATOR WINDOWS LAYOUT
MAIN CHART:
- Price action
- 50 EMA (green/red)
- Signal labels
- Info panel
INDICATOR WINDOW:
- STC oscillator (blue line, 0-100 scale)
- Higher TF STC (orange dots, optional)
- Force Index histogram (green/red bars)
- Reference levels (25, 50, 75)
- Background zones (green oversold, red overbought)
═══════════════════════════════════════════════════════════════════
PERFORMANCE OPTIMIZATION
For best results:
Backtesting:
- Test on your specific instrument and timeframe
- Adjust STC parameters if win rate < 55%
- Record which setup works best for your market
Position Sizing:
- Risk 1-2% per trade
- Setup B can use 2% risk (higher win rate)
- Setup C should use 1% risk (lower win rate)
Trade Frequency:
- Setup B: 2-5 signals per week (be patient)
- Setup A: 5-10 signals per week
- Setup C: 10+ signals per week (scalping)
═══════════════════════════════════════════════════════════════════
CREDITS & REFERENCES
This indicator builds upon established technical analysis concepts:
Schaff Trend Cycle:
- Developed by Doug Schaff (1996)
- Original concept published in Technical Analysis of Stocks & Commodities
- Implementation based on standard STC formula
Force Index:
- Developed by Dr. Alexander Elder
- Described in "Trading for a Living" (1993)
- Classic volume-momentum indicator
The multi-timeframe integration, three-setup system, and specific
entry conditions are original contributions of this indicator.
═══════════════════════════════════════════════════════════════════
DISCLAIMER
This indicator is a technical analysis tool and does not guarantee profits.
Past performance is not indicative of future results. Always:
- Use proper risk management
- Test on demo account first
- Combine with fundamental analysis
- Never risk more than you can afford to lose
═══════════════════════════════════════════════════════════════════
SUPPORT & QUESTIONS
If you find this indicator helpful, please:
- Leave a like and comment
- Share your feedback and results
- Report any bugs or issues
For questions about usage or optimization for specific markets,
feel free to comment below.
═════════════════════════════════════════════════════════════

Multi-Timeframe Trend Indicator with Signals═══════════════════════════════════════════════════════════════
Multi-Timeframe Trend Indicator with Signals
by Zakaria Safri
═══════════════════════════════════════════════════════════════
⚠️ IMPORTANT DISCLAIMERS:
━━━━━━━━━━━━━━━━━━━━━━━━━━━━━━━━━━━━━━━━━━━━━━━━━━━━━━━━━━━━━━
• This indicator may REPAINT on unconfirmed bars
• Signals appear in real-time but may change or disappear
• FOR EDUCATIONAL PURPOSES ONLY - NOT FINANCIAL ADVICE
• Past performance does not guarantee future results
• Always do your own research and use proper risk management
• The Risk Management feature is VISUAL ONLY - does not execute trades
━━━━━━━━━━━━━━━━━━━━━━━━━━━━━━━━━━━━━━━━━━━━━━━━━━━━━━━━━━━━━━
📊 OVERVIEW:
━━━━━━━━━━━━━━━━━━━━━━━━━━━━━━━━━━━━━━━━━━━━━━━━━━━━━━━━━━━━━━
This indicator combines multiple technical analysis tools to help identify
potential trend directions and entry/exit points across different timeframes.
It uses SuperTrend, EMAs, ADX, RSI, and Keltner Channels to generate signals.
🎯 KEY FEATURES:
━━━━━━━━━━━━━━━━━━━━━━━━━━━━━━━━━━━━━━━━━━━━━━━━━━━━━━━━━━━━━━
📍 SIGNAL TYPES:
• All Signals: Shows all SuperTrend crossovers
• Filtered Signals: Additional EMA filter for potentially higher quality signals
• Signals use barstate.isconfirmed to reduce (but not eliminate) repainting
📈 TREND ANALYSIS:
• Trend Ribbon: 8 EMAs creating a visual trend direction indicator
• Trend Cloud: EMA 150/250 cloud for long-term trend context
• Chaos Trend Line: Dynamic support/resistance trend line
• Multi-timeframe dashboard showing trend across 8 timeframes (3m to Daily)
📊 TECHNICAL INDICATORS:
• Keltner Channels: Dynamic price channels
• RSI Background: Visual overbought/oversold zones
• Candlestick Coloring: Three modes (CleanScalper/Trend Ribbon/Moving Average)
• ADX-based trend strength analysis for MTF dashboard
🎯 VISUAL TOOLS:
• Order Blocks: Supply/demand zones (optional)
• Channel Breakouts: Pivot-based support/resistance levels
• Reversal Signals: RSI-based potential reversal indicators
• Visual TP/SL Lines: For reference only - does NOT execute trades
📊 DASHBOARD:
• Real-time multi-timeframe trend analysis
• Volatility indicator (Very Low to Very High)
• Current RSI value with color coding
• Customizable position and size
⚙️ SETTINGS:
━━━━━━━━━━━━━━━━━━━━━━━━━━━━━━━━━━━━━━━━━━━━━━━━━━━━━━━━━━━━━━
MAIN SETTINGS:
• Sensitivity: Controls signal frequency (lower = more signals)
• Signal Type: Choose between All Signals or Filtered Signals
• Factor: ATR multiplier for SuperTrend calculation
TREND SETTINGS:
• Toggle Trend Ribbon, Trend Cloud, Chaos Trend, Order Blocks
• Moving Average: Customizable EMA (default 200)
ADVANCED SETTINGS:
• Candlestick coloring with 3 different modes
• Overbought/Oversold background coloring
• Channel breakout levels
• Show/hide signals
RISK MANAGEMENT (VISUAL ONLY):
• ⚠️ Does NOT execute trades automatically
• Shows potential Take Profit levels (TP1, TP2, TP3)
• Shows potential Stop Loss level
• Adjustable TP strength multiplier
• For educational reference only
📖 HOW TO USE:
━━━━━━━━━━━━━━━━━━━━━━━━━━━━━━━━━━━━━━━━━━━━━━━━━━━━━━━━━━━━━━
1. SIGNAL INTERPRETATION:
• "Buy" signals appear below candles when conditions are met
• "Sell" signals appear above candles when conditions are met
• Wait for bar close confirmation to avoid repainting
• Use multiple timeframes for confluence
2. TREND CONFIRMATION:
• Check the multi-timeframe dashboard for trend alignment
• Use Trend Ribbon for visual trend direction
• Trend Cloud shows longer-term market bias
• Green candles = potential uptrend, Red = potential downtrend
3. ENTRY/EXIT STRATEGY:
• Combine signals with other analysis tools
• Check volatility status before entering trades
• Use support/resistance levels for confirmation
• The visual TP/SL lines are for planning only
4. RISK MANAGEMENT:
• Always use stop losses (indicator shows suggested levels only)
• Position size according to your risk tolerance
• Never risk more than you can afford to lose
• The indicator does NOT manage trades automatically
⚠️ LIMITATIONS & RISKS:
━━━━━━━━━━━━━━━━━━━━━━━━━━━━━━━━━━━━━━━━━━━━━━━━━━━━━━━━━━━━━━
REPAINTING:
• Signals may appear and disappear on unconfirmed bars
• Always wait for bar close before taking action
• Historical performance may look better than real-time results
FALSE SIGNALS:
• No indicator is 100% accurate
• Signals can fail in ranging/choppy markets
• Use additional confirmation methods
• Consider market context and fundamentals
VISUAL TP/SL:
• Lines are for reference/planning only
• Does NOT place or manage actual trades
• You must manually set your own stop losses
• TP levels are calculated estimates, not guarantees
🔧 TECHNICAL DETAILS:
━━━━━━━━━━━━━━━━━━━━━━━━━━━━━━━━━━━━━━━━━━━━━━━━━━━━━━━━━━━━━━
• Version: Pine Script v5
• Overlay: Yes (displays on main chart)
• Anti-repaint measures: Uses barstate.isconfirmed on signals
• Security function: Uses lookahead protection for higher timeframes
• Dynamic requests: Enabled for MTF analysis
• Max labels: 500
📚 COMPONENTS EXPLAINED:
━━━━━━━━━━━━━━━━━━━━━━━━━━━━━━━━━━━━━━━━━━━━━━━━━━━━━━━━━━━━━━
SUPERTREND:
• Core signal generator using ATR-based bands
• Crossovers indicate potential trend changes
• Adjustable via Sensitivity and Factor inputs
EMA FILTER:
• Uses 200 EMA as trend filter (customizable)
• Filtered signals require price above/below EMA
• Helps reduce false signals in ranging markets
ADX TREND QUALITY:
• Measures trend strength across timeframes
• Used in multi-timeframe dashboard
• Shows Bullish/Bearish/Neutral states
KELTNER CHANNELS:
• Multiple bands showing volatility zones
• Color-coded based on RSI levels
• Helps identify overbought/oversold conditions
ORDER BLOCKS:
• Identifies supply/demand zones
• Based on price structure and pivots
• Can extend to the right for projection
💡 BEST PRACTICES:
━━━━━━━━━━━━━━━━━━━━━━━━━━━━━━━━━━━━━━━━━━━━━━━━━━━━━━━━━━━━━━
✓ Use multiple timeframe confirmation
✓ Wait for bar close before acting on signals
✓ Combine with support/resistance analysis
✓ Check overall market conditions
✓ Use proper risk management (1-2% per trade)
✓ Backtest on your specific market/timeframe
✓ Paper trade before using real money
✓ Keep a trading journal
✓ Adjust settings to your trading style
✗ Don't rely solely on this indicator
✗ Don't ignore risk management
✗ Don't trade on unconfirmed signals
✗ Don't overtrade every signal
✗ Don't use without understanding how it works
✗ Don't expect the TP/SL feature to trade for you
📞 SUPPORT & UPDATES:
━━━━━━━━━━━━━━━━━━━━━━━━━━━━━━━━━━━━━━━━━━━━━━━━━━━━━━━━━━━━━━
Creator: Zakaria Safri
Version: 4.3 (Compliance Update)
For questions or feedback, please use TradingView's comment section.
⚖️ FINAL DISCLAIMER:
━━━━━━━━━━━━━━━━━━━━━━━━━━━━━━━━━━━━━━━━━━━━━━━━━━━━━━━━━━━━━━
This indicator is provided for EDUCATIONAL and INFORMATIONAL purposes only.
It is NOT financial advice, investment advice, or a recommendation to buy/sell.
Trading involves substantial risk of loss. Past performance, whether actual or
indicated by historical tests of strategies, is not indicative of future results.
The creator assumes NO responsibility for your trading results. You are solely
responsible for your own investment decisions and due diligence.
Always consult with a qualified financial advisor before making investment decisions.
By using this indicator, you acknowledge and accept these risks and limitations.

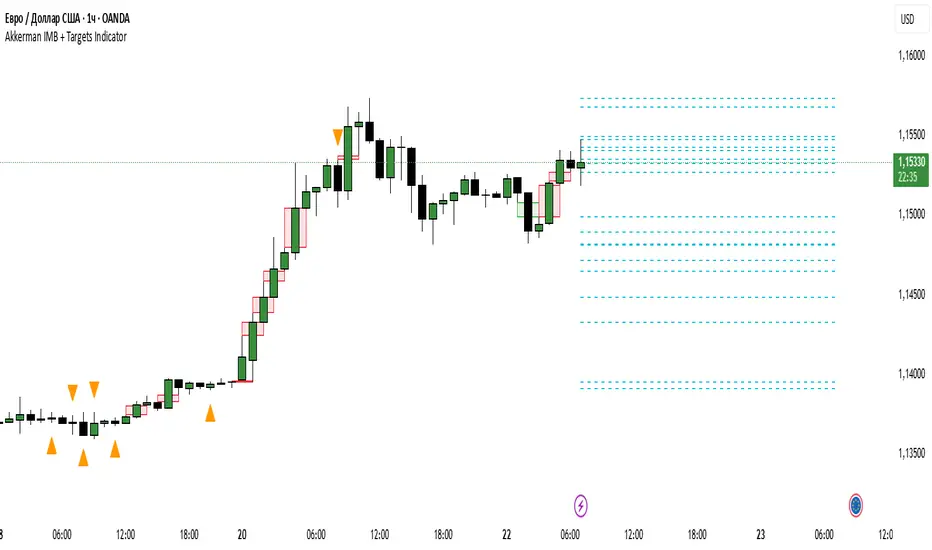
Akkerman IMB + Targets IndicatorAkkerman IMB + Targets Indicator
The Akkerman IMB + Targets Indicator is a powerful tool for traders who use the Smart Money Concept (SMC) methodology for intraday trading. This indicator combines several key elements of technical analysis, such as IMB (Imbalance) zones, liquidity zones, and intraday targets, to help traders identify significant levels on the chart for potential entry and exit points.
Main Features of the Indicator:
IMB (Imbalance) Zones:
The indicator detects IMB zones (imbalances) on the chart, which are often significant for the market because these zones can signal unsupported price moves where the market may either retrace or continue the move.
Green box — indicates a bullish IMB, where the price moves downward but does not reach the previous "low" level.
Red box — indicates a bearish IMB, where the price moves upward but does not reach the previous "high" level.
Liquidity Zones:
The indicator automatically identifies liquidity zones, which are critical levels for potential retracements or breakouts. These zones are determined by equal highs and lows on the chart (where the price has made similar highs or lows).
Triangles or lines highlight levels where significant buy or sell orders might be gathered.
Intraday Target Lines:
The indicator generates targets for intraday trading based on support and resistance levels over the last 10 periods.
These target lines on the chart indicate potential entry or exit points based on the lowest and highest prices over the past 10 bars, which represent key points for trading within the current session.
Indicator Settings:
Show IMB: Toggle to show or hide IMB zones on the chart.
Show Liquidity Zones: Toggle to show or hide liquidity zones on the chart.
Show Targets (Intraday): Toggle to show or hide intraday target lines.
Max Targets (maxTargets): Set the maximum number of targets to display on the chart.
How to Use:
IMB Zones help identify potential retracement or breakout zones on the market. These zones are a critical part of Smart Money analysis, as markets often retrace to these areas after significant price moves.
Liquidity Zones provide clues about where large orders may be gathered, which could lead to a retracement or breakout.
Intraday Targets assist in identifying important levels for entering or exiting trades within the current session to take advantage of short-term price movements.
Important Notes:
This indicator works best on the 1-hour timeframe (H1) for more accurate and stable signals.
For maximum effectiveness, it is recommended to combine this indicator with other technical indicators and analysis methods.
RSI Forecast [Titans_Invest]RSI Forecast
Introducing one of the most impressive RSI indicators ever created – arguably the best on TradingView, and potentially the best in the world.
RSI Forecast is a visionary evolution of the classic RSI, merging powerful customization with groundbreaking predictive capabilities. While preserving the core principles of traditional RSI, it takes analysis to the next level by allowing users to anticipate potential future RSI movements.
Real-Time RSI Forecasting:
For the first time ever, an RSI indicator integrates linear regression using the least squares method to accurately forecast the future behavior of the RSI. This innovation empowers traders to stay one step ahead of the market with forward-looking insight.
Highly Customizable:
Easily adapt the indicator to your personal trading style. Fine-tune a variety of parameters to generate signals perfectly aligned with your strategy.
Innovative, Unique, and Powerful:
This is the world’s first RSI Forecast to apply this predictive approach using least squares linear regression. A truly elite-level tool designed for traders who want a real edge in the market.
⯁ SCIENTIFIC BASIS LINEAR REGRESSION
Linear Regression is a fundamental method of statistics and machine learning, used to model the relationship between a dependent variable y and one or more independent variables 𝑥.
The general formula for a simple linear regression is given by:
y = β₀ + β₁x + ε
Where:
y = is the predicted variable (e.g. future value of RSI)
x = is the explanatory variable (e.g. time or bar index)
β0 = is the intercept (value of 𝑦 when 𝑥 = 0)
𝛽1 = is the slope of the line (rate of change)
ε = is the random error term
The goal is to estimate the coefficients 𝛽0 and 𝛽1 so as to minimize the sum of the squared errors — the so-called Random Error Method Least Squares.
⯁ LEAST SQUARES ESTIMATION
To minimize the error between predicted and observed values, we use the following formulas:
β₁ = /
β₀ = ȳ - β₁x̄
Where:
∑ = sum
x̄ = mean of x
ȳ = mean of y
x_i, y_i = individual values of the variables.
Where:
x_i and y_i are the means of the independent and dependent variables, respectively.
i ranges from 1 to n, the number of observations.
These equations guarantee the best linear unbiased estimator, according to the Gauss-Markov theorem, assuming homoscedasticity and linearity.
⯁ LINEAR REGRESSION IN MACHINE LEARNING
Linear regression is one of the cornerstones of supervised learning. Its simplicity and ability to generate accurate quantitative predictions make it essential in AI systems, predictive algorithms, time series analysis, and automated trading strategies.
By applying this model to the RSI, you are literally putting artificial intelligence at the heart of a classic indicator, bringing a new dimension to technical analysis.
⯁ VISUAL INTERPRETATION
Imagine an RSI time series like this:
Time →
RSI →
The regression line will smooth these values and extend them n periods into the future, creating a predicted trajectory based on the historical moment. This line becomes the predicted RSI, which can be crossed with the actual RSI to generate more intelligent signals.
⯁ SUMMARY OF SCIENTIFIC CONCEPTS USED
Linear Regression Models the relationship between variables using a straight line.
Least Squares Minimizes the sum of squared errors between prediction and reality.
Time Series Forecasting Estimates future values based on historical data.
Supervised Learning Trains models to predict outputs from known inputs.
Statistical Smoothing Reduces noise and reveals underlying trends.
⯁ WHY THIS INDICATOR IS REVOLUTIONARY
Scientifically-based: Based on statistical theory and mathematical inference.
Unprecedented: First public RSI with least squares predictive modeling.
Intelligent: Built with machine learning logic.
Practical: Generates forward-thinking signals.
Customizable: Flexible for any trading strategy.
⯁ CONCLUSION
By combining RSI with linear regression, this indicator allows a trader to predict market momentum, not just follow it.
RSI Forecast is not just an indicator — it is a scientific breakthrough in technical analysis technology.
⯁ Example of simple linear regression, which has one independent variable:
⯁ In linear regression, observations ( red ) are considered to be the result of random deviations ( green ) from an underlying relationship ( blue ) between a dependent variable ( y ) and an independent variable ( x ).
⯁ Visualizing heteroscedasticity in a scatterplot against 100 random fitted values using Matlab:
⯁ The data sets in the Anscombe's quartet are designed to have approximately the same linear regression line (as well as nearly identical means, standard deviations, and correlations) but are graphically very different. This illustrates the pitfalls of relying solely on a fitted model to understand the relationship between variables.
⯁ The result of fitting a set of data points with a quadratic function:
_______________________________________________________________________
🥇 This is the world’s first RSI indicator with: Linear Regression for Forecasting 🥇_______________________________________________________________________
_________________________________________________
🔮 Linear Regression: PineScript Technical Parameters 🔮
_________________________________________________
Forecast Types:
• Flat: Assumes prices will remain the same.
• Linreg: Makes a 'Linear Regression' forecast for n periods.
Technical Information:
ta.linreg (built-in function)
Linear regression curve. A line that best fits the specified prices over a user-defined time period. It is calculated using the least squares method. The result of this function is calculated using the formula: linreg = intercept + slope * (length - 1 - offset), where intercept and slope are the values calculated using the least squares method on the source series.
Syntax:
• Function: ta.linreg()
Parameters:
• source: Source price series.
• length: Number of bars (period).
• offset: Offset.
• return: Linear regression curve.
This function has been cleverly applied to the RSI, making it capable of projecting future values based on past statistical trends.
______________________________________________________
______________________________________________________
⯁ WHAT IS THE RSI❓
The Relative Strength Index (RSI) is a technical analysis indicator developed by J. Welles Wilder. It measures the magnitude of recent price movements to evaluate overbought or oversold conditions in a market. The RSI is an oscillator that ranges from 0 to 100 and is commonly used to identify potential reversal points, as well as the strength of a trend.
⯁ HOW TO USE THE RSI❓
The RSI is calculated based on average gains and losses over a specified period (usually 14 periods). It is plotted on a scale from 0 to 100 and includes three main zones:
• Overbought: When the RSI is above 70, indicating that the asset may be overbought.
• Oversold: When the RSI is below 30, indicating that the asset may be oversold.
• Neutral Zone: Between 30 and 70, where there is no clear signal of overbought or oversold conditions.
______________________________________________________
______________________________________________________
⯁ ENTRY CONDITIONS
The conditions below are fully flexible and allow for complete customization of the signal.
______________________________________________________
______________________________________________________
🔹 CONDITIONS TO BUY 📈
______________________________________________________
• Signal Validity: The signal will remain valid for X bars .
• Signal Sequence: Configurable as AND or OR .
📈 RSI Conditions:
🔹 RSI > Upper
🔹 RSI < Upper
🔹 RSI > Lower
🔹 RSI < Lower
🔹 RSI > Middle
🔹 RSI < Middle
🔹 RSI > MA
🔹 RSI < MA
📈 MA Conditions:
🔹 MA > Upper
🔹 MA < Upper
🔹 MA > Lower
🔹 MA < Lower
📈 Crossovers:
🔹 RSI (Crossover) Upper
🔹 RSI (Crossunder) Upper
🔹 RSI (Crossover) Lower
🔹 RSI (Crossunder) Lower
🔹 RSI (Crossover) Middle
🔹 RSI (Crossunder) Middle
🔹 RSI (Crossover) MA
🔹 RSI (Crossunder) MA
🔹 MA (Crossover) Upper
🔹 MA (Crossunder) Upper
🔹 MA (Crossover) Lower
🔹 MA (Crossunder) Lower
📈 RSI Divergences:
🔹 RSI Divergence Bull
🔹 RSI Divergence Bear
📈 RSI Forecast:
🔮 RSI (Crossover) MA Forecast
🔮 RSI (Crossunder) MA Forecast
______________________________________________________
______________________________________________________
🔸 CONDITIONS TO SELL 📉
______________________________________________________
• Signal Validity: The signal will remain valid for X bars .
• Signal Sequence: Configurable as AND or OR .
📉 RSI Conditions:
🔸 RSI > Upper
🔸 RSI < Upper
🔸 RSI > Lower
🔸 RSI < Lower
🔸 RSI > Middle
🔸 RSI < Middle
🔸 RSI > MA
🔸 RSI < MA
📉 MA Conditions:
🔸 MA > Upper
🔸 MA < Upper
🔸 MA > Lower
🔸 MA < Lower
📉 Crossovers:
🔸 RSI (Crossover) Upper
🔸 RSI (Crossunder) Upper
🔸 RSI (Crossover) Lower
🔸 RSI (Crossunder) Lower
🔸 RSI (Crossover) Middle
🔸 RSI (Crossunder) Middle
🔸 RSI (Crossover) MA
🔸 RSI (Crossunder) MA
🔸 MA (Crossover) Upper
🔸 MA (Crossunder) Upper
🔸 MA (Crossover) Lower
🔸 MA (Crossunder) Lower
📉 RSI Divergences:
🔸 RSI Divergence Bull
🔸 RSI Divergence Bear
📉 RSI Forecast:
🔮 RSI (Crossover) MA Forecast
🔮 RSI (Crossunder) MA Forecast
______________________________________________________
______________________________________________________
🤖 AUTOMATION 🤖
• You can automate the BUY and SELL signals of this indicator.
______________________________________________________
______________________________________________________
⯁ UNIQUE FEATURES
______________________________________________________
Linear Regression: (Forecast)
Signal Validity: The signal will remain valid for X bars
Signal Sequence: Configurable as AND/OR
Condition Table: BUY/SELL
Condition Labels: BUY/SELL
Plot Labels in the Graph Above: BUY/SELL
Automate and Monitor Signals/Alerts: BUY/SELL
Linear Regression (Forecast)
Signal Validity: The signal will remain valid for X bars
Signal Sequence: Configurable as AND/OR
Condition Table: BUY/SELL
Condition Labels: BUY/SELL
Plot Labels in the Graph Above: BUY/SELL
Automate and Monitor Signals/Alerts: BUY/SELL
______________________________________________________
📜 SCRIPT : RSI Forecast
🎴 Art by : @Titans_Invest & @DiFlip
👨💻 Dev by : @Titans_Invest & @DiFlip
🎑 Titans Invest — The Wizards Without Gloves 🧤
✨ Enjoy!
______________________________________________________
o Mission 🗺
• Inspire Traders to manifest Magic in the Market.
o Vision 𐓏
• To elevate collective Energy 𐓷𐓏

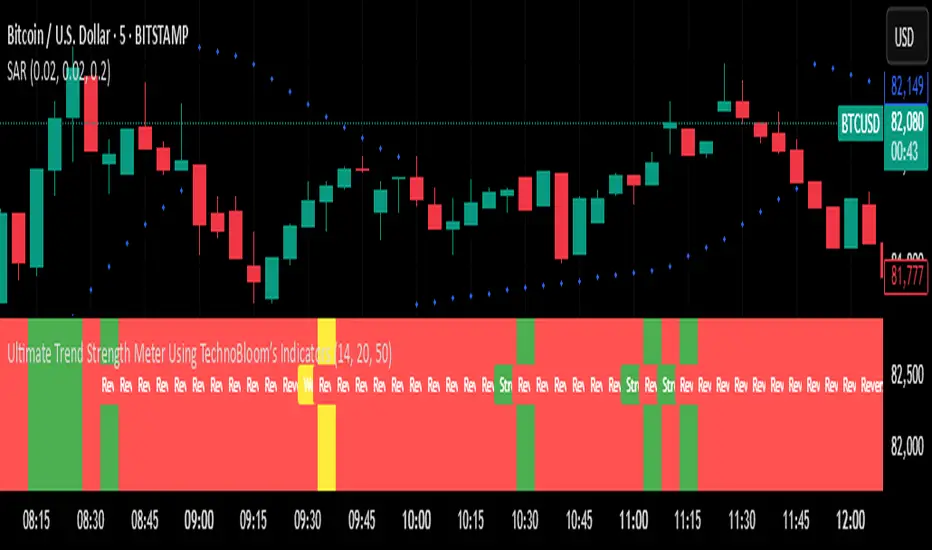
Ultimate Trend Strength Meter Using TechnoBloom’s IndicatorsOverview
The Ultimate Trend Strength Meter Using TechnoBloom’s Indicators is a powerful trend analysis tool developed using TechnoBloom’s proprietary indicators. This indicator helps traders assess trend strength, momentum, and potential reversals by combining three essential market factors:
• Market Participation Ratio (MPR) – Measures trader engagement and volume strength.
• Volume Weighted Moving Average (VWMO) – Confirms momentum and trend direction.
• Fibonacci-Based Support & Resistance – Identifies key reversal zones and breakout points.
⸻
Key Features:
✅ Color-Coded Trend Strength Meter:
• 🟢 Green – Strong Trend (High Confidence): High participation, strong momentum, and no major resistance.
• 🟡 Yellow – Weak Trend (Caution): Moderate participation, possible resistance ahead, and trend uncertainty.
• 🔴 Red – Reversal Risk / No Trend: Low market engagement, momentum uncertainty, and proximity to major Fibonacci levels.
✅ Eliminates False Signals & Weak Trends:
• Prevents choppy market entries by ensuring high-volume confirmation.
• Ideal for filtering fake breakouts and exhaustion phases.
✅ Works for All Trading Styles & Markets:
• Scalping (1m-5m), Day Trading (15m-1H), and Swing Trading (4H-Daily).
• Suitable for Forex, Stocks, Crypto, Indices, and Commodities (XAUUSD, US30, BTCUSD, etc.).
✅ Customizable for Any Strategy:
• Adjustable MPR thresholds, VWMO smoothing, and Fibonacci sensitivity.
• Built-in alerts notify traders when trend conditions change.
⸻
How to Use It:
1️⃣ Enter trades when the meter turns Green (Strong Trend) and aligns with your strategy.
2️⃣ Avoid or exit trades when it turns Red (Reversal Risk) to prevent unnecessary losses.
3️⃣ Use Yellow as a caution zone – wait for confirmation before making a move.
4️⃣ Combine with breakout strategies or support/resistance setups for high-probability entries.
⸻
About TechnoBlooms
TechnoBlooms is committed to developing high-precision trading indicators that enhance decision-making for traders across all markets. This tool is a result of our in-depth market research and algorithmic advancements to provide traders with an edge.
🚀 Upgrade your trading with the Ultimate Trend Strength Meter – Developed by TechnoBlooms! 🚀
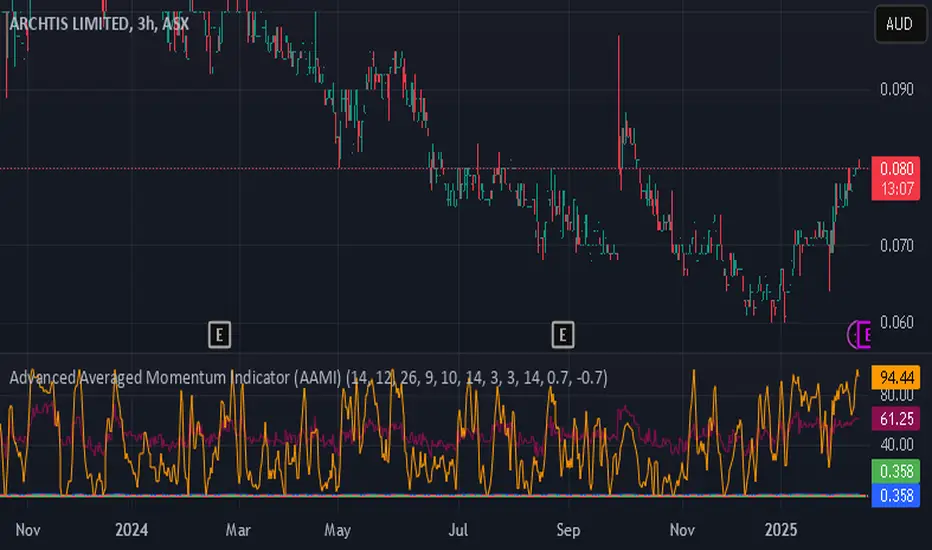
Advanced Averaged Momentum Indicator (AAMI)Key Features of AAMI:
Combination of Momentum Indicators: It averages normalized values from RSI, MACD histogram, raw Momentum, and Stochastic oscillator to give a comprehensive view of momentum.
Normalization: Each component is normalized to a scale from -1 to 1 to ensure they contribute equally to the AMI calculation.
Visual Cues: The indicator includes visual levels for neutral, overbought, and oversold conditions to aid in quick decision-making.
Alerts: Basic alert conditions are included for when AMI moves into overbought or oversold territory, which traders can customize further.
Customizable: All parameters can be adjusted within TradingView to tailor the indicator to different market conditions or trading strategies.
Smoothing: Included an SMA for AMI to reduce noise and give smoother signals.
Divergence Detection: Implemented a basic divergence detection mechanism to spot potential reversals.
Usage Tips:
Overbought/Oversold: When AMI goes above 0.7, it might suggest an overbought condition, potentially signaling a sell or take profit. Below -0.7 might indicate oversold conditions, suggesting a buy opportunity.
Divergence: Watch for divergences between the AMI and price action for signals of potential trend reversals.
Crossing Zero: The AMI crossing from negative to positive might be used as a buy signal, and vice versa for a sell signal.
This script provides a new way to view momentum by consolidating multiple traditional indicators into one, potentially offering clearer signals in complex market environments.
HTC peppermint_07 CCI w signal + s&r RSI
This CCI version enhances the traditional Commodity Channel Index (CCI) by integrating a dynamically calculated Relative Strength Index (RSI) that acts as support and resistance as shown in the screenshot, it can add as a confirmation to the divergence found in the CCI.
Key Features:
Enhanced CCI: The primary plot (black line but customizable) represents the standard CCI, providing insight into price momentum and potential overbought/oversold conditions.
Dynamic RSI Support/Resistance: The upper and lower bands (medium cyan line) are derived from a smoothed RSI, dynamically adjusting to the current market volatility. These bands serve as potential support and resistance levels for the CCI as additional confirmation for the divergence.
Overbought/Oversold Zones: The traditional overbought (+100) and oversold (-100) levels for CCI are marked with horizontal dotted lines.
Benefits:
Improved Entry/Exit Signals: Combining CCI with dynamic RSI support/resistance may offer more precise trading signals compared to using CCI alone.
Dynamic Adaptation: The RSI-based bands adapt to changing market conditions, potentially providing more relevant support and resistance levels.
Divergence Confirmation: dynamic s&r RSI adds confluence to potential trend reversals identified by the CCI.
Potential Usage:
Traders might use this indicator to:
Identify potential overbought/oversold conditions using the CCI and its relationship to the dynamic RSI bands.
Look for breakouts beyond the dynamic support/resistance levels as potential entry points.
Confirm potential trend reversals using RSI divergence (cyan and red label above divergence) signals.
Further Development Considerations:
Customizable Parameters: Allowing users to adjust the CCI length, RSI periods, and smoothing factors would enhance flexibility.
Alert Conditions: Adding alerts for breakouts, overbought/oversold conditions, and divergence signals would improve usability.
Backtesting: Thoroughly backtesting the indicator's performance across different assets and timeframes is essential before using it for live trading.
DISCLAIMER: !!
indicator is a custom technical analysis tool designed for educational and informational purposes only. It should not be construed as financial advice or a recommendation to buy or sell any security. Trading involves substantial risk of loss and may not be suitable for all investors.
Key Points to Consider:
No Guarantee of Profitability: The indicator's past performance is not indicative of future results. No trading strategy can guarantee profits or eliminate the risk of losses. You could lose some or all of your investment.
Use at Your Own Risk: Use of this indicator is solely at your own discretion and risk. You are responsible for your trading decisions. The developers and distributors of this indicator are not liable for any losses incurred as a result of using it.
Not Financial Advice: This indicator does not provide financial advice. Consult with a qualified financial advisor before making any investment decisions.
Backtesting Limitations: Backtested results, if presented, should be viewed with caution. Past performance may not reflect future results due to various factors, including changing market conditions and the limitations of backtesting methodologies.
Indicator Limitations: Technical indicators, including this one, are not perfect. They can generate false signals, and their effectiveness can vary depending on market conditions and the specific parameters used.
Parameter Optimization: Optimizing indicator parameters for past performance can lead to overfitting, which may not translate to future profitability.
No Warranty: The indicator is provided "as is" without any warranty of any kind, either express or implied, including but not limited to warranties of merchantability, fitness for a particular purpose, or non-infringement.
Changes and Updates: The developers may make changes or updates to the indicator without notice.
By using the "HTC peppermint_07 CCI w signal + s&r RSI" indicator, you acknowledge and agree to the terms of this disclaimer. If you do not agree with these terms, do not use the indicator.

Volume Spike IndicatorThe Volume Spike Indicator is designed to identify significant volume spikes in the market. This tool helps traders recognize unusual trading activity, which may indicate potential reversals, breakouts, or increased volatility. The indicator uses a simple moving average (SMA) of volume over a specified period and highlights bars where the current volume exceeds a multiple of this average.
Features:
Volume SMA Calculation:
The indicator calculates the SMA of volume over a customizable period (default: 20 bars).
Spike Multiplier:
A threshold multiplier (default: 4) determines what qualifies as a "spike."
Spikes occur when the current volume is greater than the SMA multiplied by this threshold.
Visual Alerts:
If a spike is detected, a red cross ( Cross ) and X-shape ( X-Cross ) are plotted above the corresponding bar for easy identification.
How to Use:
Spot High-Activity Areas:
Use this indicator to find points of unusually high trading activity, which can signify key levels or moments of interest in the market.
Adjust Settings for Sensitivity:
Length : Change the SMA period to match your trading timeframe.
Spike Multiplier : Lower values detect smaller spikes; higher values focus on extreme events.
Combine with Other Indicators:
This tool works best when combined with price action analysis, support/resistance levels, or trend indicators to confirm trading signals.
Customization Options:
Length: Number of bars for SMA calculation (default: 20).
Spike Multiplier: Threshold for defining volume spikes (default: 4).
This indicator is suitable for traders looking to enhance their analysis by identifying abnormal market activity.

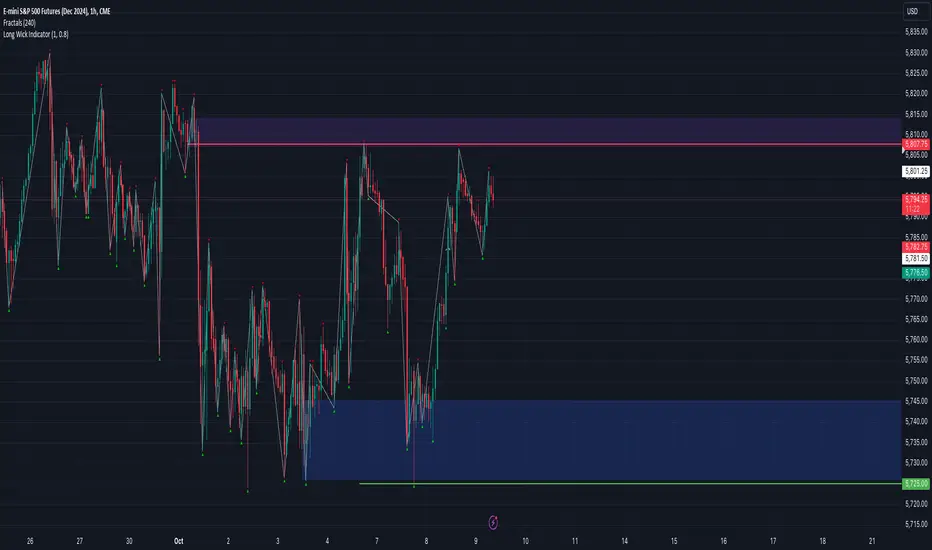
Long Wick Indicator
This indicator identifies and highlights candles with long wicks, which can be useful for various trading strategies.
Key Features:
1. Timeframe Limitation:
- Optional feature to limit the indicator to specific timeframes
- User can set a maximum timeframe (default: 5 minutes)
2. Customizable Wick-to-Body Ratio:
- User-defined minimum ratio for wick length to body length (default: 0.8)
3. Customizable Visual Indicators:
- Triangles appear above or below candles with long wicks (user can change triangles to another symbol)
- Yellow triangle pointing up: long bottom wick
- Yellow triangle pointing down: long top wick
Functionality:
- Calculates body size and wick sizes for each candle
- Compares wick sizes to body size using the user-defined ratio
- Plots indicators only if the current timeframe is within the specified limit (if enabled)
Usage:
Add this indicator to your TradingView chart to identify potential setups.
Customization:
Users can adjust the wick-to-body ratio and timeframe limitations in the indicator settings to suit their trading style and strategy.
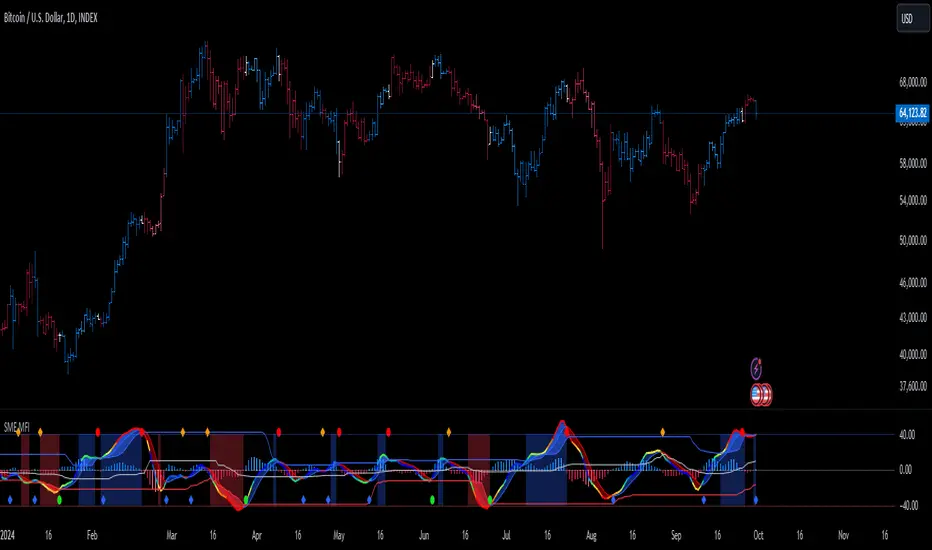
SMI Ergodic Indicator/Oscillator of Money Flow Index▮ Introduction
The Stochastic Momentum Index Ergodic (SMII) indicator is a technical analysis tool designed to predict trend reversals in the price of an asset.
It functions as a momentum oscillator, measuring the ratio of the smoothed price change to the smoothed absolute price change over a given number of previous periods.
The Ergodic SMI is based on the True Strength Index (TSI) and integrates a signal line, which is an exponential moving average (EMA) of the SMI indicator itself.
The Ergodic SMI oscillator provides a clearer picture of market trends than the traditional stochastic oscillator by incorporating the concept of 'ergodicity', which helps remove market noise.
On ther other hand, MFI (Money Flow Index) is a technical analysis indicator used to measure the inflow of money into an asset and thus help identify buying and selling pressure in a given financial instrument.
When these two indicators are combined, they can provide a more comprehensive view of price direction and market strength.
▮ Motivation: why another indicator?
By combining SMII with MFI, we can gain even more insights into the market.
One way to do this is to use the MFI as an input to the SMII, rather than just using price.
This means we are measuring momentum based on buying and selling pressure rather than just price.
Furthermore, there is the possibility of making several fine adjustments to both the calculation and visualization parameters that are not present in other indicators.
▮ What to look for
When using the SMII MFI indicator, there are a few things to look out for.
First, look at the SMII signal line.
When the line crosses above -40, it is considered a buy signal, while the crossing below +40 is considered a sell signal.
Also, pay attention to divergences between the SMII and the price.
If price is rising but the SMII is showing negative divergence, it could indicate that momentum is waning and a reversal could be in the offing.
Likewise, if price is falling but the SMII is showing positive divergence, this could indicate that momentum is building and a reversal could also be in the offing.
Divergences can be considered in both indicator and/or histogram.
Examples:
▮ Notes
The indicator presented here offers both the 'SMII' and the 'SMIO', that is, the 'Stochastic Momentum Index Ergodic Indicator' together with the 'Stochastic Momentum Index Ergodic Oscillator' (histogram), as per the documentation described in reference links.
So it is important to highlight the differences in relation to my other indicator, the 'Stochastic Momentum Index (SMI) of Money Flow Index (MFI)':
This last one is purely based on the SMI , which is implemented using SMA smoothing for the relative range and the high/low range.
Although they may seem the same in some situations, the calculation is actually different. The TSI tends to be more responsive at the expense of being noisier, while the SMI tends to be smoother. Which of these two indicators is best depends on the situation, the context, and the analyst's personal preference.
Please refer to reference links to more info.
▮ References
SMI documentation
SMII documentation
SMIO documentation
MFI documentation
RCYC Bullish Bearish Indicator
Summary: The RCYC Bullish Bearish Indicator is a custom trading tool designed to help traders identify potential bullish and bearish conditions in the market using a combination of KDJ and RSI indicators. This indicator uses color-coded candles to visually represent bullish and bearish signals, making it easy to identify trend changes on the chart. The script is particularly useful for traders who prefer visual signals and want to incorporate both trend momentum (KDJ) and relative strength (RSI) in their analysis.
Description:
The RCYC Bullish Bearish Indicator is a unique mashup of the KDJ and RSI indicators, optimized to provide a clear visual representation of market conditions through color-coded candles. This indicator not only identifies the potential trend shifts but also provides alerts for significant crossover points, enhancing a trader's ability to make informed decisions.
How It Works:
KDJ Calculation:
The KDJ is a variation of the Stochastic Oscillator that includes the %J line, which can go beyond the typical 0-100 range of %K and %D.
The KDJ component of this indicator calculates the highest high and lowest low over a specified period (KDJ Length), using these values to derive the %K line.
The %D line is a smoothed version of %K, and the %J line is derived from %K and %D using the formula: J = 3 * %K - 2 * %D.
This indicator focuses on the behavior of the %J line in relation to a mid-point level (50), identifying crossovers and crossunders that signal potential shifts in market sentiment.
RSI Calculation:
The Relative Strength Index (RSI) is a momentum oscillator that measures the speed and change of price movements. It is widely used to identify overbought or oversold conditions.
In this indicator, RSI values are adjusted and plotted to align visually with the KDJ values, providing a complementary momentum analysis.
Crossover Logic and Candle Coloring:
The indicator tracks two main events:
CrossOver50: When the %J line crosses above the 50 level, indicating potential bullish momentum.
CrossUnder50: When the %J line crosses below the 50 level, indicating potential bearish momentum.
Depending on the crossover events, the script changes the color of the candles on the chart:
Red candles on the initial crossover above 50, followed by dark blue candles to maintain bullish sentiment.
Yellow candles on the initial crossover below 50, followed by light blue candles to maintain bearish sentiment.
Alerts:
The indicator includes alert conditions for both bullish and bearish signals:
Red Candle Alert: Notifies the trader when the %J line crosses above 50.
Yellow Candle Alert: Notifies the trader when the %J line crosses below 50.
These alerts allow traders to react promptly to key market signals without continuously monitoring the chart.
Usage and Benefits:
This indicator is designed for traders looking to combine momentum and trend analysis into a single visual tool. It is particularly useful for those trading in trending markets or looking for entry/exit signals based on momentum shifts.
The color-coded candles provide an intuitive way to assess market conditions at a glance, reducing the complexity associated with analyzing multiple indicators separately.
By integrating both KDJ and RSI, the RCYC Bullish Bearish Indicator offers a balanced approach to trend detection and momentum confirmation, making it versatile for various trading styles, including scalping, swing trading, and position trading.
Originality and Usefulness:
While the indicator builds upon the familiar concepts of KDJ and RSI, it uniquely merges them into a cohesive visual tool with distinct crossover-based alerts and candle coloring.
This approach makes the indicator original, as it simplifies the interpretation of complex signals into straightforward visual cues, enhancing the decision-making process for traders who prefer chart-based analysis.

VPSA - Volume Price Spread AnalysisDear Analysts and Traders,
I am pleased to present the latest version of my indicator, based on the logic of analyzing spread and volume. In this version, the indicator examines spread and volume using min-max normalization. The statistical value is captured through Z-Score standardization, and I have added configurable alerts based on the normalized values of spread, volume, and the sigmas for these variables.
Theory and Evolution of the Indicator
The normalization function used in this program allows for the comparison of two values with different ranges on a single chart. The values that reach the highest within the examined range are assigned a value of one. As in previous versions, I have adopted a bar chart where the wider bar represents volume and the narrower bar represents spread. I believe that using normalization is the most intuitive approach, as the standardization in the earlier sVPSA version could cause confusion. This was due to smaller bars for higher actual values and negative bars, which required additional reliance on actual volume data and significant proficiency in using the indicator. These were limitations stemming from the computational aspect of these issues. As in the previously mentioned script, I also used Z-Score standardization here, which serves as a measure of deviation from the mean. This is visualized in the script as the color of the bars, which in the default configuration are as follows: below one sigma - blue; above one sigma up to two sigmas - green; above two sigmas up to three sigmas - red; and above three sigmas - fuchsia. Additionally, I applied an exponential moving average in this indicator to minimize the influence of older candles on the mean. The indicator has been enhanced with configurable alerts, allowing for substantial control over the conditions triggering them. The alerts enable the definition of normalized variable values and sigma values. Furthermore, the program allows for the definition of logical dependencies for these conditions.
Summary
The program I have developed is a synthesis of the most important and useful functions from the indicators I previously created. The indicator is a standalone and powerful tool that facilitates effective analysis of the spread-volume relationship, which is one of the fundamental methods of analysis according to the Wyckoff and VSA methodologies. The alerts introduced in this version provide extensive possibilities for controlling the dynamics of any market.
Should you encounter any errors or have suggestions regarding the indicator, please feel free to contact me.
I wish you successful analyses! All the best!
CatTheTrader

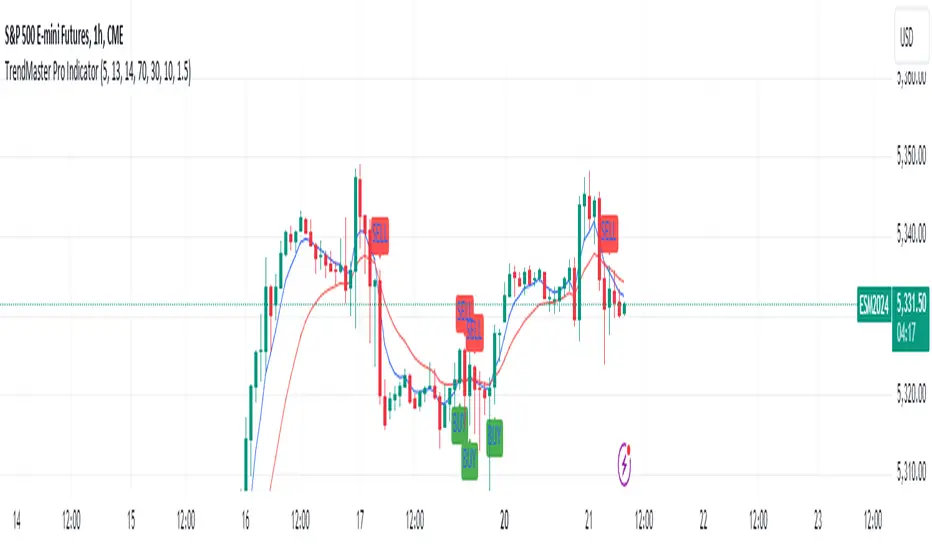
TrendMaster Pro IndicatorThe TrendMaster Pro Indicator is an advanced tool designed to assist traders in identifying potential buy and sell signals by leveraging a combination of exponential moving averages (EMAs), the relative strength index (RSI), and a custom volatility filter. This powerful indicator is suitable for traders of all levels and can be applied to various markets and timeframes, offering flexibility and reliability in trading decisions.
Key Features:
EMA Crossover Detection:
Utilizes a 5-period (short) and 13-period (long) EMA crossover to detect trend changes.
A bullish signal is generated when the 5 EMA crosses above the 13 EMA, indicating an upward trend.
A bearish signal is generated when the 5 EMA crosses below the 13 EMA, indicating a downward trend.
RSI Confirmation:
Incorporates a 14-period RSI to confirm the strength of detected trends.
A buy signal is validated when the RSI is above 50, indicating bullish momentum.
A sell signal is validated when the RSI is below 50, indicating bearish momentum.
Custom Volatility Filter:
Employs a volatility filter based on the standard deviation of closing prices over a specified period (default is 10 periods).
Ensures signals are only generated during periods of significant market movement, reducing noise and false signals.
The volatility threshold can be adjusted to suit different market conditions and trading styles.
How It Works:
EMA Crossover:
The TrendMaster Pro Indicator continuously monitors the crossover between the 5-period and 13-period EMAs.
A crossover event triggers the initial signal, suggesting a potential change in trend direction.
RSI Confirmation:
After an EMA crossover, the indicator checks the 14-period RSI value to confirm the trend's strength.
This confirmation step helps filter out weak or unreliable signals, ensuring only high-probability trades are considered.
Volatility Filter:
The indicator calculates the standard deviation of closing prices over the selected period to measure market volatility.
Signals are only generated if the volatility exceeds the user-defined threshold, ensuring that trades are made in active and dynamic market conditions.
How to Use:
Apply the Indicator:
Add the TrendMaster Pro Indicator to your trading chart via the TradingView platform.
Customize the EMA, RSI, and volatility settings according to your trading preferences and the specific market conditions.
Interpret Buy and Sell Signals:
Buy Signal: Look for a buy signal when the 5 EMA crosses above the 13 EMA, the RSI is above 50, and volatility exceeds the threshold. This combination indicates a strong bullish trend.
Sell Signal: Look for a sell signal when the 5 EMA crosses below the 13 EMA, the RSI is below 50, and volatility exceeds the threshold. This combination indicates a strong bearish trend.
Adjust Settings:
The default settings can be fine-tuned to match your trading strategy. Adjust the EMA lengths, RSI period, and volatility threshold to optimize the indicator for different assets and timeframes.
Unique Features:
Comprehensive Trend Detection: Combines multiple indicators (EMAs, RSI, volatility) to provide a holistic view of market trends.
Customizable: Easily adjustable settings allow traders to tailor the indicator to their specific needs and preferences.
Noise Reduction: The volatility filter ensures signals are generated only during significant market movements, improving signal accuracy and reliability.
Conclusion:
The TrendMaster Pro Indicator is a versatile and powerful tool that can enhance your trading strategy by providing clear and reliable buy and sell signals. Whether you are a day trader or a swing trader, this indicator can help you navigate the markets with confidence and precision. Add the TrendMaster Pro Indicator to your toolkit today and experience a new level of trading efficiency and effectiveness.
Ultimate Seasonality Indicator [SS]Hello everyone,
This is my seasonality indicator. I have been working on it for like 2 months, so hope you like it!
What it does?
The Ultimate Seasonality indicator is designed to provide you, the trader, an in-depth look at seasonality. The indicator gives you the ability to do the following functions:
View the most bearish and bullish months over a user defined amount of years back.
View the average daily change for each respective months over a user defined amount of years back.
See the most closely correlated month to the current month to give potential insights of likely trend.
Plot out areas of High and Low Seasonality.
Create a manual seasonal forecast model by selecting the desired month you would like to model the current month data after.
Have the indicator develop an autoregressive seasonal model based on seasonally lagged variables, using principles of machine learning.
I will go over these functions 1 by 1, its a whopper of an indicator so I will try to be as clear and concise as possible.
Viewing Bullish vs Bearish Months, Average Daily Change & Correlation to Current Month
The indicator will break down the average change, as well as the number of bullish and bearish days by month. See the image below as an example:
In the table to the right, you will see a breakdown of each month over the past 3 years.
In the first column, you will see the average daily change. A negative value, means it was a particularly bearish month, a positive value means it was a particularly bullish month.
The next column over shows the correlation to the current dataset. How this works is the indicator takes the size of the monthly data for each month, and compares it to the last X number of days up until the last trading day. It will then perform a correlation assessment to see how closely similar the past X number of trading days are to the various monthly data.
The last 2 columns break down the number of Bullish and Bearish days, so you can see how many red vs green candles happened in each respective month over your set timeframe. In the example above, it is over the pats 3 years.
Plot areas of High and Low Seasonality
In the chart above, you will see red and green highlighted zones.
Red represents areas of HIGH Seasonality .
Green represents areas of LOW Seasonality .
For this function, seasonality is measured by the autocorrelation function at various lags (12 lags). When there is an average autocorrelation of greater than 0.85 across all seasonal lags, it is considered likely the result of high seasonality/trend.
If the lag is less than or equal to 0.05, it is indicative of very low seasonality, as there is no predominate trend that can be found by the autocorrelation functions over the seasonally lagged variables.
Create Manual Seasonal Forecasts
If you find a month that has a particularly high correlation to the current month, you can have the indicator create a seasonal model from this month, and fit it onto the current dataset (past X days of trading).
If we look at the example below:
We can see that the most similar month to the current data is September. So, we can ask the indicator to create a seasonal forecast model from only September data and fit it to our current month. This is the result:
You will see, using September data, our most likely close price for this month is 450 and our model is y= 1.4305x + -171.67.
We can accept the 450 value but we can use the equation to model the data ourselves manually.
For example, say we have a target price on the month of 455 based on our own analysis. We can calculate the likely close price, should this target be reached, by substituting this target for x. So y = 1.4305x + -171.67 becomes
y = 1.4305(455) +- 171.67
y = 479.20
So the likely close price would be 479.20. No likely, and thus its not likely we are to see 455.
HOWEVER, in this current example, the model is far too statistically insignificant to be used. We can see the correlation is only 0.21 and the R squared is 0.04. Not a model you would want to use!
You want to see a correlation of at least 0.5 or higher and an R2 of 0.5 or higher.
We can improve the accuracy by reducing the number of years we look back. This is what happens when we reduce the lookback years to 1:
You can see reducing to 1 year gives December as the most similar month. However, our R2 value is still far too low to really rely on this data whole-heartedly. But it is a good reference point.
Automatic Autoregressive Model
So this is my first attempt at using some machine learning principles to guide statistical analysis.
In the main chart above, you will see the indicator making an autoregressive model of seasonally lagged variables. It does this in steps. The steps include:
1) Differencing the data over 12, seasonally lagged variables.
2) Determining stationarity using DF test.
3) Determining the highest, autocorrelated lags that fall within a significant stationary result.
4) Creating a quadratic model of the two identified lags that best represents a stationary model with a high autocorrelation.
What are seasonally lagged variables?
Seasonally lagged variables are variables that represent trading months. So a lag of 25 would be 1 month, 50, 2 months, 75, 3 months, etc.
When it displays this model, it will show us what the results of the t-statistic are for the DF test, whether the data is stationary, and the result of the autocorrelation assessment.
It will then display the model detail in the tip table, which includes the equation, the current lags being used, the R2 and the correlation value.
Concluding Remarks
That's the indicator in a nutshell!
Hope you like it!
One final thing, you MUST have your chart set to daily, otherwise you will get a runtime error. This can ONLY be used on the daily timeframe!
Feel free to leave your questions, comments and suggestions below.
Note:
My "ultimate" indicators are made to give the functionality of multiple indicators in one. If you like this one, you may like some of my others:
Ultimate P&L Indicator
Ultimate Customizable EMA/SMA
Thanks for checking out the indicator!
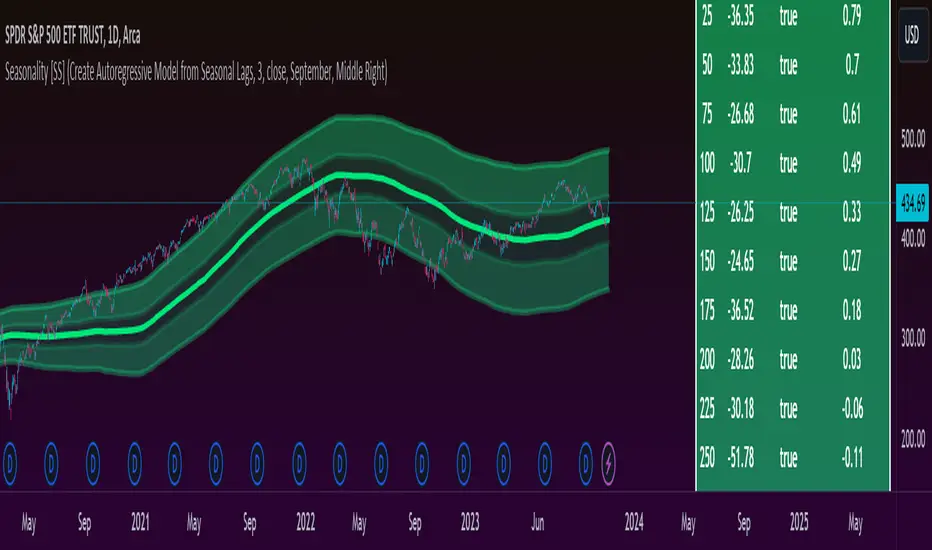
Leading Economic Indicator (LEI)The Leading Economic Indicator (LEI) is a groundbreaking technical indicator designed to serve as a comprehensive measure of the prevailing direction of economic trends in the United States. This unique index combines two key economic indicators: the Composite Leading Indicator (CLI) from the Organization for Economic Co-operation and Development (OECD) and the Purchasing Managers' Index (PMI) from the Institute for Supply Management (ISM).
The OECD Composite Leading Indicator (CLI) is a globally recognized indicator that assesses the future direction of economic trends by analyzing various leading economic factors. The ISM PMI, on the other hand, provides insights into the business activities of both the manufacturing and services sectors. LEI merges these critical indicators into a single, holistic indicator that empowers traders and investors to grasp the broader economic outlook and the performance of essential economic sectors simultaneously.
By taking into account the CLI and PMI, LEI offers a distinctive perspective, enabling a more accurate assessment of the potential direction of US financial markets.
Usage:
To utilize LEI effectively, it is recommended to apply it on a monthly timeframe (TF Monthly). This extended timeframe is particularly beneficial for investors with a medium to long-term horizon. By focusing on longer-term trends and market stability, LEI becomes an invaluable tool in your investment strategy.
One of the primary applications of LEI is to gauge the risk of market corrections in US financial markets, including the S&P 500, Nasdaq, and Dow Jones indices. Analysts often observe the crossing of the 5-period Simple Moving Average (SMA) with the 10-period SMA. When the 5-period SMA falls below the 10-period SMA, it serves as a potential warning signal for an impending market correction. This feature provides traders with an opportunity to exercise caution and make well-informed investment decisions.
LEI, with its unique blend of the OECD CLI and ISM PMI, provides a reliable tool for assessing the US economic climate, identifying trends, and making informed decisions in the financial markets. It stands as a reference indicator, capturing the essence of economic trends and providing valuable insights to traders and investors.
Sources:
- OECD Composite Leading Indicator (CLI): www.data.oecd.org
- Purchasing Managers' Index: ISM Report on Business (PMI) www.ismworld.org

Zaree - FX Index RSI IndicatorDescription:
The "Zaree - FX Index RSI Indicator" (FIRI) is a technical analysis tool designed to provide insights into the relative strength of two selected currency indices using the Relative Strength Index (RSI). It allows traders to compare the RSI values of a primary currency index and a secondary currency index, helping them identify potential overbought and oversold conditions in the currency market.
Details of the Indicator:
The indicator calculates the RSI for both the primary and secondary currency indices based on the user's selections.
Traders can choose from a variety of currency indices to use as the primary and secondary indices for comparison.
The indicator offers settings for customizing the calculation of the RSI, including selecting the type of moving average (SMA, EMA, WMA, SMMA) and adjusting the length of the RSI and moving average.
Upper and lower RSI bands are displayed on the chart to highlight potential overbought and oversold conditions.
The RSI values and their corresponding moving average values are plotted on the chart, allowing traders to visually analyze the relative strength of the indices.
How to Use the Indicator:
Select the primary and secondary currency indices you want to compare from the provided dropdown menus. These indices will serve as the basis for RSI calculation.
Choose the type of moving average (SMA, EMA, WMA, SMMA) to use for RSI calculation and set the desired length for the moving average.
Decide whether you want to visualize the RSI and moving average values for the primary and secondary indices on the chart.
Observe the RSI values and moving averages plotted on the chart. The indicator's upper and lower bands can help you identify potential overbought (above the upper band) and oversold (below the lower band) conditions.
Pay attention to the intersections between the RSI values and the moving average lines. These intersections can provide insights into potential trend changes or reversals in the currency market.
Example of Usage:
Let's say you're a swing trader focusing on currency pairs involving the US Dollar (USD) and Euro (EUR). You want to compare the relative strength of the USD Index (USDINX) and the EUR Index (EURINX) to identify potential trading opportunities. Here's how you can use the FIRI indicator:
Select "USDINX" as the primary index and "EURINX" as the secondary index.
Choose "SMA" as the moving average type and set the RSI length to 14.
Enable the visualization of RSI values for both the primary and secondary indices.
Observe the chart to identify instances where the RSI values of the indices cross above the upper band (potential overbought) or below the lower band (potential oversold).
Look for intersections between the RSI values and the moving average lines. A bullish signal may occur when the RSI crosses above the moving average, indicating potential upward momentum, while a bearish signal may occur when the RSI crosses below the moving average, indicating potential downward momentum.
Remember that the FIRI indicator is a tool to assist you in your analysis. It's important to consider other technical and fundamental factors before making trading decisions.
Feel free to adjust the settings of the indicator based on your trading preferences and strategy. Keep in mind that no indicator is foolproof, and it's recommended to use the FIRI indicator in conjunction with other analysis techniques for a comprehensive trading approach.

The Swinging Momentum IndicatorThe Swinging Momentum indicator is a custom trading indicator that looks at price momentum to identify potential buy and sell signals. It uses the rate of change in closing price over the last few bars to determine if momentum is increasing or decreasing. It also looks at the relationship of the close price to recent highs and lows, volume, and short term moving averages to confirm the strength of the momentum signal.
The indicator has two main components - identifying initial buy and sell signals, and then rating the strength of those signals. For buys, it looks for an increase in closing price momentum along with a close above recent highs and highest volume. For sells, it looks for a decrease in momentum and close below recent lows and highest volume. This identifies the initial signal without too many false signals.
It then looks at multiple factors to grade the strength of the signal, on a scale of 0 to 3. For buys it looks at how the close compares to the open, high and low of the last 4 bars, if the current low is above the recent low, and if there are more gaining days than losing days recently. For sells it looks at the close versus the open/high/low, if the current high is below the recent high, and if there are more losing than gaining days.
Each condition met adds 1 point to the strength rating. A rating above 2 is considered a strong momentum signal. This filters out weaker signals and reduces whipsaws.
The end result is plotted on the chart. Buy signals are triangles pointing up below the bars, sells are triangles pointing down above the bars. The colors help visualize the strength - strong signals are green for buys and red for sells, while weaker signals are yellow.
Trading with the Swinging Momentum indicator is straightforward. Strong buy signals identify upside momentum, so traders would look to enter long positions on a retest of the buy signal bar high. Strong sell signals identify downside momentum, so short positions can be entered on a retest of the bar low. Stops are placed beyond recent swing points in the opposite direction of the trade.
Since momentum can quickly change, risk management is key. Traders should look for other confirming indicators to strengthen the probability of a momentum trade working out. Good additional indicators to use with momentum include volume, trends, support/resistance and volatility measures.
The advantage of the Swinging Momentum indicator is that isolating the strongest momentum moves helps traders focus on higher probability trade setups. Monitoring both the initial signal and the strength rating gives an added level of confidence compared to standard momentum indicators. This custom indicator combines multiple momentum strategies into one, allowing traders to quickly identify and evaluate momentum opportunities on the chart.
Used appropriately with sound risk management, the Swinging Momentum indicator can be a valuable addition to a trading system. It visualizes both the direction and strength of momentum, key factors when trading trends and breakouts. While no indicator is perfect, understanding and utilizing momentum is a key concept for traders to master. This indicator provides a graphical representation to improve the way momentum is incorporated into trading decisions.

MarketSmith IndicatorThis script provides you with several indicators that will enable you to mimic MarketSmith charts, even with a free TradingView plan.
You can use this script with my ' EPS & Sales ' indicator.
MarketSmith-style bars
The script offers an original approach to managing candlesticks within the code, making them almost identical to those on MarketSmith.
For a perfect display, select ' Bars ' on your chart and set the opacity of your candles to 100% to display only the candles proposed by this indicator.
If you don't want them, you can simply disable them in the ' Style ' tab by unchecking 'MarketSmith Bars' and 'Chars'.
These candles are designed to be used with a fix chart. (No beautiful result with zooming in or out.)
Normally, the display will still be correct by right-clicking, and ' Reset Chart '.
Simple customizable moving averages
With automatic distinction of the weekly time unit. You can choose to display them or not, select the calculation method and modify their length via the panel.
The RS Rating indicator
I've integrated the RS Rating indicator into this script, as the RS Rating is a fundamental component of this layout.
High and valley points
These points are used by MarketSmith to detect bases, patterns, cup & handle.
Designed for US Market only you won't be able to screen correctly the India market for example.
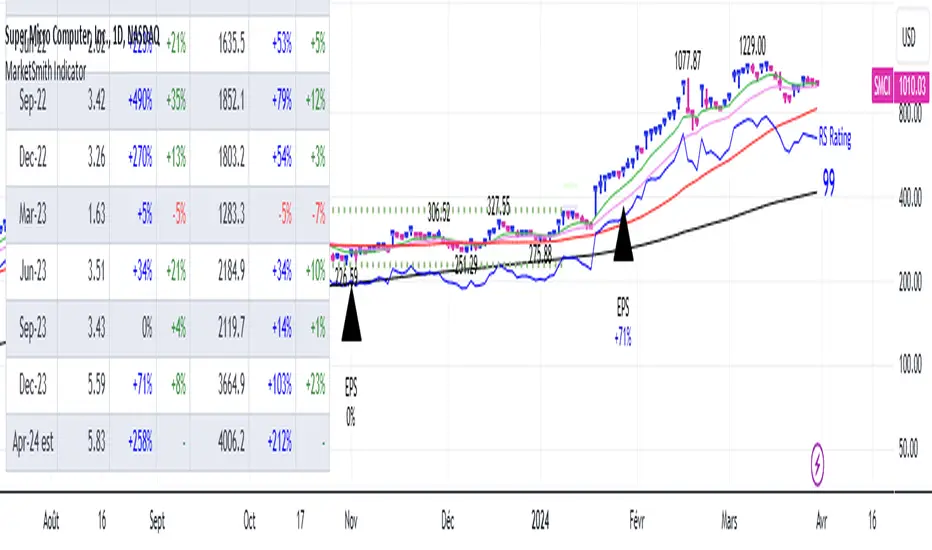
Multi-Band Breakout IndicatorThe Multi-Band Breakout Indicator was created to help identify potential breakout opportunities in the market. It combines multiple bands (ATR-Based and Donchian) and moving averages to provide valuable insights into the underlying trend and potential breakouts. By understanding the calculations, interpretation, parameter adjustments, potential applications, and limitations of the indicator, traders can effectively incorporate it into their trading strategy.
Calculation:
The indicator utilizes several calculations to plot the bands and moving averages. The length parameter determines the period used for the Average True Range (ATR), which measures volatility. A higher length captures a longer-term view of price movement, while a lower length focuses on shorter-term volatility. The multiplier parameter adjusts the distance of the upper and lower bands from the ATR. A higher multiplier expands the bands, accommodating greater price volatility, while a lower multiplier tightens the bands, reflecting lower volatility. The MA Length parameter determines the period for the moving averages used to calculate the trend and trend moving average. A higher MA Length creates a smoother trend line, filtering out shorter-term fluctuations, while a lower MA Length provides a more sensitive trend line.
The Donchian calculations in the Multi-Band Breakout Indicator play a significant role in identifying potential breakout opportunities and providing additional confirmation for trading signals. In this indicator, the Donchian calculations are applied to the trend line, which represents the average of the upper and lower bands. To calculate the Donchian levels, the indicator uses the Donchian Length parameter, which determines the period over which the highest high and lowest low are calculated. A longer Donchian Length captures a broader price range, while a shorter length focuses on more recent price action. By incorporating the Donchian calculations into the Multi-Band Breakout Indicator, traders gain an additional layer of confirmation for breakout signals.
Interpretation:
The Multi-Band Breakout Indicator offers valuable interpretation for traders. The upper and lower bands represent dynamic levels of resistance and support, respectively. These bands reflect the potential price range within which the asset is expected to trade. The trend line is the average of these bands and provides a central reference point for the overall trend. When the price moves above the upper band, it suggests a potential overbought condition and a higher probability of a pullback. Conversely, when the price falls below the lower band, it indicates a potential oversold condition and an increased likelihood of a bounce. The trend moving average further smooths the trend line, making it easier to identify the prevailing direction.
The crossover of the trend line (representing the average of the upper and lower bands) and the trend moving average holds a significant benefit for traders. This crossover serves as a powerful signal for potential trend changes and breakout opportunities in the market. When the trend line crosses above the trend moving average, it suggests a shift in momentum towards the upside, indicating a potential bullish trend. This provides traders with an early indication of a possible upward movement in prices. Conversely, when the trend line crosses below the trend moving average, it indicates a shift in momentum towards the downside, signaling a potential bearish trend. This crossover acts as an early warning for potential downward price movement. By identifying these crossovers, traders can capture the initial stages of a new trend, enabling them to enter trades at favorable entry points and potentially maximize their profit potential.
Breakout Signals:
For bullish breakouts, the indicator looks for a bullish crossover between the trend line and the trend moving average. This crossover suggests a shift in momentum towards the upside. Additionally, it checks if the current price has broken above the upper band and the previous Donchian high. This confirms that the price is surpassing a previous resistance level, indicating further upward movement.
For bearish breakouts, the indicator looks for a bearish crossunder between the trend line and the trend moving average. This crossunder indicates a shift in momentum towards the downside. It also checks if the current price has broken below the lower band and the previous Donchian low. This confirms that the price is breaking through a previous support level, signaling potential downward movement.
When a bullish or bearish breakout is detected, it suggests a potential trading opportunity. Traders may consider initiating positions in the direction of the breakout, anticipating further price movement in that direction. However, it's important to remember that breakouts alone do not guarantee a successful trade. Other factors, such as market conditions, volume, and confirmation from additional indicators, should be taken into account. Risk management techniques should also be implemented to manage potential losses.
Coloration:
The coloration in the Multi-Band Breakout Indicator is used to visually represent different aspects of the indicator and provide valuable insights to traders. Let's break down the coloration components:
-- Trend/Basis Color : The tColor variable determines the color of the bars based on the relationship between the trend line (trend) and the closing price (close), as well as the relationship between the trend line and the trend moving average (trendMA). If the trend line is above the closing price and the trend moving average is also above the closing price, the bars are colored fuchsia, indicating a potential bullish trend. If the trend line is below the closing price and the trend moving average is also below the closing price, the bars are colored lime, indicating a potential bearish trend. If neither of these conditions is met, the bars are colored yellow, representing a neutral or indecisive market condition.
-- Moving Average Color : The maColor variable determines the color of the filled area between the trend line and the trend moving average. If the trend line is above the trend moving average, the area is filled with a lime color with 70% opacity, indicating a potential bullish trend. Conversely, if the trend line is below the trend moving average, the area is filled with a fuchsia color with 70% opacity, indicating a potential bearish trend. This coloration helps traders visually identify the relationship between the trend line and the trend moving average.
-- highColor and lowColor : The highColor and lowColor variables determine the colors of the high Donchian band (hhigh) and the low Donchian band (llow), respectively. These bands represent dynamic levels of resistance and support. If the highest point in the previous Donchian period (hhigh) is above the upper band, the highColor is set to olive with 90% opacity, indicating a potential resistance level. On the other hand, if the lowest point in the previous Donchian period (llow) is below the lower band, the lowColor is set to red with 90% opacity, suggesting a potential support level. These colorations help traders quickly identify important price levels and assess their significance in relation to the bands.
By incorporating coloration, the Multi-Band Breakout Indicator provides visual cues to traders, making it easier to interpret the relationships between various components and assisting in identifying potential trend changes and breakout opportunities. Traders can use these color cues to quickly assess the prevailing market conditions and make informed trading decisions.
Adjusting Parameters:
The Multi-Band Breakout Indicator offers flexibility through parameter adjustments. Traders can customize the indicator based on their preferences and trading style. The length parameter controls the sensitivity to price changes, with higher values capturing longer-term trends, while lower values focus on shorter-term price movements. By adjusting the parameters, such as the ATR length, multiplier, Donchian length, and MA length, traders can customize the indicator to suit different timeframes and trading strategies. For shorter timeframes, smaller values for these parameters may be more suitable, while longer timeframes may require larger values.
Potential Applications:
The Multi-Band Breakout Indicator can be applied in various trading strategies. It helps identify potential breakout opportunities, allowing traders to enter trades in the direction of the breakout. Traders can use the indicator to initiate trades when the price moves above the upper band or below the lower band, confirming a potential breakout and providing a signal to enter a trade. Additionally, the indicator can be combined with other technical analysis tools, such as support and resistance levels, candlestick patterns, or trend indicators, to increase the probability of successful trades. By incorporating the Multi-Band Breakout Indicator into their trading approach, traders can gain a better understanding of market trends and capture potential profit opportunities.
Limitations:
While the Multi-Band Breakout Indicator is a useful tool, it has some limitations that traders should consider. The indicator performs best in trending markets where price movements are relatively strong and sustained. During ranging or choppy market conditions, the indicator may generate false signals, leading to potential losses. It is crucial to use the indicator in conjunction with other analysis techniques and risk management strategies to enhance its effectiveness. Additionally, traders should consider external factors such as market news, economic events, and overall market sentiment when interpreting the signals generated by the indicator.
By combining multiple bands and moving averages, this indicator offers valuable insights into the underlying trend and helps traders make informed trading decisions. With customization options and careful interpretation, this indicator can be a valuable addition to any trader's toolkit, assisting in identifying potential breakouts, capturing profitable trades, and enhancing overall trading performance.
