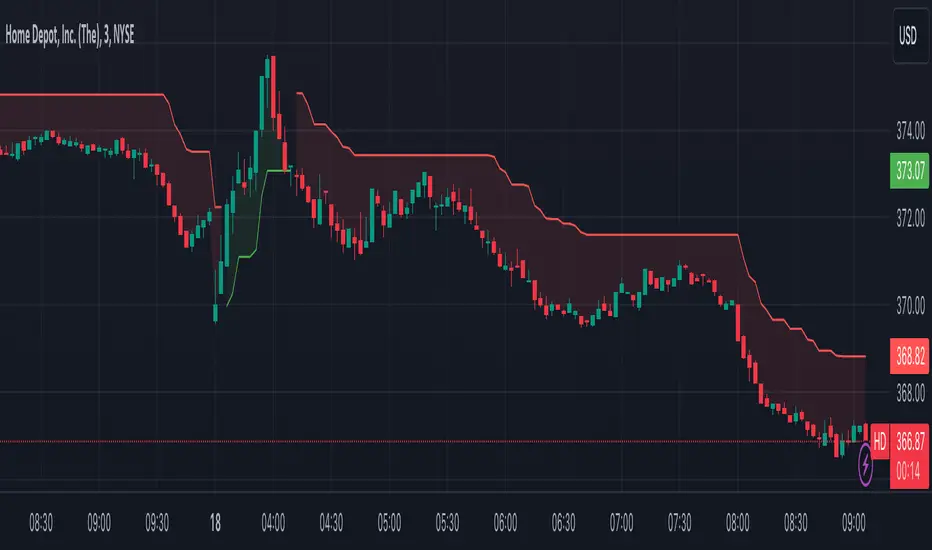
No Lag SupertrendNo Lag Supertrend indicator improves upon the original supertrend by incorporating calculation methods that enhance responsiveness and accuracy. Traditional supertrend indicators often suffer from lag, which can delay signals and affect trading decisions. No Lag Supertrend addresses this issue through the use of KAMA (Kaufman’s Adaptive Moving Average) and Hull ATR (Average True Range) calculations.
Goals of No Lag Supertrend:
- Lag reduction: one of the main issues with traditional supertrend indicators is their lag, which can result in delayed entry and exit signals. By integrating KAMA and Hull ATR, the no lag supertrend minimizes this delay, providing more timely signals.
- Market Noise Filtering: The combined use of KAMA and Hull ATR effectively filters out market noise, ensuring that signals are based on significant price movements rather than minor fluctuations.
- Consistency Across Different Market Conditions: The adaptive nature of KAMA and the smooth responsiveness of Hull ATR ensure that the No Lag Supertrend performs consistently across various market conditions, from trending to volatile markets.
Credits: This code is based on the TradingView supertrend but improved the ATR calculations.
Cerca negli script per "kama"
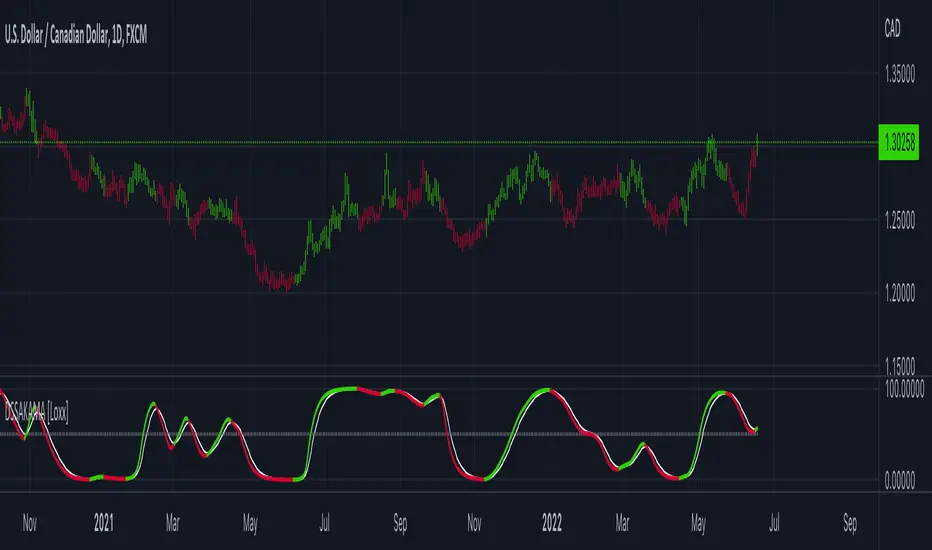
DSS of Advanced Kaufman AMA [Loxx]DSS of Advanced Kaufman AMA is a double smoothed stochastic oscillator using a Kaufman adaptive moving average with the option of using the Jurik Fractal Dimension Adaptive calculation. This helps smooth the stochastic oscillator thereby making it easier to identify reversals and trends.
What is the double smoothed stochastic?
The Double Smoothed Stochastic indicator was created by William Blau. It applies Exponential Moving Averages (EMAs) of two different periods to a standard Stochastic %K. The components that construct the Stochastic Oscillator are first smoothed with the two EMAs. Then, the smoothed components are plugged into the standard Stochastic formula to calculate the indicator.
What is KAMA?
Developed by Perry Kaufman, Kaufman's Adaptive Moving Average (KAMA) is a moving average designed to account for market noise or volatility . KAMA will closely follow prices when the price swings are relatively small and the noise is low. KAMA will adjust when the price swings widen and follow prices from a greater distance. This trend-following indicator can be used to identify the overall trend, time turning points and filter price movements.
What is the efficiency ratio?
In statistical terms, the Efficiency Ratio tells us the fractal efficiency of price changes. ER fluctuates between 1 and 0, but these extremes are the exception, not the norm. ER would be 1 if prices moved up 10 consecutive periods or down 10 consecutive periods. ER would be zero if price is unchanged over the 10 periods.
What is Jurik Fractal Dimension?
There is a weak and a strong way to measure the random quality of a time series.
The weak way is to use the random walk index ( RWI ). You can download it from the Omega web site. It makes the assumption that the market is moving randomly with an average distance D per move and proposes an amount the market should have changed over N bars of time. If the market has traveled less, then the action is considered random, otherwise it's considered trending.
The problem with this method is that taking the average distance is valid for a Normal (Gaussian) distribution of price activity. However, price action is rarely Normal, with large price jumps occuring much more frequently than a Normal distribution would expect. Consequently, big jumps throw the RWI way off, producing invalid results.
The strong way is to not make any assumption regarding the distribution of price changes and, instead, measure the fractal dimension of the time series. Fractal Dimension requires a lot of data to be accurate. If you are trading 30 minute bars, use a multi-chart where this indicator is running on 5 minute bars and you are trading on 30 minute bars.
Included
-Toggle bar colors on/offf
Multi-Timeframe Dual KAMA + Bands [DW]This study is an experimental variation of Bollinger Bands using the Kaufman Adaptive Moving Average (KAMA) as the baseline.
Includes an additional trailing KAMA series for a supplementary view of average price activity.

STD-Filtered, Adaptive Exponential Hull Moving Average [Loxx]STD-Filtered, Adaptive Exponential Hull Moving Average is a Kaufman Efficiency Ratio Adaptive Hull Moving Average that uses EMA instead of WMA for its computation. I've also added standard deviation stepping to further smooth the signal. Using EMA instead of WMA turns the Hull into what's called the AEHMA. You can read more about the EHMA here: eceweb1.rutgers.edu
What is the traditional Hull Moving Average?
The Hull Moving Average (HMA) attempts to minimize the lag of a traditional moving average while retaining the smoothness of the moving average line. Developed by Alan Hull in 2005, this indicator makes use of weighted moving averages to prioritize more recent values and greatly reduce lag. The resulting average is more responsive and well-suited for identifying entry points.
What is Kaufman's Efficiency Ratio?
The Efficiency Ratio (ER) was first presented by Perry Kaufman in his 1995 book ‘Smarter Trading‘. It is calculated by dividing the price change over a period by the absolute sum of the price movements that occurred to achieve that change. The resulting ratio ranges between 0 and 1 with higher values representing a more efficient or trending market.
The value of the ER ranges between 0 and 1. It has the value of 1 when prices move in the same direction for the full time over which the indicator is calculated, e.g. n bars period. It has a value of 0 when prices are unchanged over the n periods. When prices move in wide swings within the interval, the sum of the denominator becomes very large compared to the numerator and ER approaches zero.
Some uses for ER:
A qualifier for a trend following trade; a trend is considered “persistent” only when RE is above a certain value, e.g. 0.3 or 0.4 .
A filter to screen out choppy stocks/markets, where breakouts are frequently “fakeouts”.
In an adaptive trading system, helping to determine whether to apply a trend following algorithm or a mean reversion algorithm.
It is used in the calculation of Kaufman’s Adaptive Moving Average (KAMA).
How to calculate the Hull Adaptive Moving Average (HAMA)
Find Signal to Noise ratio (SNR)
Normalize SNR from 0 to 1
Calculate adaptive alphas
Apply EMAs
Included
Bar coloring
Signals
Alerts
Loxx's Expanded Source Types
[Sextan] KAMA BacktestLevel: 1
NOTE: This is ONLY an EXAMPLE on HOW-TO produce a customized "{Sextan} PINEv4 Sextans Backtest Framework" with intput signal source as my "{blackcat} L2 Perry Kaufman Adaptive MA (KAMA)" quickly and drawing on main chart. You can backtest many of my indicators in minutes now!
Of course,you can define your own indicator in the highlighted area in compliance with the uniform format, which guarantee when you use "Indicator on Indicator" function, it would not produce any error.
Background
Backtesting of technical indicators and strategies is the most common way to understand a quantitative strategy. However, the complicated configuration and adaptation work of backtesting many quantitative tools makes many traders who do not understand the code daunted. Moreover, although I have written a lot of strategies, I am still not very satisfied with the backtest configuration and writing efficiency. Therefore, I have been thinking about how to build a backtesting framework that can quickly and easily evaluate the backtesting performance of any indicator with a "long/short entry" indicator, that is, a "simple backtesting tool for dummies". The performance requirements should be stable, and the operation should be simple and convenient. It is best to "copy", "paste", and "a few mouse clicks" to complete the quick backtest and evaluation of a new indicator.
Luckily, I recently realized that TradingView provides an "Indicator on Indicator" feature, which is the perfect foundation for doing "hot swap" backtesting. My basic idea is to use a two-layer design. The first layer is the technical indicator signal source that needs to be embedded, which is only used to provide buy and sell signals of custom strategies; the second layer is the trading system, which is used to receive the output signals of the first layer, and filter the signals according to the agreed specifications. , Take Profit, Stop Loss, draw buy and sell signals and cost lines, define and send custom buy and sell alert messages to mobile phones, social software or trading interfaces. In general, this two-layer design is a flexible combination of "death and alive", which can meet the needs of most traders to quickly evaluate the performance of a certain technical indicator. The first layer here is flexible. Users can insert their own strategy codes according to my template, and they can draw buy and sell signals and output them to the second layer. The second layer is fixed, and the overall framework is solidified to ensure the stability and unity of the trading system. It is convenient to compare different or similar strategies under the same conditions. Finally, all trading signals are drawn on the chart, and the output strategy returns. test report.
The main function:
The first layer: "{Sextan} Your Indicator Source", the script provides a template for personalized strategy input, and the signal and definition interfaces ensure full compatibility with the second layer. Backtesting is performed stably in the backtesting framework of the layer. The first layer of this script is also relatively simple: enter your script in the highlighted custom script area, and after ensuring the final buy and sell signals long = bool condition, short = bool condition, the design of the first layer is considered complete. Input it into the PINE script editor of TradingView, save it and add it to the chart, you can see the pulse sequence in yellow (buy) and purple (sell) on the sub-picture, corresponding to the main picture, you can subjectively judge that the quality of the trading point of the strategy is good Bad.
The second layer: "{Sextan} PINEv4 Sextans Backtest Framework". This script is the standardized trading system strategy execution and alarm, used to generate the final report of the strategy backtest and some key indicators that I have customized that I find useful, such as: winning rate , Odds, Winning Surface, Kelly Ratio, Take Profit and Stop Loss Thresholds, Trading Frequency, etc. are evaluated according to the Kelly formula. To use the second layer, first load it into the TrainingView chart, no markers will appear on the chart, since you have not specified any strategy source signals, click on the gear-shaped setting next to the "{Sextan} PINEv4 Sextans BTFW" header button, you can open the backtest settings, the first item is to select your custom strategy source. Because we have added the strategy source to the chart in the previous step, you can easily find an option "{Sextan} Your Indicator Source: Signal" at the bottom of the list, this is the strategy source input we need, select and confirm , you can see various markers on the main graph, and quickly generate a backtesting profit graph and a list of backtesting reports. You can generate files and download the backtesting reports locally. You can also click the gear on the backtest chart interface to customize some conditions of the backtest, including: initial capital amount, currency type, percentage of each order placed, amount of pyramid additions, commission fees, slippage, etc. configuration. Note: The configuration in the interface dialog overrides the same configuration implemented by the code in the backtest script.
How to output charts:
The first layer: "{Sextan} Your Indicator Source", the output of this script is the pulse value of yellow and purple, yellow +1 means buy, purple -1 means sell.
The second layer: PINEv4 Sextans Backtest Framework". The output of this script is a bit complicated. After all, it is the entire trading system with a lot of information:
1. Blue and red arrows. The blue upward arrow indicates long position, the red downward arrow indicates short position, and the horizontal bar at the end of the purple arrow indicates take profit or stop loss exit.
2. Red and green lines. This is the holding cost line of the strategy, green represents the cost of holding a long position, and red represents the cost of holding a short position. The cost line is a continuous solid line and the price action is relatively close.
3. Green and yellow long take profit and stop loss area and green and yellow long take profit and stop loss fork. Once a long position is held, there is a conditional order for take profit and stop loss. The green horizontal line is the long take profit ratio line, and the yellow is the long stop loss ratio line; the green cross indicates the long take profit price, and the yellow cross indicates the long position. Stop loss price. It's worth noting that the prongs and wires don't necessarily go together. Because of the optimization of the algorithm, for a strong market, the take profit will occur after breaking the take profit line, and the profit will not be taken until the price falls.
4. The purple and red short take profit and stop loss area and the purple red short stop loss fork. Once a short position is held, there will be a take profit and stop loss conditional order, the red is the short take profit ratio line, and the purple is the short stop loss ratio line; the red cross indicates the short take profit price, and the purple cross indicates the short stop loss price.
5. In addition to the above signs, there are also text and numbers indicating the profit and loss values of long and short positions. "L" means long; "S" means short; "XL" means close long; "XS" means close short.
TradingView Strategy Tester Panel:
The overview graph is an intuitive graph that plots the blue (gain) and red (loss) curves of all backtest periods together, and notes: the absolute value and percentage of net profit, the number of all closed positions, the winning percentage, the profit factor, The maximum trading loss, the absolute value and ratio of the average trading profit and loss, and the average number of K-lines held in all trades.
Another is the performance summary. This is to display all long and short statistical indicators of backtesting in the form of a list, such as: net profit, gross profit, Sharpe ratio, maximum position, commission, times of profit and loss, etc.
Finally, the transaction list is a table indexed by the transaction serial number, showing the signal direction, date and time, price, profit and loss, accumulated profit and loss, maximum transaction profit, transaction loss and other values.
Remarks
Finally, I will explain that this is just the beginning of this model. I will continue to optimize the trading system of the second layer. Various optimization feedback and suggestions are welcome. For valuable feedback, I am willing to provide some L4/L5 technical indicators as rewards for free subscription rights.

MA+MA+ is a multi time frame moving average indicator with more than a dozen different moving averages (like KAMA, VAMA, JMA, HMA and much more).
More moving averages will be added on every update, hence Follow me to get notified.
MA+ Supports automatic (AUTO in settings) time frame multiplier. For example, if you set 'Auto Resolution Multiplier' to 6, and your base chart is 5 minutes, the moving averages will plot at 5 * 6 = 30 minutes.
You can still use 'User Defined' to use your own time frame without using the multiplier.
Use higher time frame than the base chart time frame to avoid repainting.
Default multiplier for higher time frame is 2.
Supports Signals 1 (rising MA) or -1 (falling MA) to attach to another indicator.
Bars are not colored by default.
Just for this great community, You can request in the comments other moving averages that do not exists in MA+.

Tobacco ChannelThese bands use KAMA for the basis, build Keltner Channels that you might expect high probability reversals to occur from.
I named it Tobacco Channel because I found its idea in Cuban's Reversion Bands — Indicator by cubantobacco.

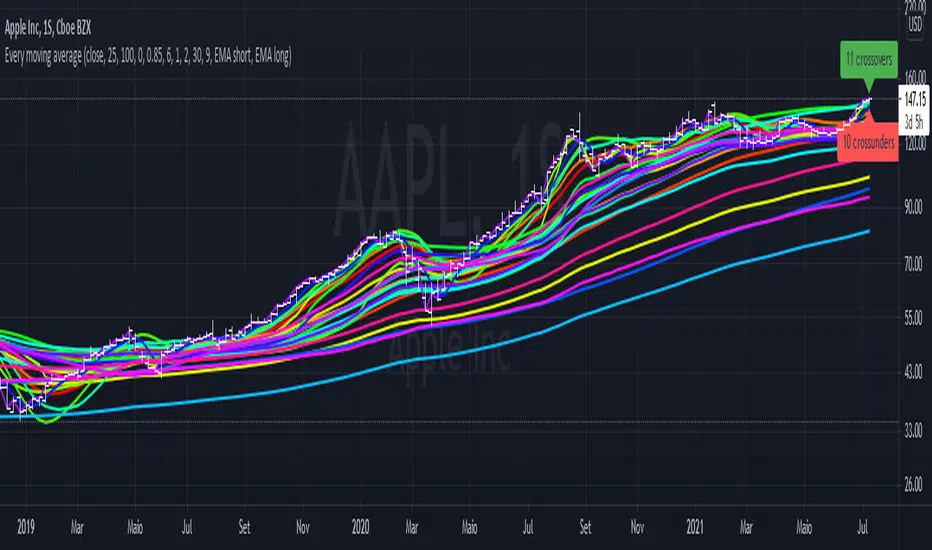
Every single moving average (ALMA, EMA, HMA, KAMA, RMA, SMA...)So you may be looking at the graph and thinking "this is a mess", and I agree.
The purpose of this script is to plot in the same graph every single type of moving average that I could think of, so you can find the ones that are better for your timeframe and for your asset. Once you add it, disable those types that doesn't seem to serve your purpose, until you can select one you like.
The average types are: ALMA, EMA, HMA, KAMA, RMA, SMA, SWMA, VIDYA, VWAP, VWMA, and WMA. Each one is ploted two times (except SWMA and VWAP), one with a short period, and another with a long, both of which you can configure.
Moving Average Compendium===========
Moving Average Compendium (16 MA Types)
===========
A selection of the most popular, widely used, interesting and most powerful Moving Averages we can think of. We've compiled 16 MA's into this script, and allowed full access to the source code so you can use what you need, as you need it.
-----------
From very simple moving averages using built-in functions, all the way through to Fractal Adaptive Averages, we've tried to cover as much as we can think of! BUT, if you would like to make a suggestion or recommendation to be added to this compendium of MA's please let us know! Together we can get a complete list of many dozens of types of Moving Average.
Full List (so far)
---
SMA - Simple Moving Average
EMA - Exponential Moving Average
WMA - Weighted Moving Average
VWMA - Volume Weighted Moving Average
DEMA - Double Exponential Moving Average
TEMA - Triple Exponential Moving Average
SMMA - Smoothed Moving Average
HMA - Hull Moving Average
ZLEMA - Zero-Lag Exponential Moving Average
KAMA - Kaufman Adaptive Moving Average
JMA - Jurik Moving Average
SWMA - Sine-Weighted Moving Average
TriMA - Triangular Moving Average
MedMA - Moving Median Average
GeoMA - Geometric Mean Moving Average
FRAMA - Fractal Adaptive Moving Average
Line color changes from green (upward) to red (downward) - some of the MA types will "linger" without moving up or down and when they are in this state they should appear gray in color.
Thanks to all involved -
Good Luck and Happy Trading!

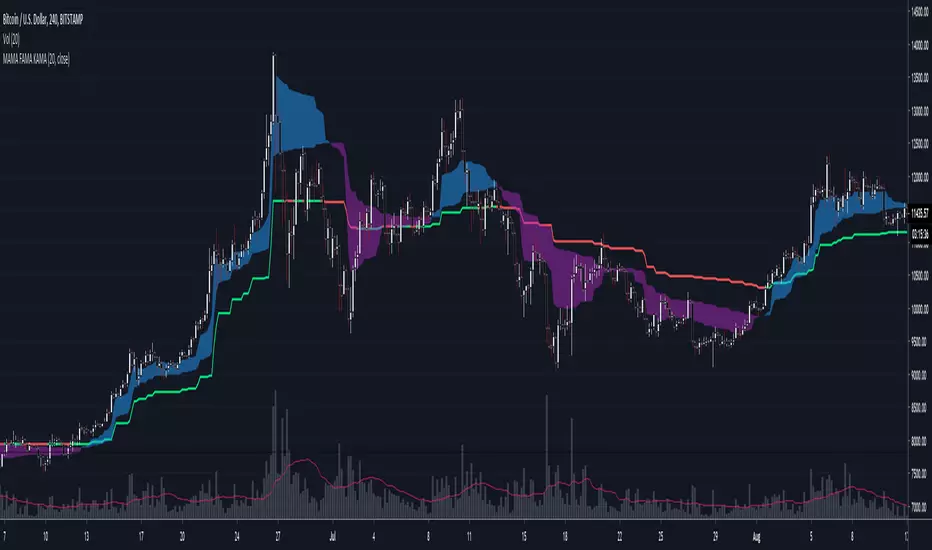
MAMA FAMA KAMA.. chameleon 🎵
Uses Kaufmann's Efficiency Ratio to generate adaptive inputs for Ehler's MAMA/FAMA. Alphas from the Hilbert transform are then used in place for the KAMA calculation.
Original MAMA/FAMA by everget : link
--------------------------------------
If you find it useful please consider a tip/donation :
BTC - 3BMEXEDyWJ58eXUEALYPadbn1wwWKmf6sA
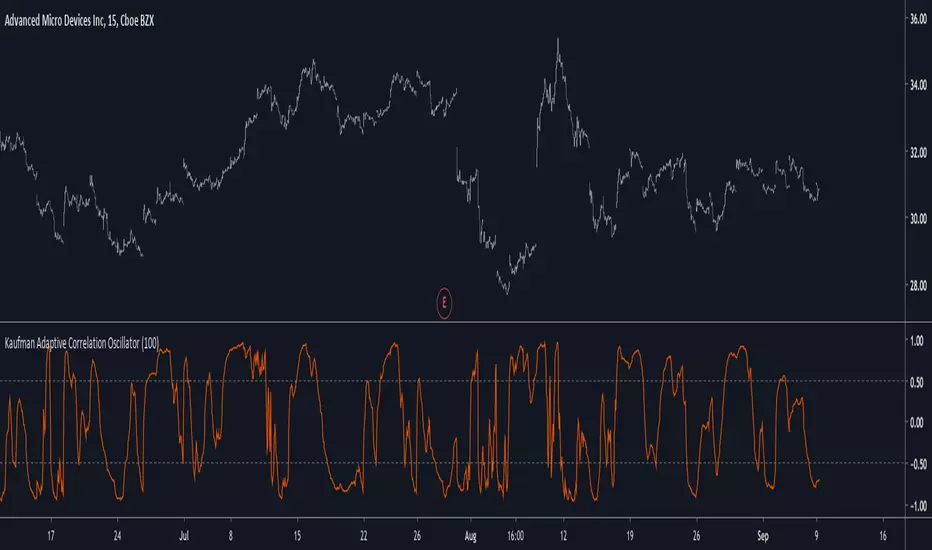
Kaufman Adaptive Correlation OscillatorIntroduction
The correlation oscillator is a technical indicator that measure the linear relationship between the market closing price and a simple increasing line, the indicator is in a (-1,1) range and rise when price is up-trending and fall when price is down-trending. Another characteristic of the indicator is its inherent smoothing which provide a noise free (to some extent) oscillator.
Such indicator use simple moving averages as well as estimates of the standard deviation for its calculation, but we can easily make it adaptive, this is why i propose this new technical indicator that create an adaptive correlation oscillator based on the Kaufman adaptive moving average.
The Indicator
The length parameter control the period window of the moving average, larger periods return smoother results while having a low kurtosis, which mean that values will remain around 1 or -1 a longer period of time. Pre-filtering apply a Kaufman adaptive moving average to the input, which allow for a smoother output.
No pre-filtering in orange, pre-filtering in yellow, period = 100 for both oscillators.
If you are not aware of the Kaufman adaptive moving average, such moving average return more reactive results when price is trending and smoother results when price is ranging, this also apply for the proposed indicator.
Conclusion
Classical correlation coefficients could use this approach, therefore the linear relationships between any variables could be measured. The fact that the indicator is adaptive add a certain potential, however such combination make the indicator have the drawback of kama + the correlation oscillator, which might appear at certain points.
Thanks for reading !
Koby's 3 average MACD indicatorThis MACD is averaging 3 different MACD; KAMA MACD, ZLEMA MACD, and normal MACD.
Can find easier MACD's divergence and convergence than normal MACD.
And more smoothly drawing than ZLEMA MACD (KZ_MACD) which is I've made before.
Fibonacci Period KAMA SeriesThis study is a simple experiment using Kaufman's Adaptive Moving Average that plots a base average with a period of your choice, then plots averages with periods multiplied by Fibonacci numbers 2 through 34.
Kaufman Moving Average Adaptive (KAMA) StrategyEveryone wants a short-term, fast trading trend that works without large
losses. That combination does not exist. But it is possible to have fast
trading trends in which one must get in or out of the market quickly, but
these have the distinct disadvantage of being whipsawed by market noise
when the market is volatile in a sideways trending market. During these
periods, the trader is jumping in and out of positions with no profit-making
trend in sight. In an attempt to overcome the problem of noise and still be
able to get closer to the actual change of the trend, Kaufman developed an
indicator that adapts to market movement. This indicator, an adaptive moving
average (AMA), moves very slowly when markets are moving sideways but moves
swiftly when the markets also move swiftly, change directions or break out of
a trading range.

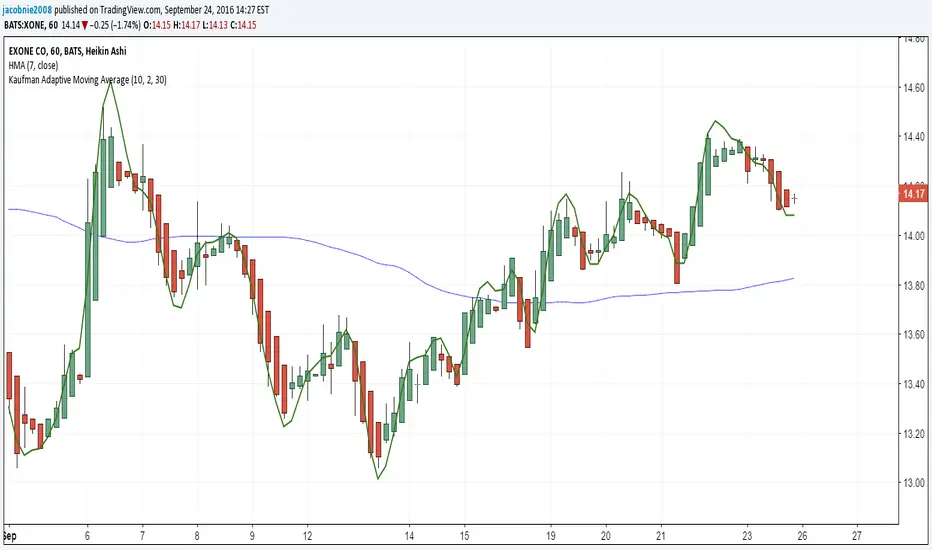
Kaufman Adaptive Moving Average (day)The KAMA will not change when the interval changes from day to something like 5 minutes or 30 minutes. Allows for more precise trading with the same indicator on a different interval.
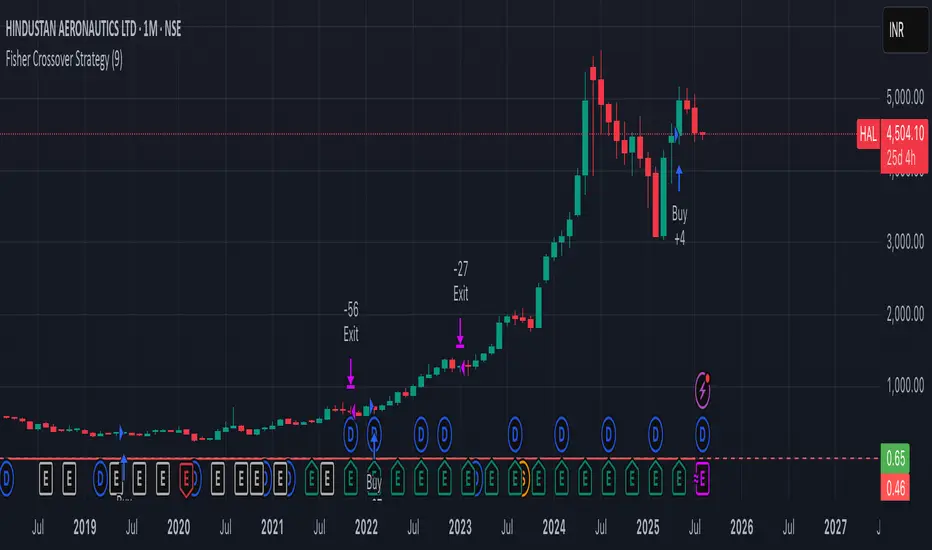
Fisher Crossover StrategyThe Fisher Crossover Strategy is a popular technical trading method that uses the Fisher Transform indicator developed by John Ehlers. This indicator mathematically converts price data into a normal Gaussian distribution, making market turning points sharper and easier to identify. The strategy is based on two lines: the Fisher line, which is the main transformed price value, and the Trigger line, which is a one-period lag of the Fisher line. Traders use the crossover of these lines to determine buy and sell opportunities.
A buy signal is generated when the Fisher line crosses above the Trigger line, indicating that bullish momentum may be starting, while a sell signal occurs when the Fisher line crosses below the Trigger line, suggesting a possible bearish reversal. Signals that occur relative to the zero line are often considered stronger; for example, a buy signal below the zero line may indicate a deeper market reversal. The strategy is simple to follow and can be applied to various markets including stocks, forex, commodities, and cryptocurrencies.
However, like all crossover strategies, it can produce false signals during sideways or ranging markets. To reduce whipsaws, traders often combine the Fisher Crossover Strategy with other tools such as support and resistance levels, volume analysis, or moving averages. Proper risk management with stop-loss and take-profit levels is also essential. Overall, the Fisher Crossover Strategy is valued for its clear entry and exit rules and its ability to highlight potential market reversals earlier than many other indicators.
Dynamic Momentum Ecosystem Futures verI've reuploaded my previous uploaded script Dynamic Momentum Ecosystem, but this one specifically catered to futures trading.
The idea and underlying script function as usual.
Lime = Price closed higher + volume transacted higher than average + MACD Histogram increases + 13 EMA increases
Green = Price closed higher + MACD Histogram increases + 13 EMA increases
Red = Price closed lower + MACD Histogram decreases + 13 EMA decreases
Blue = Either MACD Histogram increases/decreases + 13 EMA increases/decreases
Lime candle is viewed as a robust bullish sign as price increases, supported by the rising MACD Histogram, 13EMA, and higher than average volumes transacted. Perfect for dip buying near the 20/50 MAs.
Green candle is viewed as bullish with the rising of MACD Histogram and EMA . Good for dip buying near the 20/50 MAs.
Red candle is viewed as bearish with the declining of MACD Histogram and EMA . Good for short entry. Can also be the early sign to take profits, as it could be the preliminary signal for trend reversal.
Blue candle is viewed as neutral.
The upper dotted purple line is the 52candles high.
The vertical grey line appears when the price > MA50 crosses above MA200, which is a golden crossover.
Traders are advised to time their entry using the impulse coloring system for stocks that are trading near the dotted line, following the grey line formation.

3 SuperTrends + ATR SL + 3 EMAsHere I have assembled 3 indicators, SuperTrend + ATR + Ema, to make them fit into one indicator to make things more organized and to save space. Check Script for original Authors of the used scripts. The UI or the indicator is far from perfect as my programming skills are very low :D

KAMATaken an existing strategy and converted into a study + added the Buy/ Sell arrow.
I will update this submission and give proper credit once I find the original owner. Enjoy.

colorsi just put it for for who ever want it.. it has some issue of repaint . put on 1 day frame in hlc box ,so it can solve the issue to some extent. based on Marco code with some modification
i hope someone will be able to fix the code and make it better :)
HLC3/Kaufman Strategy This is an upgrade of the old Heikin/Kaufman Strategy. This script DONT use Heikin value anymore, so I hope no more repaint. Try it and let me know. Use an ADX indicator can help to check the strenght of the trend.

Kaufman Trend Strength Signal█ Overview
Kaufman Trend Strength Signal is an advanced trend detection tool that decomposes price action into its underlying directional trend and localized oscillation using a vector-based Kalman Filter.
By integrating adaptive smoothing and dynamic weighting via a weighted moving average (WMA), this indicator provides real-time insight into both trend direction and trend strength — something standard moving averages often fail to capture.
The core model assumes that observed price consists of two components:
(1) a directional trend, and
(2) localized noise or oscillation.
Using a two-step Predict & Update cycle, the filter continuously refines its trend estimate as new market data becomes available.
█ How It Works
This indicator employs a Kalman Filter model that separates the trend from short-term fluctuations in a price series.
Predict & Update Cycle : With each new bar, the filter predicts the price state and updates that prediction using the latest observed price, producing a smooth but adaptive trend line.
Trend Strength Normalization : Internally, the oscillator component is normalized against recent values (N periods) to calculate a trend strength score between -100 and +100.
(Note: The oscillator is not plotted on the chart but is used for signal generation.)
Filtered MA Line : The trend component is plotted as a smooth Kalman Filter-based moving average (MA) line on the main chart.
Threshold Cross Signals : When the internal trend strength crosses a user-defined threshold (default: ±60), visual entry arrows are displayed to signal momentum shifts.
█ Key Features
Adaptive Trend Estimation : Real-time filtering that adjusts dynamically to market changes.
Visual Buy/Sell Signals : Entry arrows appear when the trend strength crosses above or below the configured threshold.
Built-in Range Filter : The MA line turns blue when trend strength is weak (|value| < 10), helping you filter out choppy, sideways conditions.
█ How to Use
Trend Detection :
• Green MA = bullish trend
• Red MA = bearish trend
• Blue MA = no trend / ranging market
Entry Signals :
• Green triangle = trend strength crossed above +Threshold → potential bullish entry
• Red triangle = trend strength crossed below -Threshold → potential bearish entry
█ Settings
Entry Threshold : Level at which the trend strength triggers entry signals (default: 60)
Process Noise 1 & 2 : Control the filter’s responsiveness to recent price action. Higher = more reactive; lower = smoother.
Measurement Noise : Sets how much the filter "trusts" price data. High = smoother MA, low = faster response but more noise.
Trend Lookback (N2) : Number of bars used to normalize trend strength. Lower = more sensitive; higher = more stable.
Trend Smoothness (R2) : WMA smoothing applied to the trend strength calculation.
█ Visual Guide
Green MA Line → Bullish trend
Red MA Line → Bearish trend
Blue MA Line → Sideways/range
Green Triangle → Entry signal (trend strengthening)
Red Triangle → Entry signal (trend weakening)
█ Best Practices
In high-volatility conditions, increase Measurement Noise to reduce false signals.
Combine with other indicators (e.g., RSI, MACD, EMA) for confirmation and filtering.
Adjust "Entry Threshold" and noise settings depending on your timeframe and trading style.
❗ Disclaimer
This script is provided for educational purposes only and should not be considered financial advice or a recommendation to buy/sell any asset.
Trading involves risk. Past performance does not guarantee future results.
Always perform your own analysis and use proper risk management when trading.
