MACD Positive & Negative AlertThe MACD (Moving Average Convergence Divergence) is a momentum and trend-following indicator that helps traders identify the strength and direction of a trend, spot potential reversals, and fine-tune entry/exit timing.
Core Components
- MACD Line:
The difference between the 12-period and 26-period EMA (Exponential Moving Averages). This line highlights shifts in momentum and identifies the prevailing trend direction.
- Signal Line:
A 9-period EMA of the MACD line, acting as a trigger for buy/sell signals. When the MACD line crosses above the signal line, it suggests a bullish signal; when it crosses below, it suggests a bearish one.
- Histogram:
Shows the difference between the MACD line and the signal line as a bar graph. The histogram helps traders gauge the strength of the momentum and can warn of possible reversals. A rapidly growing histogram means strengthening momentum, while a shrinking one indicates weakening momentum.
Main Uses
- Trend Identification:
A positive MACD value typically signals a bullish trend, while a negative value signals a bearish trend.
- Momentum Analysis:
Divergences between MACD and price can warn of upcoming reversals. Increasing MACD histogram bars confirm strong momentum; shrinking bars suggest consolidation or reversal.
- Signal Generation:
Crossovers between the MACD line and the signal line generate trade signals—bullish (buy) if the MACD moves above the signal, bearish (sell) if it falls below l.
Example Interpretation
- MACD Crossover:
If the MACD line crosses above the signal line, it's often considered a buy signal; a cross below is a sell signal.
- Zero Line Cross:
If the MACD histogram moves from below zero to above, this is considered a bullish momentum shift; above zero to below is a bearish move.
The MACD is most effective in trending markets and should ideally be used alongside additional indicators for robust trading decisions.
Cerca negli script per "macd"

MACD-V (Volatility-Normalised Momentum) — Spiroglou, 2022Volatility-normalized MACD per Alex Spiroglou (2022):
MACD-V = (EMA12 − EMA26) / ATR26 × 100, so momentum is expressed in ATR units and stays comparable across assets/timeframes.
What you get
• Trend-colored line: green when price ≥ EMA200, red otherwise.
• Guides: ±50 / ±100 / 0; Extremes: ±140 (editable).
• Regime shading: OB ≥ +140 shaded red; OS ≤ −140 shaded green.
• Clean, on-curve markers: small circles on the MACD-V line at the four edge events — OB (enter ≥ +threshold), OBX (cross back down), OS (enter ≤ −threshold), OSX (cross back up).
• Text labels are off by default; optional toggle only for OB/OBX.
• Signal & histogram: EMA(9) of MACD-V and (MACD-V − Signal) columns.
• Alerts: OB/OS entries & exits included.
How to use
• Favor longs when MACD-V > 0 (ideally > +50); respect OB for possible exhaustion.
• Favor shorts when MACD-V < 0 (ideally < −50); respect OS for possible exhaustion.
• Because it’s ATR-normalized, thresholds transfer well across symbols and timeframes.

day trading check indicatorDay Trading Check Indicator
By Trades per Minute · Creator: Trader Malik
Overview
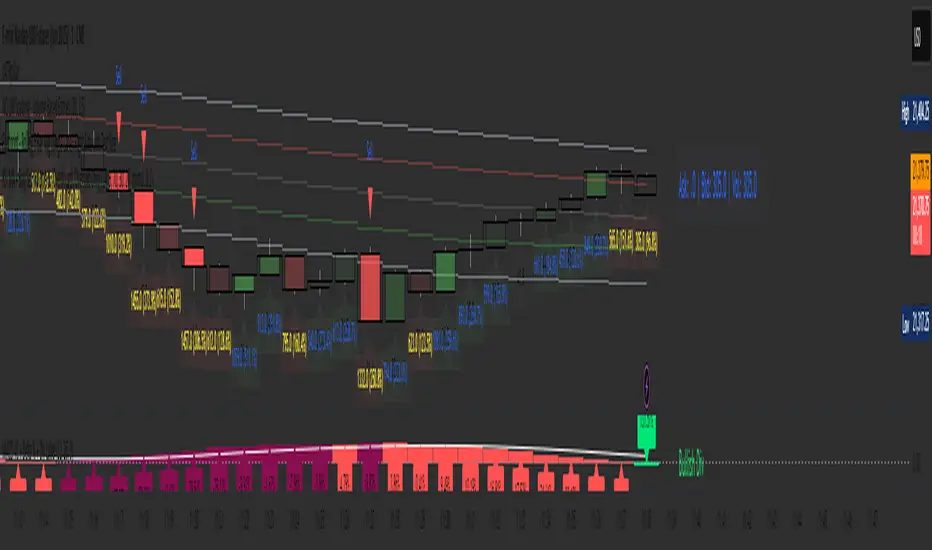
The Day Trading Check Indicator is an on‐chart status panel that gives you a quick “go/no-go” snapshot of four key metrics—MACD, VWAP, Float, and Bearish Sell-Off—directly in TradingView’s top-right corner. It’s designed for fast decision-making during high-velocity intraday sessions, letting you instantly see whether each metric is “bullish” (green) or “bearish” (red), plus live float data.
What It Shows
Column Description
Metric The name of each metric: MACD, VWAP, Float, Bearish Sell-Off
Status/Value A color-coded status (“GREEN”/“RED” or “YES”/“NO”) or the float value formatted in K/M/B
Metrics & Calculations
MACD (1-Minute)
Calculation: Standard MACD using EMA (12) – EMA (26) with a 9-period signal line, all fetched from the 1-minute timeframe via request.security().
Status:
GREEN if MACD ≥ Signal
RED if MACD < Signal
VWAP (Session-Anchored)
Calculation: Built-in session VWAP (ta.vwap(close)) resets each new trading session.
Status:
GREEN if current price ≥ VWAP
RED if current price < VWAP
Float
Calculation: Retrieves syminfo.shares_outstanding_float (total float), then scales it into thousands (K), millions (M), or billions (B), e.g. “12.3 M.”
Display: Always shown as the absolute float value, white on semi-transparent black.
Bearish Sell-Off
Calculation: Checks the last five 1-minute bars for any “high-volume down” candle (volume above its 20-bar SMA and close < open).
Status:
YES if at least one such bar occurred in the past 5 minutes
NO otherwise
Key Features
Dynamic Table: Automatically shows only the metrics you enable via the Display Options group.
Size Selector: Choose Small, Medium, or Large text for easy visibility.
Clean Styling: Distinct header row with custom background, consistent row shading, centered status text, and a subtle gray border.
Lightweight Overlay: No cluttering plots—just a concise status panel in the corner.
Published by Trader Malik / Trades per Minute
Version: Pine Script v5

ANDROMEDA - TrendSyncANDROMEDA - TrendSync
Pedro Canto - Portfolio Manager | CGA/CGE
OVERVIEW
Trend Sync is a multi-layered trend-following indicator designed to help traders identify high-probability trend continuation setups while avoiding low-quality entries caused by overbought or oversold market conditions.
This indicator combines the power of Moving Averages (MA), MACD , and a visual RSI-based filter to validate both trend direction and timing for entries. It's goal is simple: filter out noise and highlight only the most technically relevant buy and sell signals based on objective momentum and trend criteria.
---
WALKTHROUGH
This indicator is built for traders seeking to operate in the direction of established trends. It's core principle is to identify and validate current trend conditions, and then signal entry opportunities during pullbacks to key moving averages.
Trend identification is achieved through the alignment of two moving averages. When these MAs are crossed and angled in the same direction, they confirm that a trend is in progress. To double-confirm trend direction, the MACD histogram is used—only. When both the MAs and MACD are aligned in the same direction, then the trend is considered valid.
Once all trend criteria are met, a dynamic coloring system is activated to visually reinforce the trend across the candles and moving averages.
To avoid poor entries during market exhaustion, an RSI-based filter is used. This short-term RSI highlights overbought or oversold zones, helping traders filter trades in extreme price conditions.
Only when the trend is validated and price pulls back to one of the MAs will a buy/sell signal be triggered, aligning momentum, price action and timing into a single actionable setup.
This combination ensures that each component plays a specific role:
i) Moving Averages define the trend
ii) MACD validates it
iii) RSI filters noise
iv) Intrabar price action triggers entries
This synchronism helps improve decision-making and entry timing, especially for swing and intraday traders.
---
USE CASES
- Identifying trend continuation setups
- Filtering false signals during consolidation phases
- Avoiding trades in overbought or oversold zones
- Enhancing entry timing for both swing and intraday strategies
- Providing visual confirmation of trend strength and momentum alignment
---
KEY FEATURES
1. Dual Moving Average Setup
The indicator allows full customization of two moving averages (MA1 and MA2), supporting both EMA and SMA types. The slope of the longer MA (MA2) acts as an essential trend filter, ensuring signals are only generated when the market shows clear directional bias.
2. MACD Histogram Trend Confirmation
A classic MACD Histogram calculation is used to validate the momentum of the prevailing trend.
- Bullish Trend: Histogram > 0
- Bearish Trend: Histogram < 0
This step filters out counter-trend signals and ensures trades are aligned with momentum.
3. Intrabar Price Trigger
Unlike standard crossover systems, this indicator waits for intrabar price action to trigger entries:
- Buy Signal: Price crosses below one of the MAs during an uptrend (dip-buy logic)
- Sell Signal: Price crosses above one of the MAs during a downtrend (rally-sell logic)
This intrabar trigger improves entry timing and helps capture retracement-based opportunities.
4. RSI Visual Filter
A short-term RSI is plotted and color-coded to visually highlight overbought and oversold conditions, acting as a discretionary filter for users to avoid low-probability trades during exhaustion points.
5. Dynamic Coloring System
Bar Colors:
- Blue: Bullish trend
- Red: Bearish trend
- Orange: RSI Overbought/Oversold zones
MA Colors:
- Blue for bullish conditions
- Red for bearish conditions
- Gray for neutral/no-trend phases
6. Signal Markers and Alerts
Clear visual buy and sell markers are plotted directly on the chart.
Additionally, the indicator includes real-time alerts for both Buy and Sell signals, helping traders stay informed even when away from the screen.
---
INPUTS AND CUSTOMIZATION OPTIONS
- Moving Average Types: EMA or SMA for both MA1 and MA2.
- MACD Settings: Customizable fast, slow, and signal periods.
- RSI Settings: Source, length, and overbought/oversold levels fully adjustable.
- Color Customization: Adjust RSI zone colors to suit your chart theme.
---
DISCLAIMER
This indicator is a technical analysis tool designed for educational and informational purposes only. It should not be used as a standalone trading system. Always combine it with sound risk management, price action analysis, and, where applicable, fundamental context.
Past performance does not guarantee future results.

MACD Support and Resistance [ChartPrime]⯁ OVERVIEW
MACD Support and Resistance is a dynamic support/resistance mapping tool powered by MACD crossover logic. Each time the MACD line crosses the signal line, the indicator scans for recent price extremes and locks them in as potential support or resistance zones. These levels are automatically cleaned up if price breaks them, keeping the chart focused on active market structure. The system includes a built-in MACD display with visual markers, along with contextual highs and lows to help define the current environment.
⯁ MACD-BASED SUPPORT/RESISTANCE GENERATION
The core logic uses the MACD oscillator crossover as a trigger event to generate structural levels:
When MACD crosses above its signal line:
→ The script scans the last 5 bars for the lowest low .
→ A support level is plotted at that price.
When MACD crosses below its signal line:
→ The script scans the last 5 bars for the highest high .
→ A resistance level is plotted at that price.
These dynamic levels reflect where price recently reversed or paused, making them prime zones for reaction, continuation, or invalidation.
⯁ LEVEL MANAGEMENT AND VALIDATION
To keep the chart clean and relevant:
A maximum of 20 active levels are allowed at once.
Older levels are automatically removed if the list exceeds the limit.
If price closes below a support level or above a resistance level , the corresponding line is deleted.
This ensures that only currently respected levels remain on the chart — a major advantage for active traders.
⯁ MACD VISUALIZATION + SIGNAL MARKERS
A full MACD system is rendered on the lower panel for visual confirmation:
The MACD line and Signal line are both plotted and color-coded dynamically.
A filled area] highlights the spread between them to emphasize momentum strength.
A diamond marker is drawn each time MACD crosses its signal line, alerting traders to potential trend shifts.
These visuals make it easy to understand the timing of the support/resistance updates.
⯁ LOCAL EXTREME REFERENCE LINES
To help contextualize current price position relative to recent market extremes:
A Local High line is plotted based on the highest MACD value over the past 100 bars].
A Local Low line is plotted based on the lowest MACD value over the past 100 bars].
These levels are rendered lightly and serve as dynamic range boundaries.
They assist traders in identifying overextended or compressed MACD behavior.
⯁ USAGE
Use the generated S/R levels as breakout or reversal zones.
Watch for MACD diamond markers to confirm the timing of new levels.
Combine these reactive zones with other ChartPrime confluence tools for higher-confidence entries.
Use the Local High/Low zones as a volatility envelope to guide risk and trend continuation potential.
⯁ CONCLUSION
MACD Support and Resistance takes a classic momentum indicator and adds real-time structural awareness. By linking MACD crossover events to recent price extremes, it identifies the zones where market sentiment shifted — and continues to monitor their strength. Whether you're a breakout trader or looking to fade key reaction points, this tool delivers clean, actionable levels based on momentum and structure — not guesswork.

4 colour MACD with Delta % + Div LabelMACD 4C + Delta % + Divergence Label
This advanced MACD-based indicator is designed for professional traders seeking enhanced momentum analysis with visual clarity. It offers a multi-faceted view of MACD behavior with real-time insights into trend strength, acceleration, and divergence signals.
Key Features:
4-Color MACD Histogram:
Visually distinguishes between rising and falling MACD bars in both bullish and bearish zones for quicker momentum assessment.
Delta % Labels:
Each bar displays the percentage change in MACD compared to the previous bar, providing instant feedback on MACD acceleration and shift in momentum.
Automatic Divergence Detection:
Identifies regular bullish and bearish divergences using pivot-based logic. Displays clear, compact labels near MACD bars to highlight potential reversal zones.
Clean, Minimalist Design:
Divergence labels are sized for readability and positioned to avoid overlapping with MACD data, ensuring clean chart presentation.
No repainting or lag:
All divergence calculations are based on confirmed pivots, ensuring reliable signal generation without false alerts.
This tool is ideal for scalpers, swing traders, and momentum traders who rely on MACD dynamics for precise timing and directional bias. Use it to improve your entry and exit accuracy by combining traditional MACD signals with real-time volume and divergence insight.
🔹 Usage Notes
Recommended Timeframes:
Works well on all timeframes. For scalping, use 1m–5m; for swing trading, use 15m–1H+.
Best for:
Traders looking for a fast, visual way to assess trend strength and spot divergence-based reversal opportunities.
Pair With:
Can be used alongside price action, volume profile, RSI, or order flow-based indicators for confirmation.
How to Read:
Green/Red MACD bars indicate bullish/bearish momentum.
Delta % shows MACD change rate — increasing positive delta = strengthening trend.
Arrows/text labels signal potential divergence — pay attention when divergence aligns with support/resistance or price structure.
Notes:
No repainting — divergence is only drawn after pivots are confirmed.
All labels are automatically managed for clean display.
Can be customized further for hidden divergences or alert integration.
Gap Reversal Signal with Indicators🔍 Gap Reversal Signal with Indicators — 結合 KD、MACD、SAR 與背離分析的多功能指標
🔍 Gap Reversal Signal with Indicators — A Multi-Tool Signal Indicator Combining KD, MACD, SAR, and Divergence Analysis
中文說明:
本指標結合多種常用技術分析工具,包括 KD 隨機指標、MACD 動能交叉、SAR 趨勢方向、以及 MACD 背離偵測,用以辨識潛在的價格反轉區域。適用於日內交易與波段操作,支援各類市場,如加密貨幣、股票與外匯等。
English Description:
This indicator combines several popular technical tools: Stochastic KD, MACD momentum crossovers, SAR trend direction, and MACD divergence detection. It helps traders identify potential reversal areas and is ideal for both intraday and swing trading. Works well on crypto, stocks, and forex markets.
🧠 功能特點 | Key Features
✅ KD指標(慢速隨機指標)檢測超買超賣並提供%K與%D交叉訊號
✅ Stochastic KD (slow) to detect overbought/oversold zones and crossover signals
✅ MACD金叉/死叉與零軸突破捕捉趨勢轉變與動能反轉
✅ MACD Crossovers + Zero-Line Breaks to capture trend changes and momentum reversals
✅ SAR指標即時顯示多空方向
✅ Parabolic SAR for real-time trend direction indication
✅ MACD背離偵測協助辨識潛在反轉區域
✅ MACD Divergence Detection for identifying hidden trend reversals
✅ 圖形提示與標籤提示可視化呈現各類訊號
✅ Visual Alerts and Labels for easy and quick signal recognition
📈 支援市場 | Supported Markets
📊 台股 / 美股 / 外匯 / 加密貨幣
📊 Taiwan Stocks / US Stocks / Forex / Cryptocurrencies (e.g. BTC, ETH)
🔧 推薦用法 | Recommended Use
搭配缺口策略與支撐壓力位使用
Use with gap-trading strategies and support/resistance zones
用於盤整末期或趨勢反轉的提示
Helpful for end-of-consolidation signals or trend reversals
支援短線與波段交易風格
Suitable for scalping and swing trading styles
💡 把這個指標加入你的圖表,立即體驗多重技術分析所帶來的交易優勢!
💡 Add this indicator to your chart now and experience the power of multi-tool technical analysis!

BK AK-47 Divergence🚨 Introducing BK AK-47 Divergence — Multi-Timeframe Precision Firepower for True Traders 🚨
After months of development, I’m proud to release my fifth weapon in the arsenal — BK AK-47 Divergence.
💥 Why “AK-47”? The Meaning Behind the Name
The AK-47 isn’t just a rifle. It’s the symbol of reliability, versatility, and raw stopping power. It performs in every environment — from the mud to the mountains — just like this indicator cuts through noise on any timeframe, any asset, any condition.
🔸 “AK” honors the same legacy as before — my mentor, A.K., whose discipline and vision forged my trading edge.
🔸 “47” signifies layered precision: 4 = structure, 7 = spiritual completion. Together, it’s the weapon of divine order that adapts, reacts, and strikes with purpose.
🔍 What Is BK AK-47 Divergence?
It’s a next-generation divergence detector — a smart hybrid of MACD, Bollinger Bands, and multi-timeframe divergence logic wrapped in a custom volatility engine and real-time flash alerts.
Designed for snipers in the market — those who only take the highest-probability shots.
⚙️ Core Weapon Systems
✅ MACD + BB Precision Overlay → MACD plotted inside dynamic Bollinger Bands — reveals hidden pressure zones where most indicators fail.
✅ Smart Histogram Scaling → Adaptive amplification based on volatility. No more weak histograms in strong markets.
✅ Full Multi-Timeframe Divergence Detection:
🔻 Current TF Divergence
🕐 Higher TF Divergence
⏱️ Lower TF Divergence
Each plotted with clean visual alerts, color-coded by direction and timeframe. You get instant divergence recognition across dimensions.
✅ Background Flash Alerts → When MACD hits BB extremes, the background lights up in red or green. Eyes instantly lock in on key moments.
✅ Advanced Pivot Lookback Control → New lookback system compares multiple pivot layers, not just the last swing. This gives true structural divergence, not just noise.
✅ Dynamic Fill Zones:
🔴 Oversold
🟢 Overbought
🔵 Neutral
Built to filter false signals and highlight hidden edge.
🛡️ Why This Indicator Changes the Game
🔹 Built for divergence snipers — not lagging MACD watchers.
🔹 Perfect for traders who sync with:
• Elliott Waves
• Fibonacci Time/Price Clusters
• Harmonic Patterns
• Gann Angles or Squares
• Price Action & Trendlines
🔹 Lets you visually map:
• Converging divergences (multi-TF confirmation)
• High-volatility histograms in low-volatility price zones (entry sweet spots)
• Flash-momentum warnings at BB pressure zones
🎯 How to Use BK AK-47 Divergence
🔹 Breakout Confirmation → MACD breaches upper BB with bullish divergence = signal to ride momentum.
🔹 Mean Reversion Reversals → MACD breaks lower BB + bullish div = setup for sniper long.
🔹 Top/Bottom Detection → Bearish divergence + MACD failure at upper BB = early reversal signal.
🔹 TF Sync Strategy → Align current TF with higher or lower divergences for laser-confirmed entries.
🧠 Final Thoughts
This isn’t just a divergence tool. It’s a battlefield reconnaissance system — one that lets you see when, where, and why the next pivot is forming.
🔹 Built in honor of the AK-legacy — reliability, discipline, and firepower.
🔹 Designed to cut through noise, expose structure, and alert you to what really matters.
🔹 Crafted for those who trade with intent, vision, and respect for the craft.
🙏 And most importantly: All glory to Gd — the One who gives wisdom, clarity, and purpose.
Without Him, the markets are chaos. With Him, we move in structure, order, and divine timing.
—
⚡ Stay dangerous. Stay precise. Stay aligned.
🔥 BK AK-47 Divergence — Locked. Loaded. Laser-focused. 🔥
May the markets bend to your discipline.
Gd bless. 🙏

Price OI Division Price OI Division Indicator
Overview
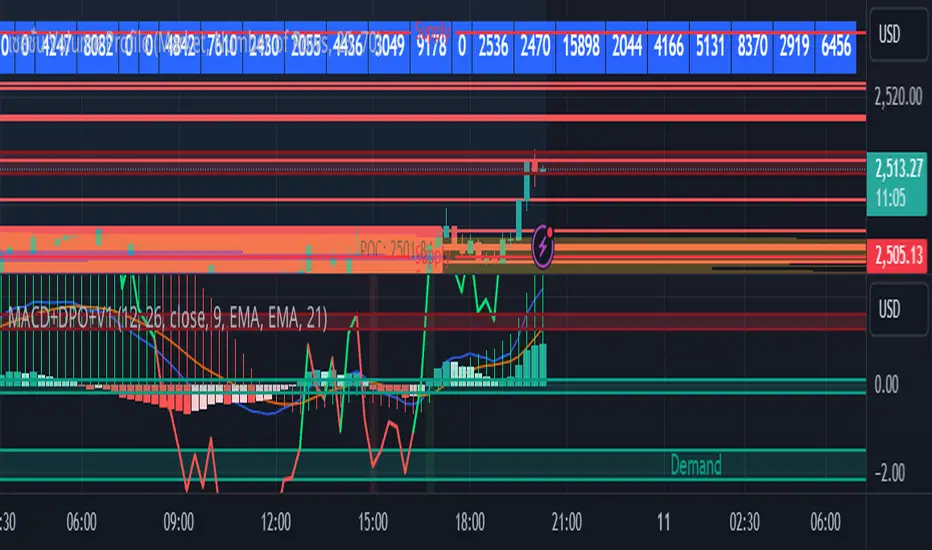
The Price OI Division indicator (`P_OI_D`) is a custom TradingView script designed to analyze the relationship between price momentum and open interest (OI) momentum. It visualizes the divergence between these two metrics using a modified MACD (Moving Average Convergence Divergence) approach, normalized to percentage values. The indicator is plotted as a histogram and two lines (MACD and Signal), with color-coded signals for easier interpretation.
Key Features
- Normalized Price MACD : Compares short-term and long-term price momentum.
- OI-Adjusted MACD : Incorporates open interest data to reflect market positioning.
- Divergence Histogram : Highlights the difference between price and OI momentum.
- Signal Line : Smoothed EMA of the divergence for trend confirmation.
- Threshold Lines : Horizontal reference lines at ±10% and 0 for quick visual analysis.
Interpretation Guide
- Bullish Signal :
Histogram turns red (positive & increasing).
MACD (red line) crosses above Signal (blue line).
Divergence above +10% indicates extreme bullish conditions.
- Bearish Signal :
Histogram turns green (negative & increasing).
MACD (lime line) crosses below Signal (maroon line).
Divergence below -10% indicates extreme bearish conditions.
- Neutral/Reversal :
Histogram fading (teal/pink) suggests weakening momentum.
Crossings near the Zero Line may signal trend shifts.
Usage Notes
Asset Compatibility : Works best with futures/perpetual contracts where OI data is available.
Timeframe : Suitable for all timeframes, but align `fastLength`/`slowLength` with your strategy.
Data Limitations : Relies on exchange-specific OI symbols (e.g., `BTC:USDT.P_OI`). Verify data availability for your asset.
Confirmation : Pair with volume analysis or support/resistance levels for higher accuracy.
Disclaimer
This indicator is for educational purposes only. Trading decisions should not be based solely on this tool. Always validate signals with additional analysis and risk management.

MACD Crossover + AlertMACD Proximity & Crossover Alert Script
This script is designed to help traders stay ahead of MACD crossovers by providing:
Early alerts when the MACD and Signal lines are getting close (within a customizable threshold)
Instant alerts when a bullish or bearish crossover occurs
Whether you're swing trading or scalping, this tool gives you advanced notice to prepare — and a confirmation signal to act on. It works on any timeframe and helps avoid late entries by alerting you when momentum is shifting.
Features:
Customizable MACD settings (fast, slow, signal length)
Adjustable "proximity" threshold
Visual background highlight when lines are close
Built-in alert conditions for:
MACD crossing above Signal (bullish)
MACD crossing below Signal (bearish)
MACD and Signal getting close (early warning)
Perfect for traders who want a heads-up before momentum shifts — not just a reaction afterward.
MACD Crossover Breakout Rays with VWAP & Breakout ConfirmationOverview
This script is designed to highlight potential strong breakout moves by combining MACD crossovers, VWAP confirmation, and price action breakouts. It helps traders identify momentum shifts and filter high-probability trade setups.
How It Works
1. MACD Crossover Detection
- The script detects bullish crossovers (MACD line crossing above the signal line) and bearish crossovers (MACD line crossing below the signal line).
- A horizontal ray is drawn at the high (bullish) or low (bearish) of the crossover candle.
2. Multi-Timeframe MACD Confirmation
- A secondary MACD crossover is checked on a lower timeframe (default: 5 minutes) to confirm the strength of the move.
- The script ensures alignment between the primary and lower timeframe MACD crossovers before signaling a strong move.
3. VWAP Confirmation
- A bullish breakout is valid only if the price is above the VWAP.
- A bearish breakout is valid only if the price is below the VWAP.
4. Breakout Validation
- The script waits for price action confirmation—a breakout is only valid when a candle closes above (bullish) or below (bearish) the horizontal ray.
- Once confirmed, the ray color changes to blue to signal a strong move.
5. Label Alerts for Strong Moves
- When all conditions align, the script prints "STRONG 💪 MOVE" above or below the breakout candle.
- The previous label is automatically removed to keep the chart clean.
Customization Options
- MACD Settings: Adjust fast/slow lengths and signal smoothing.
- Lower Timeframe Confirmation: Choose a different timeframe for multi-timeframe MACD validation.
- VWAP Filtering: Ensure breakouts align with volume-weighted trends.
- Ray Length & Colors: Customize the horizontal ray length, width, and colors.
- Breakout Confirmation Window: Adjust how many bars to check for MACD alignment.
Best Use Cases
✅ Identifying high-probability breakouts with trend confirmation.
✅ Filtering out false signals by requiring multi-timeframe agreement.
✅ Helping traders stay in momentum-driven moves with strong confirmation.
⚠ Note: This script is for educational purposes only and does not constitute financial advice. Always conduct your own analysis before making trading decisions.

MACD Highs and Lows - Dynamic Support & ResistanceDescription:
Enhance your trading strategy with the MACD Highs and Lows indicator, designed to identify dynamic support and resistance levels based on MACD crossovers. This tool plots key price levels triggered by shifts in MACD momentum, helping traders spot potential reversal zones, breakout points, and trend confirmation signals.
Key Features
Dynamic Levels: Automatically plots recent highs/lows when MACD crosses above/below the zero line.
Customizable MACD Parameters:
Adjustable fast/slow lengths (default: 12/26).
Choose between SMA or EMA for oscillator/signal line.
Flexible signal smoothing (1-50 periods).
Visual Clarity:
Clear green/red lines for highs and lows.
Tracks both price extremes and adjacent candle levels (e.g., high-of-low-bar, low-of-high-bar).
Multi-Timeframe Utility: Works across charts for swing trading, scalping, or trend analysis.
How It Works
Bullish Signal: When MACD crosses above zero, the indicator marks the recent lowest low (support) and its corresponding high.
Bearish Signal: When MACD crosses below zero, it plots the recent highest high (resistance) and its corresponding low.
Levels persist until the next crossover, creating actionable reference zones.
Use Cases
Trend Confirmation: Validate breakouts when price closes above/below plotted levels.
Stop Loss Placement: Set stops beyond recent dynamic highs/lows.
Divergence Detection: Spot discrepancies between MACD momentum and price action.
Settings Tips:
Increase Fast Length for responsiveness or Slow Length for smoother signals.
Use EMA for faster reactions, SMA for reduced noise.

SatoshiSteps Swing StrategyCore Components:
The indicator combines three popular technical analysis tools:
Ichimoku Cloud: This helps identify the trend, support, and resistance levels.
RSI (Relative Strength Index): This momentum oscillator identifies overbought and oversold conditions.
MACD (Moving Average Convergence Divergence): This trend-following momentum indicator shows the relationship between two moving averages1 of prices.
Logic:
The strategy aims to identify potential swing trading opportunities by combining signals from these three components. It essentially looks for:
Trend Confirmation (Ichimoku):
Price should be above the Ichimoku cloud for buy signals.
Price should be below the Ichimoku cloud for sell signals.
The Tenkan-sen (conversion line) should cross above the Kijun-sen (base line) for buy signals.
The Tenkan-sen should cross below the Kijun-sen for sell signals.
Overbought/Oversold Conditions (RSI):
RSI should be below the overbought level for buy signals (avoiding buying when the market is potentially overextended).
RSI should be above the oversold level for sell signals (avoiding selling when the market is potentially oversold).
Momentum Confirmation (MACD):
The MACD line should be above the signal line for buy signals (indicating upward momentum).
The MACD line should be below the signal line for sell signals (indicating downward momentum).
Buy Signal:
A buy signal is generated when all the following conditions are met:
The Tenkan-sen crosses above the Kijun-sen.
The price is above both the Senkou Span A and Senkou Span B (the cloud).
The RSI is below the overbought level.
The MACD line is above the signal line.
Sell Signal:
A sell signal is generated when all the following conditions are met:
The Tenkan-sen crosses below the Kijun-sen.
The price is below both the Senkou Span A and Senkou Span B (the cloud).
The RSI is above the oversold level.
The MACD line is below the signal line.
Key Considerations:
Time Frame: The indicator has built-in adjustments for 1-hour and 4-hour timeframes, optimizing the parameters for each.
Customization: You can customize the overbought/oversold RSI levels and the styles of the buy/sell signals (triangle, label, arrow, circle) through the indicator's settings.
Accuracy: While the strategy combines multiple indicators to improve accuracy, remember that no trading indicator is perfect. Market conditions can change rapidly, and false signals can occur.
Risk Management: Always use proper risk management techniques, such as stop-loss orders, and never risk more than you can afford to lose.

MACD+RSI+BBDESCRIPTION
The MACD + RSI + Bollinger Bands Indicator is a comprehensive technical analysis tool designed for traders and investors to identify potential market trends and reversals. This script combines three indicators: the Moving Average Convergence Divergence (MACD), the Relative Strength Index (RSI), and Bollinger Bands. Each of these indicators provides unique insights into market behavior.
FEATURES
MACD (Moving Average Convergence Divergence)
The MACD is a trend-following momentum indicator that shows the relationship between two moving averages of a security’s price.
The script calculates the MACD line, the signal line, and the histogram, which visually represents the difference between the MACD line and the signal line.
RSI (Relative Strength Index)
The RSI is a momentum oscillator that measures the speed and change of price movements. It ranges from 0 to 100 and is typically used to identify overbought or oversold conditions.
The script allows users to set custom upper and lower thresholds for the RSI, with default values of 70 and 30, respectively.
Bollinger Bands
Bollinger Bands consist of a middle band (EMA) and two outer bands (standard deviations away from the EMA). They help traders identify volatility and potential price reversals.
The script allows users to customize the length of the Bollinger Bands and the multiplier for the standard deviation.
Color-Coding Logic
The histogram color changes based on the following conditions:
Black: If the RSI is above the upper threshold and the closing price is above the upper Bollinger Band, or if the RSI is below the lower threshold and the closing price is below the lower Bollinger Band.
Green (#4caf50): If the RSI is above the upper threshold but the closing price is not above the upper Bollinger Band.
Light Green (#a5d6a7): If the histogram is positive and the RSI is not above the upper threshold.
Red (#f23645): If the RSI is below the lower threshold but the closing price is not below the lower Bollinger Band.
Light Red (#faa1a4): If the histogram is negative and the RSI is not below the lower threshold.
Inputs
Bollinger Bands Settings
Length: The number of periods for the moving average.
Basis MA Type: The type of moving average (SMA, EMA, SMMA, WMA, VWMA).
Source: The price source for the Bollinger Bands calculation.
StdDev: The multiplier for the standard deviation.
RSI Settings
RSI Length: The number of periods for the RSI calculation.
RSI Upper: The upper threshold for the RSI.
RSI Lower: The lower threshold for the RSI.
Source: The price source for the RSI calculation.
MACD Settings
Fast Length: The length for the fast moving average.
Slow Length: The length for the slow moving average.
Signal Smoothing: The length for the signal line smoothing.
Oscillator MA Type: The type of moving average for the MACD calculation.
Signal Line MA Type: The type of moving average for the signal line.
Usage
This indicator is suitable for various trading strategies, including day trading, swing trading, and long-term investing.
Traders can use the MACD histogram to identify potential buy and sell signals, while the RSI can help confirm overbought or oversold conditions.
The Bollinger Bands provide context for price volatility and potential breakout or reversal points.
Example:
From the example, it can clearly see that the Selling Climax and Buying Climax, marked as orange circle when a black histogram occurs.
Conclusion
The MACD + RSI + Bollinger Bands Indicator is a versatile tool that combines multiple technical analysis methods to provide traders with a comprehensive view of market conditions. By utilizing this script, traders can enhance their analysis and improve their decision-making process.

MACD Histogram Fibonacci Retracement LevelsMACD Histogram Fibonacci Retracement Level s.
MACD Histogram Fibonacci Retracement Levels indicator considers the highest and lowest histogram bar levels from Intraday Day Open.
Fibonacci retracement levels 23.6%, 38.2%, 50%, 61.8%, and 78.6% are displayed for the Highest and Lowest histogram bar .As the day progress revised Fibonacci Retracement Levels are set in based on change in Highest and Lowest histogram bar levels.
Histogram bars positions are monitored vis a vis the Fibonacci Retracement Levels to plan the trade entry or exit as per MACD indicator.
MACD and Signal levels are opted out to get clear histogram bar image on chart. Input check in box is available to display MACD and signal lines at Users option.
A Histogram intraday average line (Histo Intra Avg) indicate the intraday average movement of histogram bars.
MACD Histogram Fibonacci Retracement Levels is very useful to know the level of upward and downward Histogram bar movements vis a vis Fibonacci Retracement Levels compared to general MACD Indicator Histogram levels.
DISCLAIMER: For educational and entertainment purpose only .Nothing in this content should be interpreted as financial advice or a recommendation to buy or sell any sort of security/ies or investment/s.

Adaptive MA Scalping StrategyAdaptive MA Scalping Strategy
The Adaptive MA Scalping Strategy is an innovative trading approach that merges the strengths of the Kaufman's Adaptive Moving Average (KAMA) with the Moving Average Convergence Divergence (MACD) histogram. This combination results in a momentum-adaptive moving average that dynamically adjusts to market conditions, providing traders with timely and reliable signals.
How It Works
Kaufman's Adaptive Moving Average (KAMA): Unlike traditional moving averages, KAMA adjusts its sensitivity based on market volatility. It becomes more responsive during trending markets and less sensitive during periods of consolidation, effectively filtering out market noise.
MACD Histogram Integration: The strategy incorporates the MACD histogram, a momentum indicator that measures the difference between a fast and a slow exponential moving average (EMA). By adding the MACD histogram values to the KAMA, the strategy creates a new line—the momentum-adaptive moving average (MOMA)—which captures both trend direction and momentum.
Signal Generation:
Long Entry: The strategy enters a long position when the closing price crosses above the MOMA. This indicates a potential upward momentum shift.
Exit Position: The position is closed when the closing price crosses below the MOMA, signaling a potential decline in momentum.
Cloud Calculation Detail
The MOMA is calculated by adding the MACD histogram value to the KAMA of the price. This addition effectively adjusts the KAMA based on the momentum indicated by the MACD histogram. When momentum is strong, the MACD histogram will have higher values, causing the MOMA to adjust accordingly and provide earlier entry or exit signals.
Performance on Stocks
This strategy has demonstrated excellent performance on stocks when applied to the 1-hour timeframe. Its adaptive nature allows it to respond swiftly to market changes, capturing profitable trends while minimizing the impact of false signals caused by market noise. The combination of KAMA's adaptability and MACD's momentum detection makes it particularly effective in volatile market conditions commonly seen in stock trading.
Key Parameters
KAMA Length (malen): Determines the sensitivity of the KAMA. A length of 100 is used to balance responsiveness with noise reduction.
MACD Fast Length (fast): Sets the period for the fast EMA in the MACD calculation. A value of 24 helps in capturing short-term momentum changes.
MACD Slow Length (slow): Sets the period for the slow EMA in the MACD calculation. A value of 52 smooths out longer-term trends.
MACD Signal Length (signal): Determines the period for the signal line in the MACD calculation. An 18-period signal line is used for timely crossovers.
Advantages of the Strategy
Adaptive to Market Conditions: By adjusting to both volatility and momentum, the strategy remains effective across different market phases.
Enhanced Signal Accuracy: The fusion of KAMA and MACD reduces false signals, improving the accuracy of trade entries and exits.
Simplicity in Execution: With straightforward entry and exit rules based on price crossovers, the strategy is user-friendly for traders at all experience levels

MACD with DPO Strategy by NGExplanation of the MACD with DPO Strategy:
MACD (Moving Average Convergence Divergence):
The MACD is a trend-following indicator that shows the relationship between two moving averages of a price.
In this script:
We calculate the MACD line by subtracting the slow moving average (typically 26-period EMA) from the fast moving average (typically 12-period EMA).
The Signal line is calculated as a 9-period EMA of the MACD line.
The Histogram is the difference between the MACD line and the Signal line, indicating the momentum of the price trend.
Buy Condition: The script generates a buy signal when the MACD histogram crosses from negative to positive (indicating a bullish momentum) and DPO is also positive.
Sell Condition: The script generates a sell signal when the MACD histogram crosses from positive to negative (indicating a bearish momentum) and DPO is also negative.
DPO (Detrended Price Oscillator):
The DPO removes long-term trends from prices, making it easier to identify shorter-term cycles or oscillations.
In this script:
We calculate the DPO by subtracting a shifted simple moving average (SMA) from the close price. The shifting period depends on half the specified period.
We also calculate the DPO SMA as a 30-period EMA of the DPO values.
DPO Color: The DPO line is colored green when the DPO is above zero (indicating upward momentum) and red when it is below zero (indicating downward momentum). The histogram is also colored based on whether the DPO is positive or negative.
Plotting and Alerts:
The script plots the MACD, Signal, and Histogram on the chart.
Additionally, it plots the DPO and its SMA with different colors depending on whether the DPO is above or below zero.
Buy Signal: A green arrow labeled "BUY" is plotted below the bar when both MACD and DPO indicate a bullish condition.
Sell Signal: A red arrow labeled "SELL" is plotted above the bar when both MACD and DPO indicate a bearish condition.
Background colors are used to highlight the chart whenever a buy or sell condition occurs.
The script also includes alerts for both buy and sell signals, allowing users to set notifications when conditions are met.
How to Use:
Identify Buy and Sell Signals:
The script generates a Buy signal when:
The MACD histogram crosses from negative to positive (bullish momentum), and
The DPO is above zero (indicating upward momentum).
The script generates a Sell signal when:
The MACD histogram crosses from positive to negative (bearish momentum), and
The DPO is below zero (indicating downward momentum).
Chart Visualization:
The MACD histogram and Signal line help visualize the momentum and potential trend reversal.
The DPO and DPO SMA help visualize the shorter-term price cycles.
The signals (Buy and Sell) will be plotted on the chart with arrows indicating entry points.
Customization:
You can adjust the MACD and DPO parameters (such as fast_length, slow_length, period_) to fit your trading style or market conditions.
The script can be used in any timeframe depending on your strategy (e.g., intraday trading or longer-term trading).
Example Scenario:
If you're looking for potential buy opportunities, wait for the script to generate a buy signal (green arrow) where the MACD histogram has shifted to positive, and DPO is also in the green (above zero). This signals that both momentum and cycle direction are aligned for a potential upward movement.
Conversely, for sell opportunities, wait for the red arrow where MACD momentum is turning negative and DPO is also negative (below zero), indicating a bearish condition.
This combination of MACD and DPO allows traders to identify stronger and more reliable entry/exit points by confirming the trend with the MACD and detecting shorter-term price cycles with the DPO.
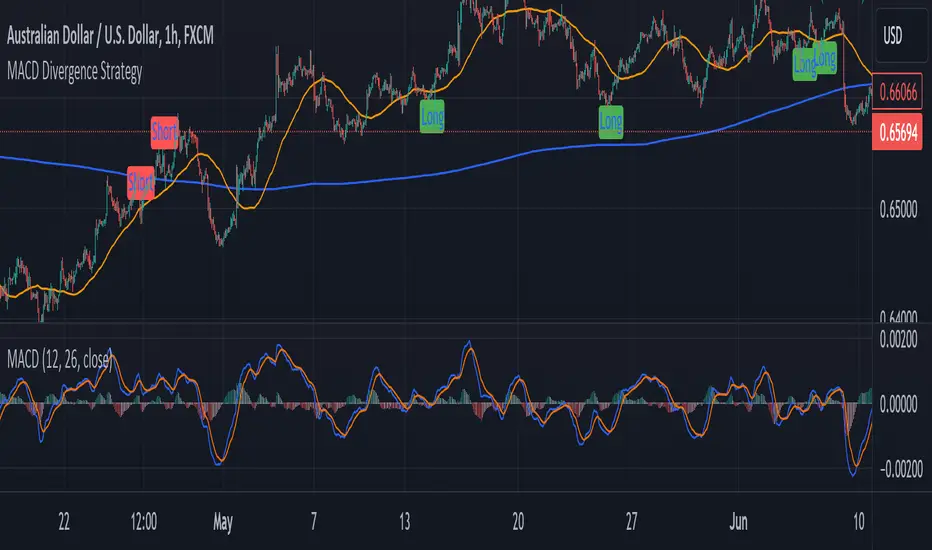
MACD Divergence StrategyStrategy Description: MACD Divergence with SMA Crossover Strategy
Overview:
The MACD Divergence with SMA Crossover Strategy is designed to identify high-probability trading opportunities based on the interaction of the MACD (Moving Average Convergence Divergence) indicator and key moving averages. This strategy focuses on detecting divergences between the MACD line and the signal line, combined with specific conditions related to the 50-period and 800-period SMAs. It ensures that the MACD and signal lines do not cross the zero line between the current and previous divergence points, thereby filtering out weaker signals and enhancing the accuracy of trade entries.
Key Components:
Simple Moving Averages (SMAs):
50-period SMA: A short-term trend indicator that helps identify the prevailing market direction.
800-period SMA: A long-term trend indicator used to gauge the overall market trend.
MACD Indicator:
MACD Line: Represents the difference between the 12-period EMA and the 26-period EMA.
Signal Line: A 9-period EMA of the MACD line.
Histogram: The difference between the MACD line and the signal line, used to visualize the strength of the signal.
Trade Conditions:
Long Position (Buy):
The 50 SMA is above the 800 SMA, indicating a bullish market trend.
The MACD line and signal line are both below zero, signifying a potential bullish reversal.
A bullish divergence is detected when the MACD line crosses above the signal line below zero, without either line crossing the zero level between the current and previous cross.
Short Position (Sell):
The 50 SMA is below the 800 SMA, indicating a bearish market trend.
The MACD line and signal line are both above zero, signaling a potential bearish reversal.
A bearish divergence is detected when the MACD line crosses below the signal line above zero, without either line crossing the zero level between the current and previous cross.
Signal Plotting:
Long Signals: Displayed when the conditions for a bullish divergence and SMA alignment are met, marked with a green upward arrow on the chart.
Short Signals: Displayed when the conditions for a bearish divergence and SMA alignment are met, marked with a red downward arrow on the chart.
MACD Trail | Flux Charts💎 GENERAL OVERVIEW
Introducing our new MACD Trail indicator! Moving average convergence/divergence (MACD) is a well-known indicator among traders. It's a trend-following indicator that uses the relationship between two exponential moving averages (EMAs). This indicator aims to use MACD to generate a trail that follows the current price of the ticker, which can act as a support / resistance zone. More info about the process in the "How Does It Work" section.
Features of the new MACD Trail Indicator :
A Trail Generated Using MACD Calculation
Customizable Algorithm
Customizable Styling
📌 HOW DOES IT WORK ?
First of all, this indicator calculates the current MACD of the ticker using the user's input as settings. Let X = MACD Length setting ;
MACD ~= X Period EMA - (X * 2) Period EMA
Then, two MACD Trails are generated, one being bullish and other being bearish. Let ATR = 30 period ATR (Average True Range)
Bullish MACD Trail = Current Price + MACD - (ATR * 1.75)
Bearish MACD Trail = Current Price + MACD + (ATR * 1.75)
The indicator starts by rendering only the Bullish MACD Trail. Then if it's invalidated (candlestick closes below the trail) it switches to Bearish MACD Trail. The MACD trail switches between bullish & bearish as they get invalidated.
The trail type may give a hint about the current trend of the price action. The trail itself also can act as a support / resistance zone, here is an example :
🚩 UNIQUENESS
While MACD is one of the most used indicators among traders, this indicator aims to add another functionality to it by rendering a trail based on it. This trail may act as a support / resistance zone as described above, and gives a glimpse about the current trend. The indicator also has custom MACD Length and smoothing options, as well as various style options.
⚙️ SETTINGS
1. General Configuration
MACD Length -> This setting adjusts the EMA periods used in MACD calculation. Increasing this setting will make MACD more responseive to longer trends, while decreasing it may help with detection of shorter trends.
Smoothing -> The smoothing of the MACD Trail. Increasing this setting will help smoothen out the MACD Trail line, but it can also make it less responsive to the latest changes.

Moving Average Crossover Swing StrategyMoving Average Crossover Swing Strategy
**Overview:**
The basic concept of this strategy is to generate a signal when a faster/shorter length moving average crosses over (for Longs) or crosses under (for Shorts) a medium/longer length moving average. All of which are customizable. This strategy can work on any timeframe, however the daily is the timeframe used for the default settings and screenshots, as it was designed to be a multi-day swing strategy. Once a signal has been confirmed with a candle close, based on user options, the strategy will enter the trade on the open of the next candle.
The crossover strategy is nothing new to trading, but what can make this strategy unique and helpful, is the addition of further confirmation points, ATR based stop loss and take profit targets, optional early exit criteria, customizable to your needs and style, and just about everything visual can be toggled on/off. This strategy is based on a Trend (MA) indicator and a Momentum (MACD) indicator. While a Volume-based indicator is not shown here, one could consider using their favorite from that category to further compliment the signal idea.
It should be noted that depending on the time frame, direction(s) chosen, the signal options, confirmation options, and exit options selected, that a ticker may not produce more than 100 trades on the back test. Depending on your style and frequency, one could consider adjusting options and/or testing multiple tickers. It should also be noted that this strategy simply tests the underlying stock prices, not options contracts. And of course, testing this strategy against historical data does not assume that the same results will occur in future price action.
Shoutout given to Ripster's Clouds Indicator as pieces of that code were taken and modified to create both the Cloud visualization effects, and the Moving Average Pair Plots that are implemented in this strategy.
BASIC DEFAULTS
All can be changed as normal
Initial capital = 10,000
Order Sizing = 25% of equity (use the "Inputs" tab to modify this)
Pyramiding = 0
Commission = 0.65 USD per order
Price Verification = 1 tick
Slippage = 1 tick
RISK MANAGMENT
You will notice two different percentage options and ATR multipliers. This strategy will adjust position sizing by not exceeding either one of those % values based on the ATR (Average True Range) of the symbol and the multipliers selected, should the stock hit the stop loss price.
For Example, lets assume these values are true:
Account size = $10,000,
Max Risk = 1% of account size
Max Position Size = 25% of the account size
Stock Price = 23.45
ATR = 3.5
ATR Stop Loss Multiplier = 1.4
Then the formulas would be:
ACCT_SIZE * MaxRisk_% = 10000 * .01 = $100 (MaxCashRisk)
-----
MaxCashRisk / (ATR * ATR_SL_MULTIPLIER) = 100 / (3.5 * 1.4) = 20.4 Shares based on Max Cash Risk
-----
(ACCT_SIZE * MaxEquity_%) / STOCK_PRICE = (10000 * .25) / 23.45 = 106.61 Shares based on Max Equity Allocation
The minimum value of each of those options is then used, which in this case would be to purchase 20 shares so as not to exceed the max dollar risk should the stock reach the stop loss target. Likewise, if the ATR were to be much lower, say 0.48 cents, and all else the same, then the strategy would purchase the 106 shares based on Max Equity Allocation because the Max Cash Risk would require 149.25 shares.
MOVING AVERAGE OPTIONS
Select between and change the length & type of up to 5 pairs (10 total) of moving averages
The "Show Cloud-x" option will display a fill color between the "a" and "b" pairs
All moving averages lines can be toggled on/off in the "Style" tab, as well as adjusting their colors.
Visualization features do not affect calculations, meaning you could have all or nothing on the chart and the strategy will still produce results
SIGNAL CHOICES
Choose the fast/shorter length MA and the medium/longer length MA to determine the entry signal
CONFIRMATION OPTIONS
Both of these have customizable values and can be toggled on/off
A candle close over a slower/much longer length moving average
An additional cross-over (cross-under for Shorts) on the MACD indicator using default MACD values. While the MACD indicator is not necessary to have on the chart, it can help to add that for visualization. The calculations will perform whether the indicator is on the chart or not.
EARLY EXIT CRITERIA
Both can be toggled on/off with customizable values
MA Cross Exit will exit the trade early if the select moving averages cross-under (for longs) or cross-over (for shorts), indicating a potential reversal.
Max Bars in Trades will act as a last-resort exit by simply calculating the amount of full bars the trade has been open, and exiting on the opening of the next bar. For example: the default value is 8 bars, so after 8 full bars in the trade, if no other exit has been triggered (Stop Loss, Take Profit, or MA Cross(if enabled)), then the trade will exit at the opening of the 9th bar.
Finally, there is a table displaying the amount of trades taken for each side, and the amount & percent of both early exits. This table can be turned off in the "Style" tab
ADDITIONAL PLOTS
MACD (Moving Average Convergence/Divergence):
- The MACD is an optional confirmation indicator for this strategy.
- Plotting the indicator is not necessary for the strategy to work, but it can be helpful to visually see the status and position of the MACD if this feature is enabled in the strategy
- This helps to identify if there is also momentum behind the entry signal

2 MA Cross Cvg Dvg Slope Overview
This indicator combines the Moving Average Convergence Divergence (MACD) and two Moving Averages (MAs) to assess market momentum and trend direction. It aims to provide insights into the strength and direction of price movements by analyzing the MACD line, MAs slopes, and MA crossovers. Instead of eyeballing the exact MA crossovers and MAs slope steepness on the chart and MACD line changes on separate panes, this indicator pixelate the overloaded information or multiple indicators interpretation into a KISS "boolean" decision making.
Key Components
MACD Line
This line represents the difference between the fast MA and slow MA. It reflects short-term price momentum relative to the long-term trend.
Moving Averages (MAs)
Two types of MAs are utilized in this indicator:
Fast MA (short-term): Often a 9-period MA or similar, which reacts quickly to price changes.
Slow MA (long-term): Typically a 21-period MA or similar, which smooths out price fluctuations and identifies the longer-term trend.
Indicator Logic
MA Crossover: The crossover of the fast MA above the slow MA suggests a bullish trend, while a crossover below indicates a bearish trend.
MA Slope Analysis: The indicator also considers the slopes of both the fast and slow MAs to determine the direction:
Both MA Positive Slope: Indicates upward momentum or bullish trend.
Both MA Negative Slope: Indicates downward momentum or bearish trend.
One MA Positive Slope, the other Negative Slope: Indicates indecision.
MACD Line: MACD Line consecutively increase means increasing positive momentum, vice versa.
Interpretation
Uptrend: When fast MA cross over slow MA. Indicator show "+" symbol at top zone with value 0.5.
Additional Uptrend Confirmation: When both MAs have positive slope. Indicator show only green bar.
Uptrend Upward Momentum: MACD Line increase when fast MA above slow MA. Indicator show "." symbol value 0.75.
Uptrend Downward Momentum: MACD Line decrease when fast MA above slow MA. Indicator show "." symbol value 0.25.
Indecision: When one of the MA has positive slope, but another MA has negative slope. Indicator showing both red and green bar.
Downtrend: When fast MA cross under slow MA. Indicator show "+" symbol at bottom zone with value 0.5.
Additional Downtrend Confirmation: When both MAs have negative slope. Indicator show only red bar.
Downtrend Upward Momentum: MACD Line increase when fast MA below slow MA. Indicator show "." symbol value -0.25.
Uptrend Downward Momentum: MACD Line decrease when fast MA below slow MA. Indicator show "." symbol value -0.75.
Combination of above multiple interpretation can further derive different signal for Trend Starts, Trend Continuous, and Trend Reversals.
Usage
This indicator is valuable for traders seeking to:
Identify entry and exit points based on single or multiple combination of MAs and MACD Line signals.
Confirm trend direction using MAs cross over or cross under spotted easily with the "+" symbol above 0 or below 0.
Double confirm the trend based on two MAs align slope direction.
Understand momentum shifts and potential trend reversals with an easy 4 different dots at -0.75, -0.25, 0.25, and 0.75.
Conclusion
By combining MACD Line analysis with Moving Average slopes and crossovers, this indicator offers a comprehensive approach to assessing market momentum and trend direction. It provides clear signals for traders to make informed decisions on when to enter or exit positions, enhancing overall trading strategy effectiveness without the need of referring to multiple chart or zoom in and out of the price chart to identify the crossover and slope direction.

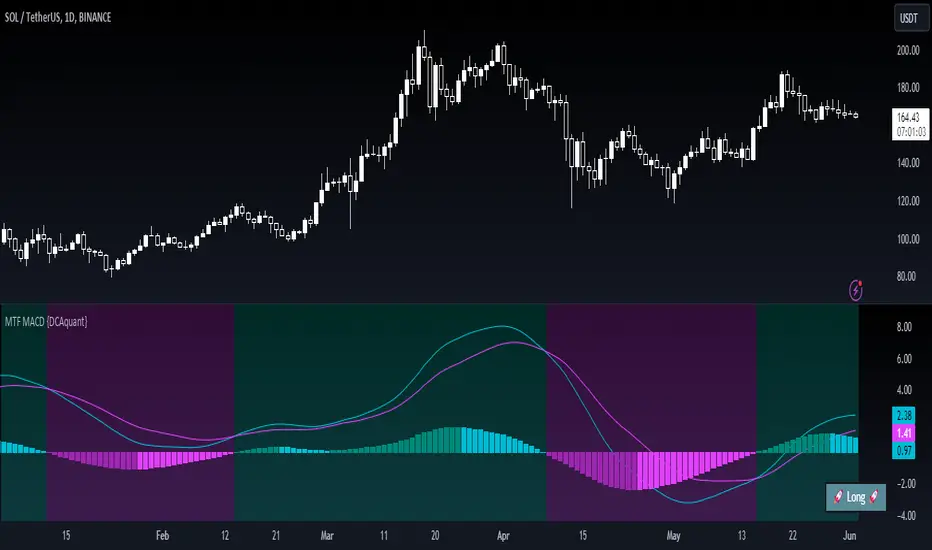
Multi Timeframe Moving Average Convergence Divergence {DCAquant}Overview
The MTF MACD indicator provides a unique view of MACD (Moving Average Convergence Divergence) and Signal Line dynamics across various timeframes. It calculates the MACD and Signal Line for each selected timeframe and aggregates them for analysis.
Key Features
MACD Calculation
Utilizes standard MACD calculations based on user-defined parameters like fast length, slow length, and signal smoothing.
Determines the difference between the MACD and Signal Line to identify convergence or divergence.
Multiple Timeframe Analysis
Allows users to select up to six different timeframes for analysis, ranging from minutes to days, providing a holistic view of market trends.
Calculates MACD and Signal Line for each timeframe independently.
Aggregated Analysis
Combines MACD and Signal Line values from multiple timeframes to derive a consolidated view.
Optionally applies moving average smoothing to aggregated MACD and Signal Line values for better clarity.
Position Identification
Determines the trading position (Long, Short, or Neutral) based on the relationship between MACD and Signal Line.
Considers the proximity of MACD and Signal Line to identify potential trading opportunities.
Visual Representation
Plots MACD and Signal Line on the price chart for visual analysis.
Utilizes color-coded backgrounds to indicate trading conditions (Long, Short, or Neutral) for quick interpretation.
Dynamic Table Display
Displays trading position alongside graphical indicators (rocket for Long, snowflake for Short, and star for Neutral) in a customizable table.
Offers flexibility in table placement and size for user preference.
How to Use
Parameter Configuration
Adjust parameters like fast length, slow length, and signal smoothing to fine-tune MACD calculations.
Select desired timeframes for analysis based on trading preferences and market conditions.
Interpretation
Monitor the relationship between MACD and Signal Line on the price chart.
Pay attention to color-coded backgrounds and graphical indicators in the table for actionable insights.
Decision Making
Consider entering Long positions when MACD is above the Signal Line and vice versa for Short positions.
Exercise caution during Neutral conditions, as there may be uncertainty in market direction.
Risk Management
Combine MTF MACD analysis with risk management strategies to optimize trade entries and exits.
Set stop-loss and take-profit levels based on individual risk tolerance and market conditions.
Conclusion
The Multi Timeframe Moving Average Convergence Divergence (MTF MACD) indicator offers a robust framework for traders to analyze market trends across multiple timeframes efficiently. By combining MACD insights from various time horizons and presenting them in a clear and actionable format, it empowers traders to make informed decisions and enhance their trading strategies.
Disclaimer
The Multi Timeframe Moving Average Convergence Divergence (MTF MACD) indicator provided here is intended for educational and informational purposes only. Trading in financial markets involves risk, and past performance is not indicative of future results. The use of this indicator does not guarantee profits or prevent losses.
Please be aware that trading decisions should be made based on your own analysis, risk tolerance, and financial situation. It is essential to conduct thorough research and seek advice from qualified financial professionals before engaging in any trading activity.
The MTF MACD indicator is a tool designed to assist traders in analyzing market trends and identifying potential trading opportunities. However, it is not a substitute for sound judgment and prudent risk management.
By using this indicator, you acknowledge that you are solely responsible for your trading decisions, and you agree to indemnify and hold harmless the developer and distributor of this indicator from any losses, damages, or liabilities arising from its use.
Trading in financial markets carries inherent risks, and you should only trade with capital that you can afford to lose. Exercise caution and discretion when implementing trading strategies, and consider seeking independent financial advice if necessary.
CAPACE MARKETThis custom indicator combines the Moving Average Convergence Divergence (MACD) and the Relative Strength Index (RSI) into a single trading tool. It calculates the MACD and RSI values, then averages these two indicators to create a composite line. This average line is intended to capture the momentum and relative strength of the market simultaneously, potentially offering a more nuanced view of market conditions.
Key features of the indicator include:
Visualization of MACD and RSI Lines: It plots the MACD and RSI values as separate lines on the chart, allowing traders to see the behavior of each indicator clearly.
Average Line: A line representing the average of the MACD and RSI indicators is plotted, providing a synthesized view of both momentum and strength.
Entry Points Indication: The indicator uses red dots to mark the points where the average line crosses over or under the MACD or RSI lines. These intersections are meant to signal potential entry points for traders.
Market Condition Highlighting: The background color changes based on whether the average line is above or below zero. A green background suggests a positive market condition (bullish), while a red background indicates a negative market condition (bearish).
This tool aims to offer traders an integrated perspective by combining the insights of both MACD and RSI, potentially aiding in the identification of entry and exit points as well as the overall market sentiment.
