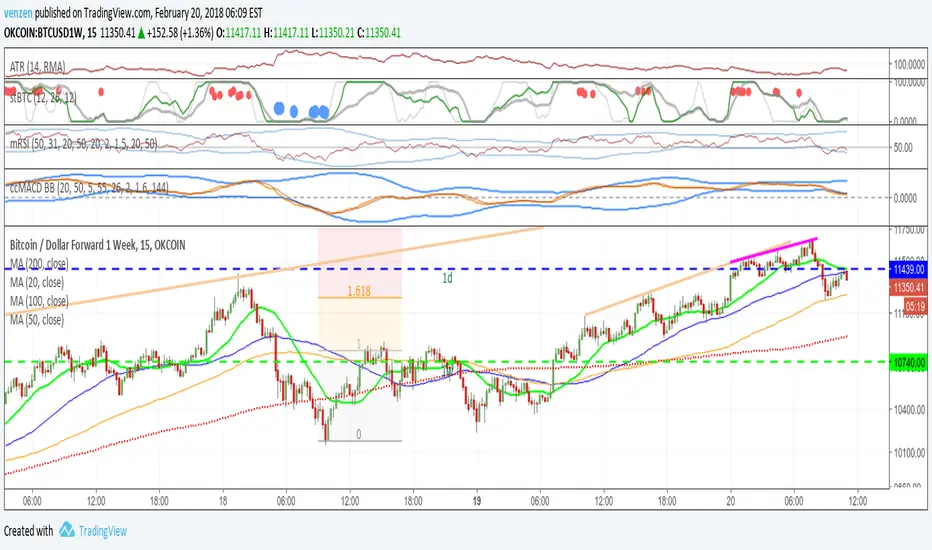
Dane: RSI MACD StrategyRSI / MACD Divergence Strategy . Published for customer verification and acceptance. Unfortunately, access can only be provided to the customer.
For those interested in custom development services, please visit the backtest-rookies (.com) website for more information.
Features
RSI & Price divergence detection
Open a trade window when trade conditions are met
Enter the trade on confirmation
Stop losses / take profit custom levels based of daily pivot values
Cerca negli script per "macd"

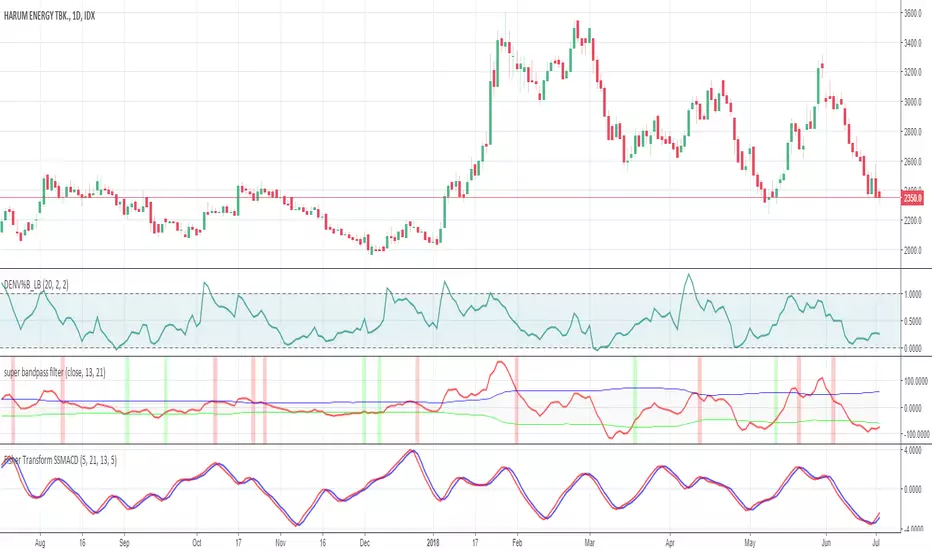
Fisher Transform SuperSmoothed MACD // This is a modification of Supersmoothed MACD (created by KIVANC using EHLERS' SUPER SMOOTHER FILTER) and sharpenned with Ehler fisher transform
//all lengths and parameters are completely configurable, tune the length according to your instrument
//give me what you think
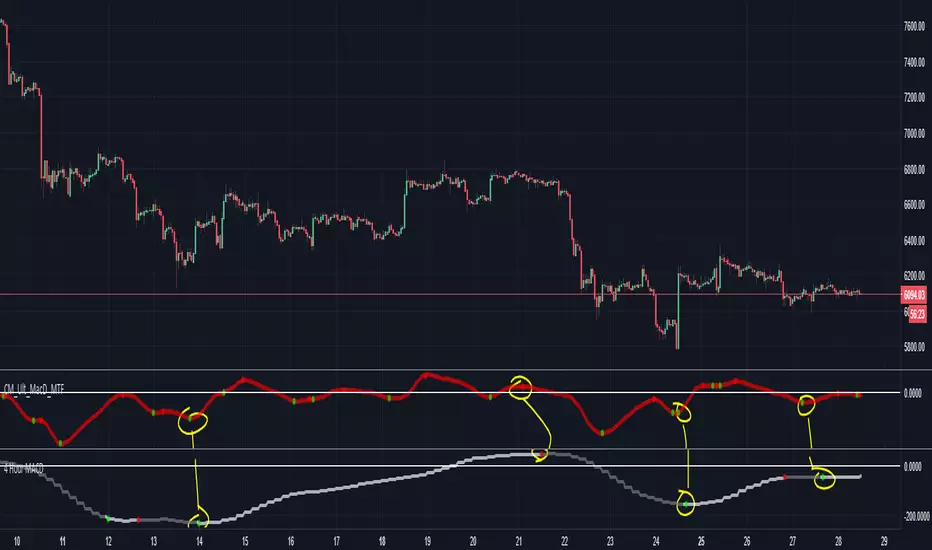
4 Hour MACD, Signal Line OnlyI call this my "anchor line" to show me the general direction of where bitcoin -0.51% is going on any given day.
Whether you are trading on 5m, 30m, 1h, this can provide you reinforcement for your directional bias (bullish/bearish)
I like to use this in place of a 50EMA or 200EMA to find the general direction of the trend, because it more precisely captures the fast rallies and dumps
Goes hand in hand with my "Dual Time Frame Momentum Strategy"
Disable the MACD line once you turn it on
Original credits go to ChrisMoody
stoch RSI-plus-macdThis stoch rsi plus , signal are based on rsi crossing at specific moments (green up) and sell based on stoch cross down (in red ) plus MACD to show the validity of the buy or sell points

MACD [Moving Average Convergence/Divergence]MACD rendered as candles to make it easier on the eyes. Candles are hollow when the MACD line moves opposite direction of the trend, which can signal a weakening trend.

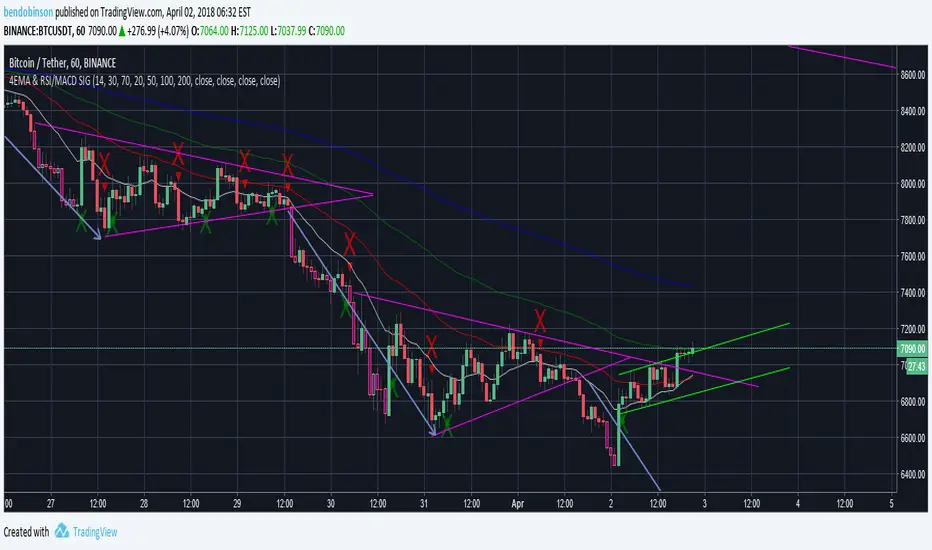
BD 4EMA RSI/MACD SIGNAL V1this chart allows 4 moving averages and gives a signal for macd cross over up and down as well as RSI oversold - purple - and overbought -yellow - all in 1 indicator.

Cryptocurrents MACD w/ Bollinger BandsThis indicator shows MACD and its Bollinger Bands. By default divergence and Bollinger Band width is also displayed.
To display only MACD, its signal line and Bollinger Bands, go to this indicator's "Settings" > "Style" and untick all unwanted features.
MACD DEMA with signalsMACD sinyal üretirken 10-15 dakikalık bir delay'e sahip. Hayırsever bir vatandaş MACD ile DEMA'yı birleştirerecek bu gecikmeyi nötr hale getirmiş. Ben de sinyalleri gösteren küçük noktalar ekledim
www.tradeciety.com
stockcharts.com

MACD DEMA with signalsMACD sinyal üretirken 10-15 dakikalık bir delay'e sahip. Hayırsever bir vatandaş MACD ile DEMA'yı birleştirerecek bu gecikmeyi nötr hale getirmiş. Ben de sinyalleri gösteren küçük noktalar ekledim
www.tradeciety.com
stockcharts.com

Ultra MACD [DW]This is a variation of Gerald Appel's MACD with seven moving average source types to choose from.
The MA types I've included in this script are:
- Kaufman's Adaptive Moving Average
- Geometric Moving Average
- Hull Moving Average
- Volume Weighted Moving Average
- Least Squares Moving Average
- Arnaud Legoux Moving Average
- Exponential Moving Average
Custom bar color scheme is included with two different colorization methods - one based on the MACD, and the other based on the histogram.

MACD represent up/down by green/red bars. MACD modified macd line to histogram and show up/down momentum by use green and red color.


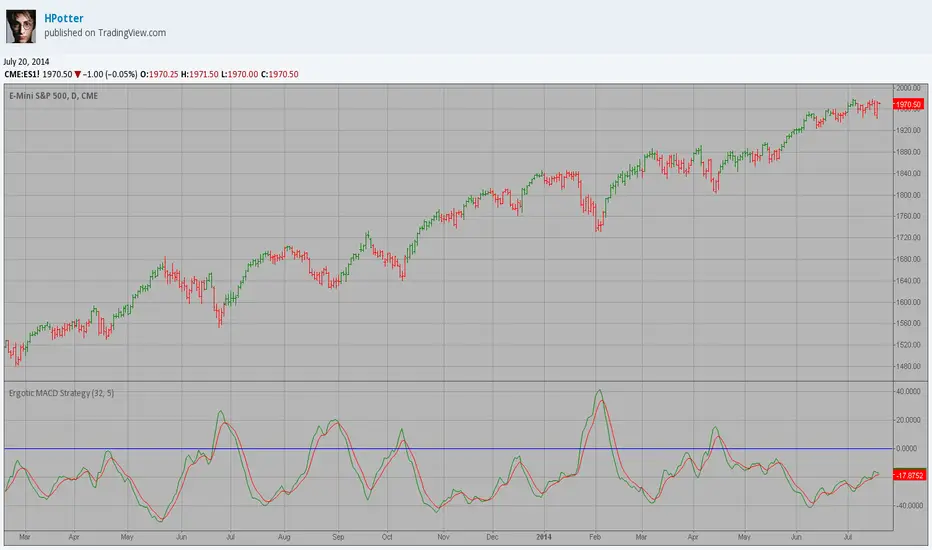
Ergotic MACD Strategy Backtest This is one of the techniques described by William Blau in his book
"Momentum, Direction and Divergence" (1995). If you like to learn more,
we advise you to read this book. His book focuses on three key aspects
of trading: momentum, direction and divergence. Blau, who was an electrical
engineer before becoming a trader, thoroughly examines the relationship
between price and momentum in step-by-step examples. From this grounding,
he then looks at the deficiencies in other oscillators and introduces some
innovative techniques, including a fresh twist on Stochastics. On directional
issues, he analyzes the intricacies of ADX and offers a unique approach to help
define trending and non-trending periods.
Blau`s indicator is like usual MACD, but it plots opposite of meaningof
stndard MACD indicator.
You can change long to short in the Input Settings
Please, use it only for learning or paper trading. Do not for real trading.

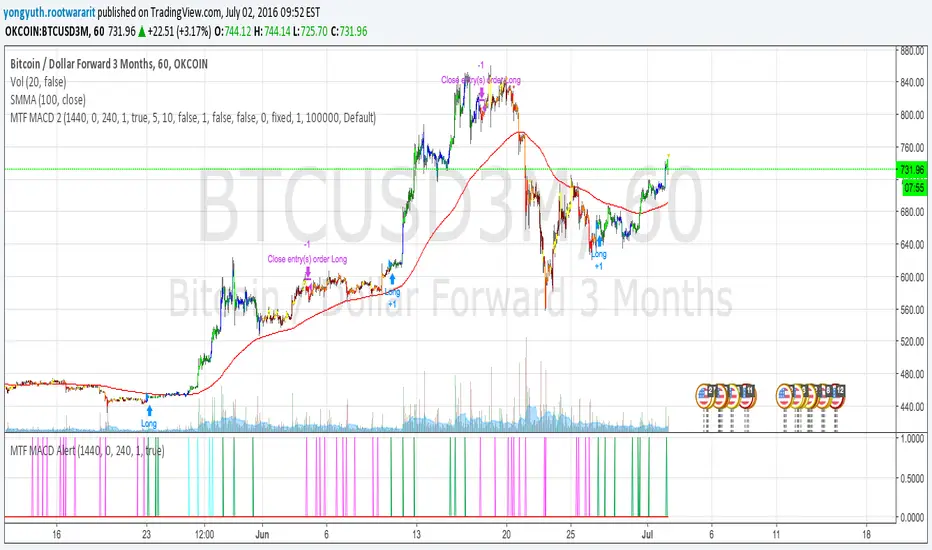
MTF MACD 2 By YuthavithiIf you want a good strategy without repaint. This one might be for you. Excellent profitable for BTCUSD3M for OKCoin.
It uses multiple time frame MACD for trading decision. To avoid repaint, set the delay period = 1 for both long term and midterm.
The idea is that, if long term, mid term and current time frame all agree on traidng direction, the trade will take place.
I also uses it in my automated trading bot with good result.
www.tradingview.com
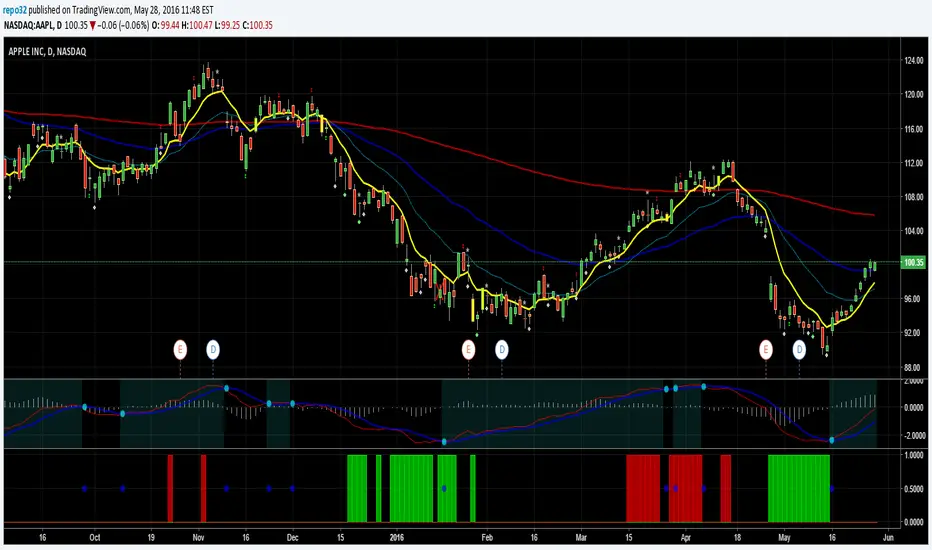
Rob RSI Stoch MACD Combo Alert//Created by Robert Nance on 5/28/16. Additional credit to vdubus.
//This was a special request from rich15stan. It combines my original RSI Stoch extremes with vdubus’ MACD VXI.
//This script will give you red or green columns as an indication for oversold/overbought,
//based upon the rsi and stochastic both being at certain levels. The default oversold is at 35.
//If Stochastic and RSI fall below 35, you will get a green column. Play with your levels to see how
//your stock reacts. It now adds the MACD crossover, plotted as a blue circle.
[RS]MACD Divergence V0EXPERIMENTAL:
MACD Divergence detection.
looks like macd is more prone for missing the extremes in price then the rsi due to lag.

Ergotic MACD Strategy This is one of the techniques described by William Blau in his book
"Momentum, Direction and Divergence" (1995). If you like to learn more,
we advise you to read this book. His book focuses on three key aspects
of trading: momentum, direction and divergence. Blau, who was an electrical
engineer before becoming a trader, thoroughly examines the relationship
between price and momentum in step-by-step examples. From this grounding,
he then looks at the deficiencies in other oscillators and introduces some
innovative techniques, including a fresh twist on Stochastics. On directional
issues, he analyzes the intricacies of ADX and offers a unique approach to help
define trending and non-trending periods.
Blau`s indicator is like usual MACD, but it plots opposite of meaningof
stndard MACD indicator.
Ergotic MACD This is one of the techniques described by William Blau in his book
"Momentum, Direction and Divergence" (1995). If you like to learn more,
we advise you to read this book. His book focuses on three key aspects
of trading: momentum, direction and divergence. Blau, who was an electrical
engineer before becoming a trader, thoroughly examines the relationship
between price and momentum in step-by-step examples. From this grounding,
he then looks at the deficiencies in other oscillators and introduces some
innovative techniques, including a fresh twist on Stochastics. On directional
issues, he analyzes the intricacies of ADX and offers a unique approach to help
define trending and non-trending periods.
Blau`s indicator is like usual MACD, but it plots opposite of meaningof
stndard MACD indicator.

MACD Divergence SystemMACD Divergence SystemMACD Divergence SystemMACD Divergence SystemMACD Divergence System

MACD + KD Crossover Strategy (20% TP/10% SL )MACD + KD Crossover Strategy is my first try in tradingview, so it have a lot of space to improve, every can give me suggestion.

MACD 4H Cross Above Zero AlertMACD 4H Cross the signal line to screen for stocks across a wide demo list

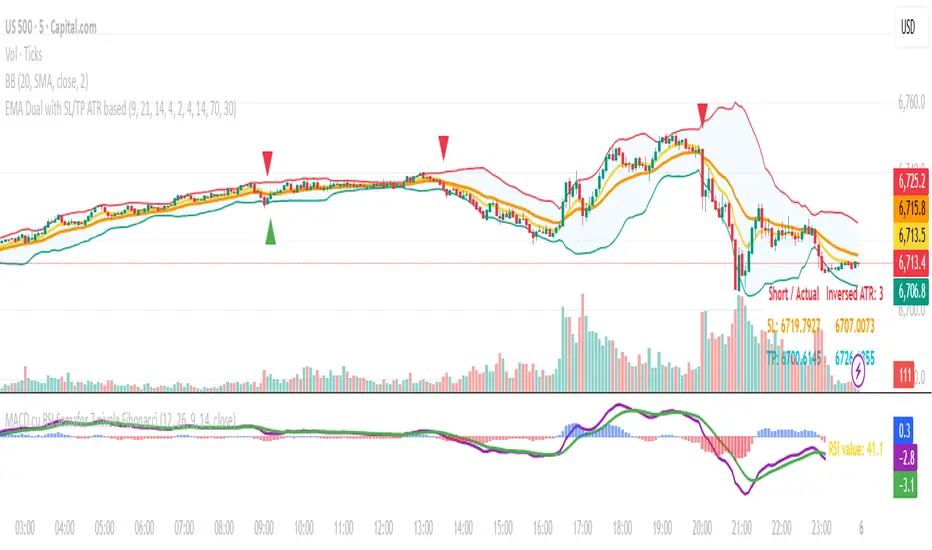
MACD cu RSI 7 Fibonacci color levelsMACD with RSI info
The RSI is display as value with changing color as Fibonacci levels.