MTF MACD + Accelerator Oscillator Strategy ※日本語説明は英文の下にあります。
Concept:
This is a multi-timeframe trend-following strategy that combines:
Higher timeframe MACD → determines the major trend direction.
Lower timeframe Accelerator Oscillator (AC) → identifies acceleration in momentum for optimal entry timing.
The strategy enters trades in the direction of the higher timeframe trend when the AC shows a momentum acceleration.
Entry Rules:
Long (Buy):
Higher timeframe MACD line > signal line (uptrend)
AC crosses above zero line on the lower timeframe
Short (Sell):
Higher timeframe MACD line < signal line (downtrend)
AC crosses below zero line on the lower timeframe
Exit Rules:
Take Profit: ATR(14) * 1.5 (configurable)
Stop Loss: ATR(14) * 1.0 (configurable)
Exit on opposite signal or if TP/SL is hit
Plotting:
AC is plotted on the chart (green for positive, red for negative)
Buy/Sell signals are marked with small triangles below/above bars
Customization:
Timeframe, MACD parameters, ATR multipliers can be adjusted in the input settings.
Works for scalping, day trading, or swing trading on various instruments.
---------------------------------------------------------------------
コンセプト:
この戦略はマルチタイムフレームのトレンドフォロー型で、以下を組み合わせています:
上位足MACD → 大きなトレンド方向を確認
下位足Accelerator Oscillator(AC) → モメンタム加速のタイミングを捉え、最適なエントリーを判断
上位足のトレンド方向に沿って、下位足でACが勢いの加速を示したタイミングでエントリーします。
エントリールール:
ロング(買い):
上位足MACDライン > シグナルライン(上昇トレンド)
下位足ACが0ラインを上抜け
ショート(売り):
上位足MACDライン < シグナルライン(下降トレンド)
下位足ACが0ラインを下抜け
エグジットルール:
利確:ATR(14) * 1.5(設定可能)
損切り:ATR(14) * 1.0(設定可能)
逆シグナル発生時やTP/SL到達時にも決済
チャート表示:
ACはチャート上にプロット(正なら緑、負なら赤)
買い/売りシグナルはバーの下/上に小さな三角で表示
カスタマイズ:
時間足、MACDパラメータ、ATR倍率は入力設定で変更可能
スキャルピング、デイトレード、スイングトレードなど幅広く利用可能
Cerca negli script per "mtf"


MTF EMA200 Dashboard (No Trend Column)Show ema200 position on multiple timeframe, so that in run time we can see price strength and weekness

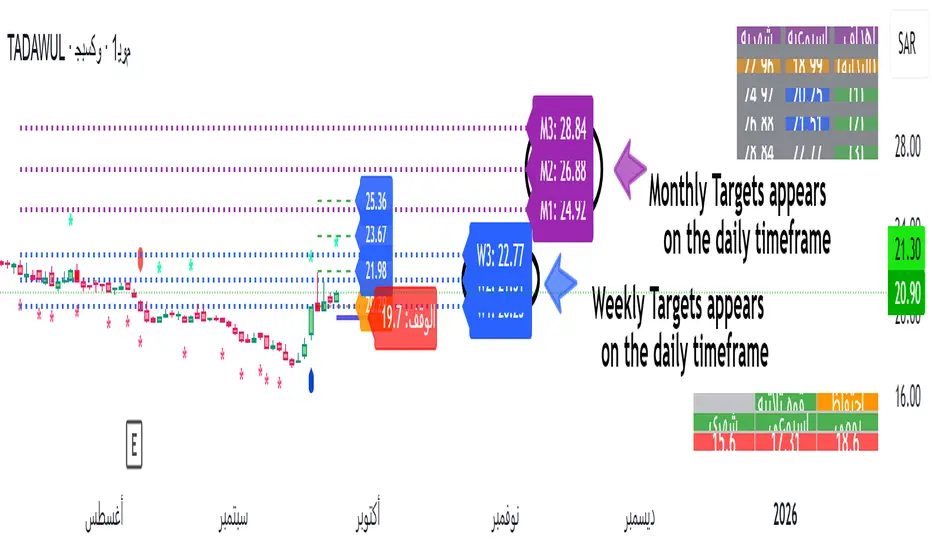
MTF POWER OF 3 TNF💻Types of Candlesticks in the Indicator
• Strong/Valid Candles: Identified by small asterisks below and above the candlestick body; Those with a body larger than 55% of the candle's total range.
• Tailed Candles: Are not marked by asterisks.
( onedrive.live.com)]! ( onedrive.live.com)
The General Idea of the Indicator's Signals
The indicator generates signals based on specific candlestick patterns. It identifies valid candlesticks (those with a body larger than 55% of the total candlestick range) and marks them with asterisks above and below the body. Candlesticks with significant tails (long wicks) that do not meet the criteria are not marked.
These signals help traders spot potential trend reversals or continuation patterns, depending on the context and location of the marked candles within the broader price action.
(onedrive.live.com)]! (onedrive.live.com)
Daily time frame conditions
( onedrive.live.com)]! ( onedrive.live.com)
Weekly and monthly time frame conditions
( onedrive.live.com)]! ( onedrive.live.com)
( onedrive.live.com)]! ( onedrive.live.com)
(onedrive.live.com)]! (onedrive.live.com)
(onedrive.live.com)]! (onedrive.live.com)
Best Trading Conditions
- Condition 1: (the best)
• Daily Timeframe: Buy
• Weekly Timeframe: Positive (Bullish)
• Monthly Timeframe: Positive (Bullish)
( onedrive.live.com)]- ! ( onedrive.live.com)
- Condition 2:
• Daily Timeframe: Buy
• Weekly Timeframe: Positive (Bullish)
• Monthly Timeframe: Negative (Bearish) (with the condition that monthly resistance is distant)
(onedrive.live.com)]- ! (onedrive.live.com)
- Confirmatory trend line
( onedrive.live.com)]- ! ( onedrive.live.com)
- Volume detection by candle colors;
- ! (onedrive.live.com)
MTF Stochastic Range FinderThis indicator compares Stochastic RSI from 2 timeframes to signal possible reversals. Default 5 minute and 2 minute. Both Stochastic RSIs are customizable.
Allows for 6 support/resistance lines and allows a tolerance to filter proximity to levels for entry.
Can filter price level by manual support/resistance levels and/or VWAP

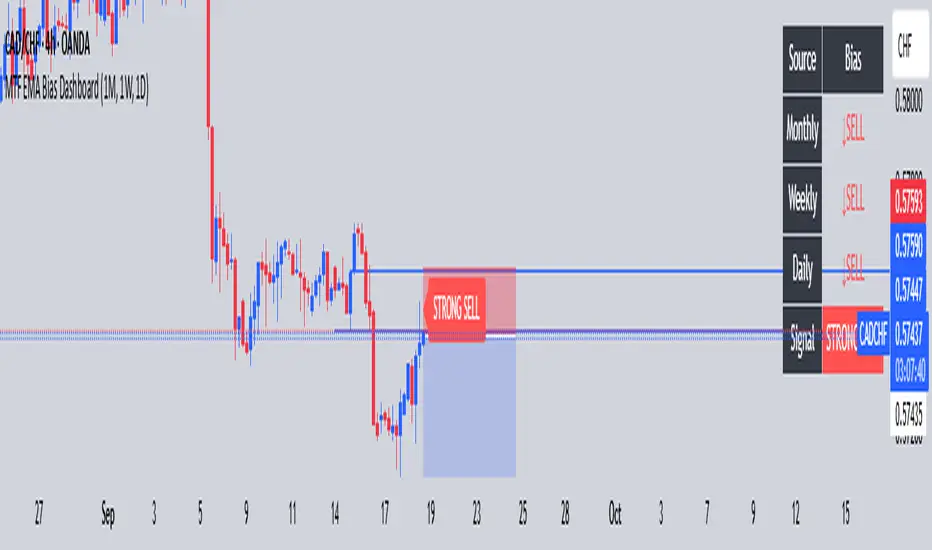
MTF-- K FOSU FX (1M, 1W, 1D)Quickly identify Weekly, Monthly, and Daily bias for stronger confluence
MTF Levels [OmegaTools]📖 Introduction
The Ω Levels Indicator is a complete market structure and level-mapping framework designed to help traders identify key zones where price is likely to react.
It blends classic technical anchors (VWAP, pivots, means, standard deviations) with modern statistical pattern recognition to dynamically project areas of manipulation, extension, and equilibrium.
At its core, Ω Levels creates an evolving map of market balance vs. imbalance, showing traders where liquidity is most likely to build and where price could pivot or accelerate.
But what makes it truly unique is the Pivot Forecaster — an embedded predictive engine that applies machine-learning inspired logic to recognize conditions that historically precede market turning points.
🔎 Key Features
Customizable Levels Framework
Define up to three levels (manipulation, extensions, VWAP, pivots, stdev bands, or prior extremes).
Choose mean references such as Open, VWAP, Pivot Mean, or Previous Session Mean.
Style controls (solid, dotted, dashed) and fill modes (internal, external, ranges) allow you to adapt the chart to your visual workflow.
Dynamic Zone Highlighting
Automatic fills between internal/external levels, or between specific level pairs (1–2, 1–3, 2–3).
Makes it easy to visualize value areas, expansions, and compression zones at a glance.
Multi-Timeframe Anchoring
Works on any timeframe, but calculations can be anchored to a higher timeframe (e.g., show daily VWAP & pivots on a 15m chart).
This allows traders to align intraday execution with higher timeframe context.
Pivot Forecaster (Machine Learning / Pattern Recognition)
This is the advanced predictive component.
The algorithm collects historical conditions observed around pivot highs and lows (volume state, ATR state, % candle expansion, oscillator conditions).
It then builds statistical “profiles” of typical pivot behavior and compares them in real-time against current market conditions.
When conditions match the “signature” of a pivot, the indicator highlights a Forecast Pivot High or Forecast Pivot Low (displayed as small diamond markers).
This functions as a pattern-recognition system, effectively learning from past pivots to anticipate where the next turning point is more likely to occur.
⚡ How Traders Can Use It
Intraday Execution: Use VWAP, manipulation, and extension levels to frame trades around liquidity zones.
Swing Context: Overlay higher timeframe pivots and means to guide medium-term positioning.
Fade Setups: Forecasted pivots often coincide with exhaustion zones where fading momentum carries edge.
Breakout Validation: When price breaks a structural level but the forecaster does not confirm a pivot, continuation probability is higher.
Risk Management: Levels provide natural stop/target placements, while pivot forecasts serve as warning signals for potential reversals.
⚙️ Settings Overview
Timeframe: Choose the anchor timeframe for calculations (default: Daily).
Means: Two selectable mean references (Open, VWAP, Pivot Point, Previous Mean).
Levels: Three levels can be customized (Manipulation, Extension, 1–2 StDev, Pivot Point, VWAP, Previous Extremes).
Fill Modes: Highlight zones between internal/external levels or custom ranges.
Visual Customization: Colors, line styles, fill opacity, and toggle for old levels.
Pivot Forecaster: Fully automated — no settings required, it adapts to instrument and timeframe.
🧭 Best Practices
Align Levels With Market Profile: Treat the levels as dynamic S/R zones and watch how price interacts with them.
Use Forecaster as Confirmation: The diamonds are not standalone signals; they are context filters that help you decide whether a move has higher reversal odds.
Higher Timeframe Anchoring: On intraday charts, set the timeframe to Daily or Weekly to trade with institutional levels.
Combine With ATR: Pair with the Ω ATR Indicator to size positions according to volatility while Ω Levels provides the structural roadmap.
📌 Summary
The Ω Levels Indicator is more than a level plotter — it’s a market map + predictive engine.
By combining traditional levels with an intelligent pivot forecaster, it gives traders both the static structure of where price should react, and the dynamic signal of where it is likely to react next.
This dual-layer approach — structural + predictive — makes it an invaluable tool for discretionary intraday traders, swing traders, and anyone who wants to anticipate price behavior instead of just reacting to it.

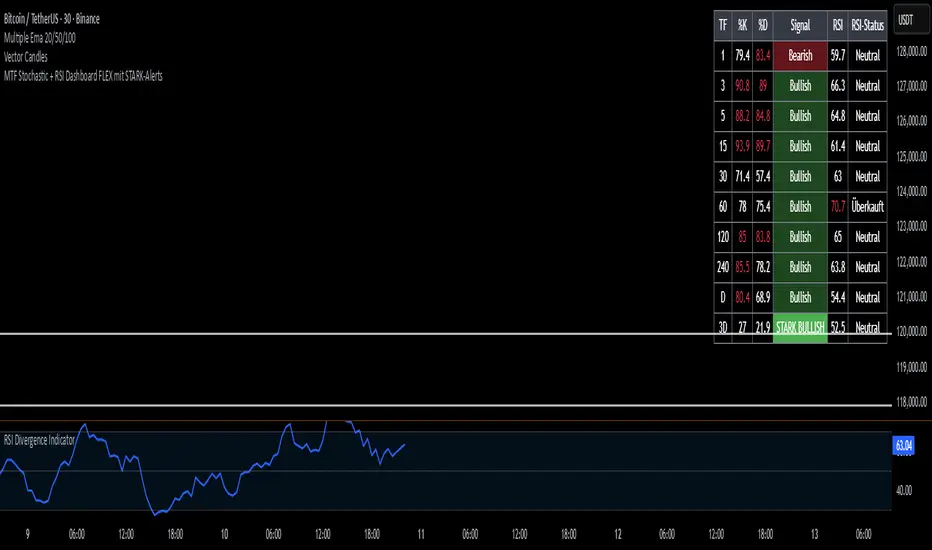
MTF Stochastic Dashboard What you see:
Top-right table: TF | %K | %D | Signal.
Signal = Bullish (green) if K > D, Bearish (red) if K < D.
Row color: red if K & D ≥ 80, green if K & D ≤ 20.
Number color: ≤30 green, ≥70 red.
Settings
Signal mode:
Always (just K>D or K
MTF Options Signals (message-free)script made to help with options profitability. made using ai to increase portfolio profitability
MTF FVG Confluence v6 — JSON Alerts via alert()This strategy combines multi-timeframe confluence with candlestick analysis and fair value gaps (FVGs) to generate structured long/short entries. It aligns Daily and 4H EMA trends with 1H MACD momentum, then confirms with engulfing candles and FVG zones for precision entries. Risk management is built-in, featuring stop-loss, 3R take-profit targets, and optional break-even logic, with dynamic JSON alerts for webhook automation.
Categories:
Candlestick analysis
Chart patterns
Cycles

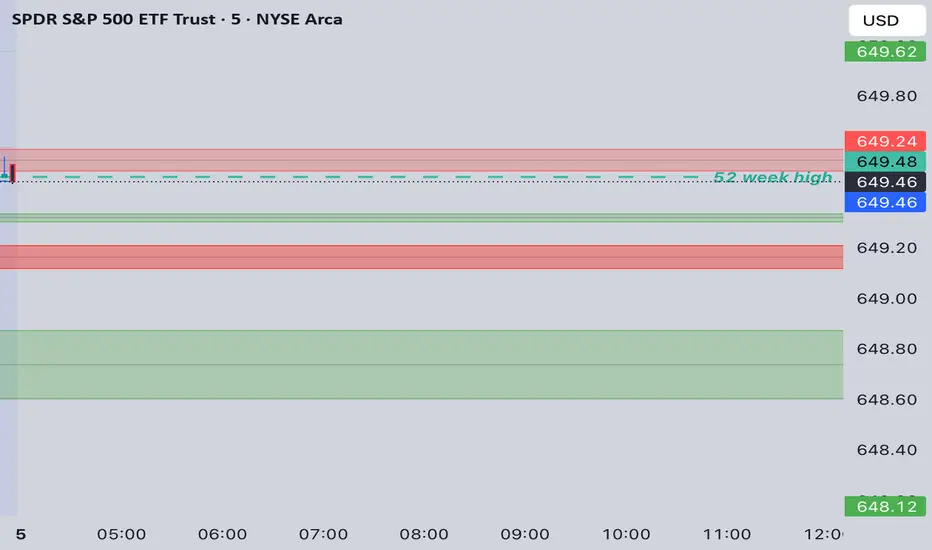
MTF Last Closed Highs & LowsThis indicator plots the most recent closed high and low levels from multiple timeframes (4H, Daily, Weekly, Monthly, etc.) directly on your chart. It helps traders quickly spot key support and resistance zones, track market structure across different timeframes, and identify breakout or reversal opportunities.

MTF RSI + ADX + ATR SL/TP vivekDescription:
This strategy combines the power of multi-timeframe RSI filtering with ADX trend confirmation and ATR-based risk management to capture strong directional moves.
🔑 Entry Rules:
• Daily RSI > 60
• 4H RSI > 60
• 1H RSI > 60
• 10m RSI > 40
• ADX (current timeframe) > 20
When all conditions align, a long entry is triggered.
🛡 Risk Management:
• ATR-based Stop-Loss (customizable multiplier)
• Take-Profit defined as a Risk-Reward multiple of the ATR stop
🎯 Why this Strategy?
• Ensures alignment across higher timeframes before entering a trade
• Uses ADX to avoid choppy/range-bound markets
• Built-in ATR stop-loss & take-profit for disciplined risk control
• Fully customizable parameters
This strategy is designed for trend-following swing entries. It works best on liquid instruments such as indices, forex pairs, and large-cap stocks. Always optimize the parameters based on your preferred asset and timeframe.

MTF RSI + ADX + ATR SL/TPThis strategy combines the power of multi-timeframe RSI filtering with ADX trend confirmation and ATR-based risk management to capture strong directional moves.
🔑 Entry Rules:
• Daily RSI > 60
• 4H RSI > 60
• 1H RSI > 60
• 10m RSI > 40
• ADX (current timeframe) > 20
When all conditions align, a long entry is triggered.
🛡 Risk Management:
• ATR-based Stop-Loss (customizable multiplier)
• Take-Profit defined as a Risk-Reward multiple of the ATR stop
🎯 Why this Strategy?
• Ensures alignment across higher timeframes before entering a trade
• Uses ADX to avoid choppy/range-bound markets
• Built-in ATR stop-loss & take-profit for disciplined risk control
• Fully customizable parameters
This strategy is designed for trend-following swing entries. It works best on liquid instruments such as indices, forex pairs, and large-cap stocks. Always optimize the parameters based on your preferred asset and timeframe.

MTF 200MULTI TIME FRAME 200MA
TIMEFRAME
1m 5m 15m 30m 60m 240m 1D
200 SMA
Check the chart for 200ma you were looking at a candle at a certain time

MTF Clean Panelsit is bigger model of a earlier model then i have made earlier it helps you see multiple timeframes together and includes more daily timeframe and have also been introduced a new 4 hours candle structure

MTF EMA Pane with Diagnostics30 sec chart, 1 min EMA goes flat, I buy, 1 min EMA stays inside the group, I stay in the trade.
Not financial advice. I am working on an Algo killer, stay tuned. I am dedicating the rest of my life, as short as it my be, to beating the Men behind the Algo's. Buy me some coffee.
Send USDT thru ETH or Base to BYDFi 0x20391e32afd61dc9e1ec027651391b56ceade4e0
Join BYDFi
Referral Link: Spin for a possible $100
partner.bydfi.com
Deposit: USDT via;
ETH (ERC20) 0x20391e32afd61dc9e1ec027651391b56ceade4e0
Tron (TRC20)
TUs5u2YxtQrQfRwYK2CsMmSDGvND6Uopdj
BNB/Base (BEP20)
0x20391e32afd61dc9e1ec027651391b56ceade4e0
Solana
696LAngiQBbdk4m6k1ZBiKZrFtjTJo6dxCnVXMEePQea

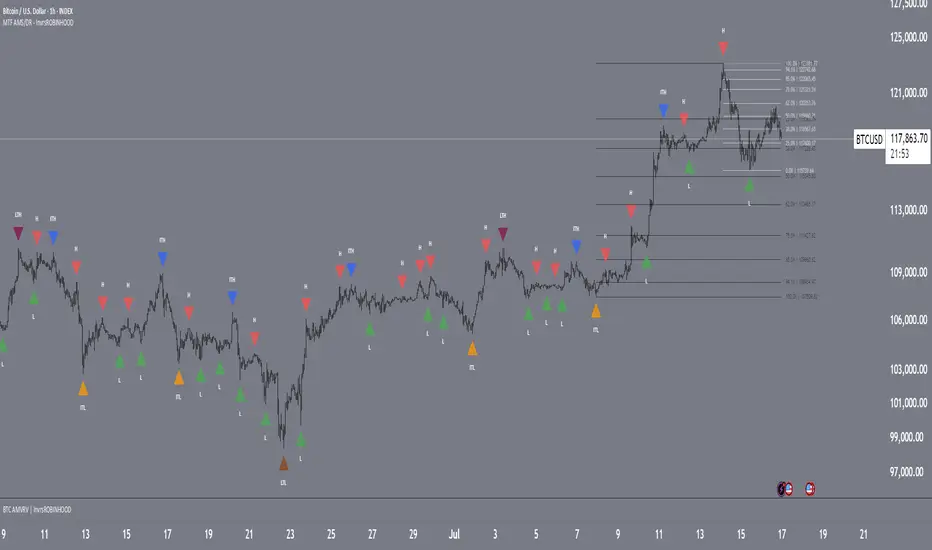
MTF Market Structure Pivots/Dealing Ranges | InvrsROBINHOODMulti-Timeframe Advanced Market Structure Pivots - Dealing Ranges | InvrsROBINHOOD
This indicator provides a sophisticated framework for analyzing market structure by identifying and classifying key pivot points on the user defined higher timeframes. It automatically draws the most relevant bullish and bearish dealing ranges based on this structure, equipping traders with a clear and objective view of the market's flow and potential areas of interest whilst on the lower timeframes.
Understanding Market Structure
At its core, market structure is the sequence of highs and lows that form the trend. This indicator demystifies market structure by categorizing pivots into a three-tiered hierarchy, allowing you to instantly gauge the significance of a swing point.
The Hierarchy of Pivots
Short Term Highs (H) & Lows (L)
These are the most basic swing points in price action, representing minor, localized turning points. They are the fundamental building blocks of all larger trends and structures. While common, they help define the immediate price action and short-term directional bias.
Intermediate Highs (ITH) & Lows (ITL)
An Intermediate High (ITH) is a short-term high that is higher than the short-term highs immediately preceding and succeeding it. Similarly, an Intermediate Low (ITL) is a short-term low that is lower than its neighboring lows.
Importance: These pivots are significantly more important than standard H/L points. They represent a more substantial shift in supply and demand and often mark the beginning or end of a corrective wave within a larger trend. A break of an ITH or ITL suggests a potential change in the intermediate-term trend.
Long Term Highs (LTH) & Lows (LTL)
These are the most critical pivots identified by the indicator. A Long Term High (LTH) is an intermediate high that is higher than the intermediate highs on either side of it. A Long Term Low (LTL) is an intermediate low that is lower than its neighboring intermediate lows.
Importance: LTH and LTL points represent major structural anchors. They often define the boundaries of long-term trading ranges, mark the conclusion of major market cycles, or signal a significant trend reversal. A price break beyond an LTH or LTL is a powerful confirmation that the long-term market structure has shifted.
By understanding this hierarchy, a trader can better assess the strength of a trend. For example, in a strong uptrend, price will consistently form higher L's, IPL's, and LTL's. A break of a key ITL would be the first major warning sign that the dominant bullish structure is in jeopardy.
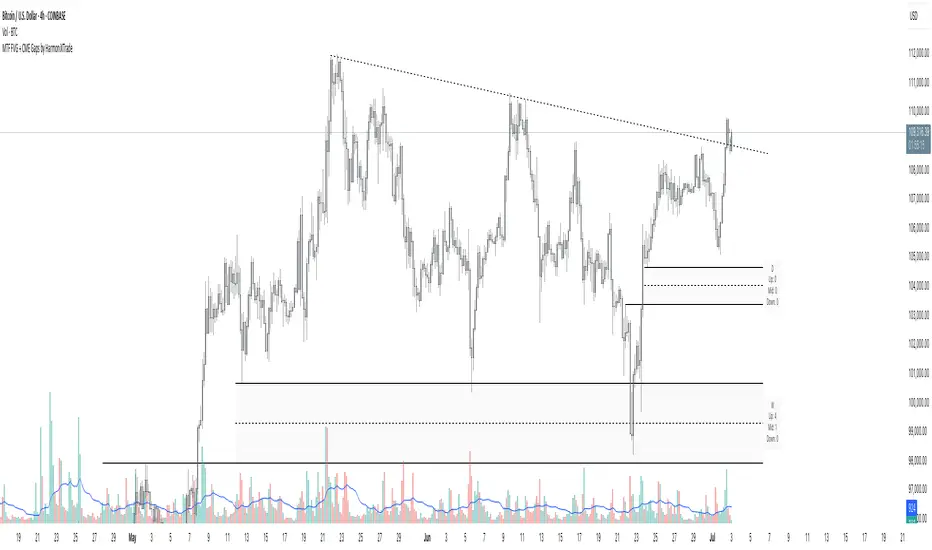
The Dealing Range: Fibonacci Analysis
Beyond identifying pivots, the indicator's primary function is to establish the current Dealing Range. A dealing range is the price zone between a significant structural pivot and the subsequent impulse move away from it. The indicator uses a proprietary scoring system to objectively identify the most probable and "protected" high or low to anchor these ranges.
How to Use the Dealing Ranges
The indicator will plot two potential dealing ranges, one bullish and one bearish, complete with key Fibonacci retracement levels.
Bullish Dealing Range (Black):
This range is drawn from a significant low (the anchor) up to the highest high formed after that low.
Application: This range highlights potential "discount" buying opportunities. When price pulls back from the high, the Fibonacci levels (e.g., 50%, 61.8%, 78.6%) serve as high-probability zones where buyers may step in to resume the upward trend. The original low of the range is the ultimate invalidation point for this bullish idea.
Invalidation: The bullish range is considered complete and will be removed if the price breaks above the high of the range, as the market has shown its intention to continue higher. The indicator will then seek to establish a new range.
Bearish Dealing Range (White):
This range is drawn from a significant high (the anchor) down to the lowest low formed after that high.
Application: This range identifies potential "premium" selling opportunities. As price rallies from the low, the Fibonacci levels act as potential resistance zones where sellers may re-emerge to continue the downward trend. The original high of the range is the ultimate invalidation for this bearish scenario.
Invalidation: The bearish range is considered complete and will be removed if the price breaks below the low of the range, signaling a continuation of the downtrend. The indicator will then await a new structure to form.
By combining a hierarchical understanding of market structure with automatically drawn Fibonacci dealing ranges, this tool helps traders to objectively identify the trend, frame high-probability trade ideas, and manage risk with clearly defined levels of interest and invalidation.
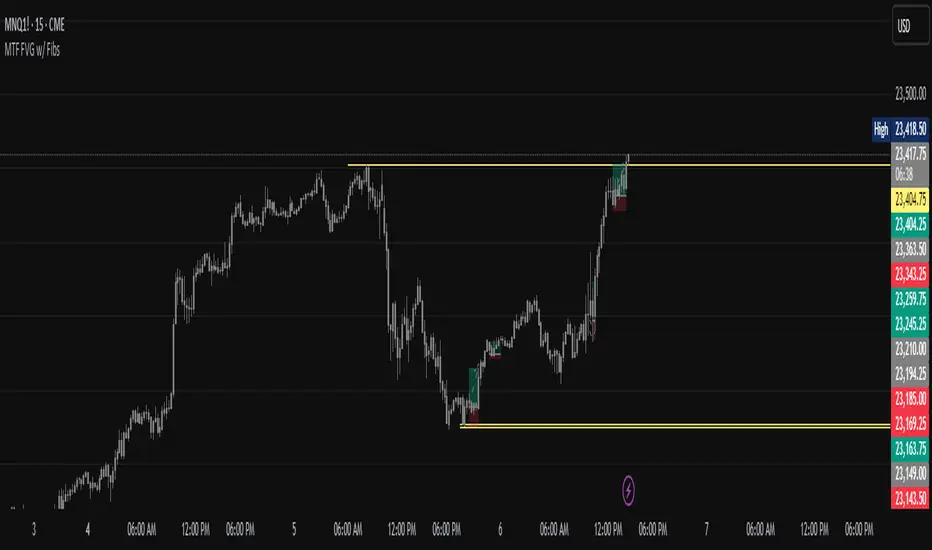
MTF FVG with Hit Counter HarmoniXTradeMain Purpose of the Indicator:
This indicator is designed to automatically identify Fair Value Gaps (FVG) across three different timeframes simultaneously. The primary goal is to display these key zones on the chart and provide detailed information about price interaction with these levels, enabling traders to make more informed decisions.
Key Features:
Multi-Timeframe FVG Identification:
By default, the indicator identifies and displays FVGs on the Weekly (W), Daily (D), and 4-Hour (240) timeframes.
Users can customize these timeframes in the settings to fit their preferences.
Detailed Hit Counter:
This indicator goes beyond simply showing FVGs; it accurately counts the number of times the price has touched each of the three key FVG levels:
Up: The top line of the FVG
Mid: The midline (equilibrium) of the FVG
Down: The bottom line of the FVG
This information is displayed in a clear label next to each FVG zone, helping traders assess the strength and validity of each level.
Extensive Customization:
Appearance: You can change the colors for bullish and bearish FVGs for each timeframe individually, modify the style of the main and mid lines, and adjust the label size.
Detection Logic: Users can define the minimum size of an FVG for detection based on a percentage or point value.
Mitigation Logic: Two methods are provided for FVG invalidation:
Percentage Mitigation: The FVG is considered mitigated after the price has penetrated it by a specific percentage (e.g., 50%).
Full Fill: The FVG remains valid until the price has completely filled the gap and closed beyond it.
Extend Lines Capability:
To prevent chart clutter and get a better view of future price action, you can extend the FVG lines and labels to the right by a specified number of bars, creating distance from the current candle.
How to Use This Indicator:
Identifying Support and Resistance Zones: FVG areas can act as strong support and resistance levels.
Confirming Entry Points: A price touch and reaction to one of the FVG levels (especially the midline) can be used as a confirmation for entering a trade.
Assessing Level Strength: The number of hits on each level (Up, Mid, Down) indicates which price point within the zone has been more attractive to the market. For example, repeated reactions to the top line of a bearish FVG might suggest strong selling pressure at that level.
Your Feedback for Improvement:
You are invited to use this indicator and share any suggestions, ideas for improvement, or reports of potential issues. Your feedback will be valuable for implementation in future versions.
MTF - Quantum Fibonacci ATR/ADR Levels & Targets V_2.0# Quantum Fibonacci Wave Mechanics v2.0 Release Notes
## 🚀 New Features
- Added multi-timeframe alert system for buy/sell signals
- Implemented dynamic label management with price values
- New mid-level trigger option for additional signals
- New EMA trigger option for confirmation signals
- Signal bar highlighting option
- Customizable line widths for all levels
## 🎨 Visual Improvements
- Completely redesigned label system (left-aligned with offsets)
- More intuitive input organization
- Better color customization options
## ⚙️ Technical Upgrades
- Upgraded to Pine Script v6
- Reduced repainting with stricter confirmation checks
- Optimized performance with proper variable initialization
## ⚠️ Note for Existing Users
- Some color parameters have been renamed
- Label positioning has changed (now with configurable offset)
- Review new mid-level trigger option in strategy settings
## 🐛 Bug Fixes
- Fixed potential repainting issues in signal generation
- Improved label cleanup between periods
- More robust security function implementation
## ⚠️ Caution for Mid-Level & EMA Signals
- Mid-Level Reversals may trigger premature entries in ranging markets.
- EMA crossovers can lag; confirm with price action.

MTF Trend + Crossover AlertsMulti-Timeframe Trend Dashboard + Crossover Signals
This indicator provides a clean, real-time visual dashboard of trend directions across multiple timeframes (1m, 5m, 15m, 30m, 1H, 4H, 1D), based on moving average crossovers.
🔹 Trend Detection Logic:
When the fast MA is above the slow MA → Bullish trend 🚀
When the fast MA is below the slow MA → Bearish trend 🐻
When both are equal or ranging → Neutral
📊 Dashboard Features:
Displays trend status for each selected timeframe
Color-coded cells (green = bullish, red = bearish, gray = neutral)
Includes emojis for visual clarity
🔔 Buy/Sell Alerts:
On the active chart timeframe, buy and sell signals are plotted when the fast MA crosses above or below the slow MA. You can also enable TradingView alerts based on these events.
🧩 Customizable Inputs:
Fast MA period
Slow MA period
MA type (EMA or SMA)
🔧 Ideal for traders who want a quick snapshot of market structure across multiple timeframes and receive real-time crossover signals on their current chart.

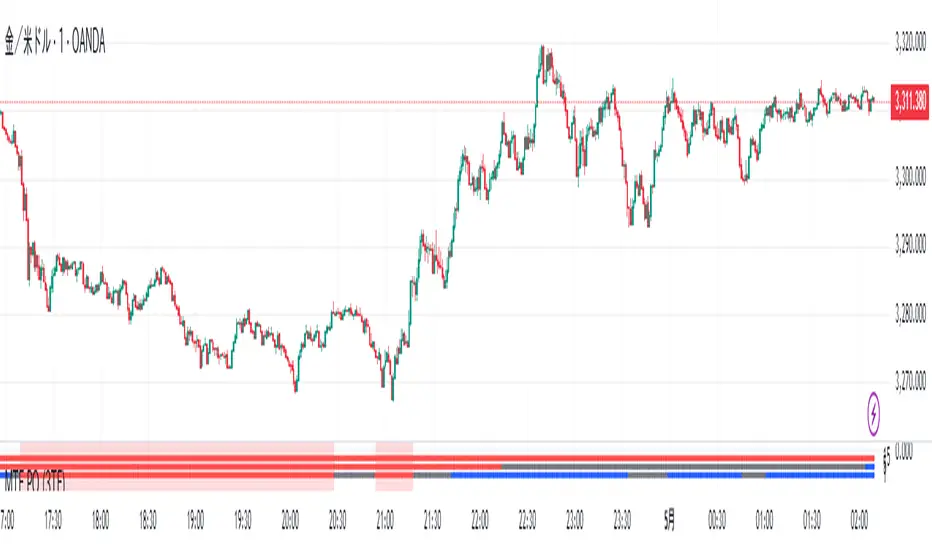
MTF PO (3TF)Title: SmartMA Multi-Timeframe Signal Strategy
Description (English):
This indicator provides buy/sell signals based on a multi-timeframe adaptive moving average. It allows traders to align short-term entries with higher time-frame trends. The script integrates a trend-following logic that reacts to price crossovers and adaptive MA slope, helping traders reduce noise and improve entry precision.
概要(日本語)
このインジケーターは、複数時間足の適応型移動平均線(SmartMA)を用いて売買シグナルを生成します。下位足でのエントリーが、上位足のトレンドと一致するよう設計されており、ノイズの除去とトレード精度の向上に貢献します。価格のクロスとMAの傾きを用いたトレンドフォロー型ロジックを搭載しています。
特徴
上位時間足の移動平均(SmartMA)と価格のクロスを検出
傾きフィルターによるトレンド整合性チェック
上位足に合わせて下位足のシグナルを制限
チャート上にシンプルなBuy/Sellラベルを表示
EMA, SMA, RMAなどのカスタム選択が可能
使用方法
チャートにインジケーターを追加し、上位足(例:1時間)と現在の時間足(例:5分)を設定
トレンド方向に沿ったタイミングでエントリーを検討
複数フィルターを用いることで、レンジ相場での誤認識を回避可能
注意事項
本インジケーターは補助的な分析ツールです。過去のパフォーマンスが将来を保証するものではありません。
スクリプトは再描画しない設計ですが、時間足の切り替え等で見た目が変わる可能性があります。
戦略構築には他のリスク管理指標との併用を推奨します。
MTF TRIX Divergence Pro: Hidden & Regular Pattern DetectionTRIX Divergence Pro: Multi-Timeframe Analysis with Hidden & Regular Pattern Detection
📊 This TRIX indicator with extended features enables you to analyze price action across multiple timeframes with divergence detection capabilities.
🔍 Multi-Timeframe Analysis
View TRIX simultaneously across three timeframes:
• Current Timeframe - For primary analysis
• Higher Timeframe - To identify the overall market trend
• Lower Timeframe - For precise entry timing
🔮 Divergence Detection
This indicator identifies four types of divergences:
• Regular Bullish Divergence (Yellow) ⬆️
Price makes lower lows but TRIX makes higher lows
Indication: Potential end of downtrend
• Regular Bearish Divergence (Blue) ⬇️
Price makes higher highs but TRIX makes lower highs
Indication: Potential end of uptrend
• Hidden Bullish Divergence (Green) ↗️
Price makes higher lows but TRIX makes lower lows
Indication: Potential buying opportunity during price correction
• Hidden Bearish Divergence (Red) ↘️
Price makes lower highs but TRIX makes higher highs
Indication: Potential selling opportunity during temporary price recovery
⚙️ Advanced Features
• Smart scoring system to filter out weak signals
• Customizable timeframe display (current, higher, lower, or all)
• Divergence detection on TRIX signal line
• Option to show only the last divergence to reduce chart clutter
• Adjustable divergence line thickness and style
• Minimum price and oscillator deviation filters to reduce noise
📈 Trading Strategies
“Trend Surfing” Strategy 🌊
• Use higher timeframe TRIX to identify the main trend
• Wait for a price correction in the trend direction
• Look for hidden divergence on the current timeframe
• Enter when price may resume in the main trend direction
“Trend Reversal Hunter” Strategy 🔄
• Identify regular divergence on the current timeframe
• Confirm it with regular divergence on the higher timeframe
• Wait for TRIX to cross its signal line
• Consider a counter-trend position with proper risk management
⚡ Recommended Settings
Balanced Profile 🔋
• TRIX Length: 17
• Signal Length: 14
• Pivot Period: 5
• TRIX Display: CURRENT+UPPER
• TRIX Divergence: CURRENT+UPPER
• Min Bars Between Divs: 10
• Min Div Strength: 1.5
• Use Scoring System: yes
• Min Score: 3.5
Trend Following Profile 🧭
• TRIX Length: 21
• Signal Length: 17
• Pivot Period: 6
• TRIX Display: CURRENT+UPPER
• TRIX Divergence: CURRENT+UPPER
• Min Bars Between Divs: 8
• Min Div Strength: 1.2
• Use Scoring System: yes
• Min Score: 3.0
Scalping Profile 🔍
• TRIX Length: 9
• Signal Length: 6
• Pivot Period: 3
• TRIX Display: CURRENT+LOWER
• TRIX Divergence: CURRENT+LOWER
• Min Bars Between Divs: 5
• Min Div Strength: 0.8
• Use Scoring System: no
• Last Divergence: yes
💡 Practical Tips
• “Stacked” divergences across multiple timeframes may provide stronger potential signals
• Consider using hidden divergences for trend trades and regular divergences for reversals
• When TRIX crosses zero in the higher timeframe, it may suggest a significant trend change
• Thicker divergence lines = potentially stronger signals (automatically displayed)
• In choppy markets, increase the minimum divergence strength to help filter out false signals
• Always combine indicator signals with other forms of analysis and confirmation
⚠️ Risk Disclaimer
Trading involves risk. This indicator provides analysis tools but cannot guarantee profitable trades. Past performance is not indicative of future results. Users should combine this indicator with proper risk management and their own analysis. Financial markets lack certainty, and each user is responsible for their trading decisions.
Trade responsibly.
