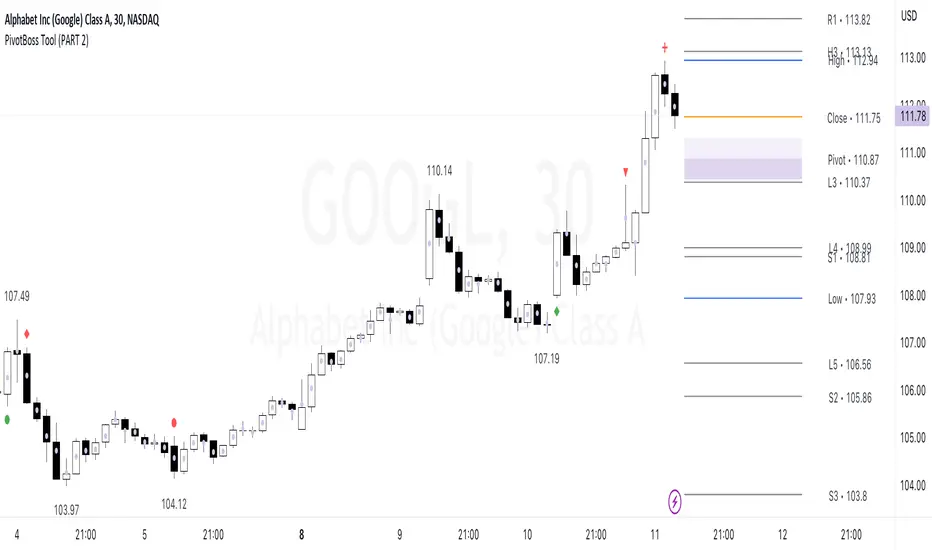
PivotBoss Tool (PART 2)Hello Everyone,
This indicator is being published on TradingView to help traders solve their multiframe EOD analysis issue and at the same time get additional information of other crucial information - CandleStick Patterns, Candlestick Midpoint and ATR Trails for trailing your SL's all under one single frame.
This indicator is based on the concepts of Secrets of Pivot Boss by Mr.Frank Ochoa and strives to provide more insightful information of pivot points and other general indicators being used by traders on day-to-day basis in the simplest format possible so that traders of all kinds can relate to the same.
And, this is purely dedicated to EOD analysis.
What is the moat of this Indicator?
This particular indicator is designed to help the traders in their EOD analysis as this indicator is well equipped to provide the next session trading pivot points well in advance at the end of the current day trading session. A trader has everything required for an EOD analysis in this particular indicator.
Below is the brief information of the indicator table you see in the layout of the above chart -
#Next Session Pivots
One can plot this feature to find out the developing pivot levels for upcoming D/W/M/Q/Y alongside it's additional pivot levels such as:
- Future Camarilla Pivots (H3/H4/H5 & L3/L4/L5)
- Future Floor Pivots (R1/R2/R3 & S1/S2/S3)
- Future CPR levels (TC/PIVOT/BC)
#Developing Pivot Cloud
One can check the developing CPR in Intraday itself by enabling the pivot cloud feature which can tell you multiple information to be with the trend and it's participants.
Basically a live extension of the current trading CPR according with the progress of the trading day.
#CandleStick Mid-Point
This can plot the midpoint of each candlestick on any timeframe for better understanding of buyer/seller's absorption!
#Candlestick Pattern Scans
So one can now easily filter out the candlesticks patterns which helps in decoding the chart in a better format for entry and exits. There are 4 candlesticks patterns included -
- Wick Reversal Pattern -
This pattern basically tells the wick strength which is actually a liquidity absorption by the stronger hand and the intensity and further direction of the move depends on the position of wick candle being formed indicated by green (bull) or red (bear) signal.
- Doji Reversal Pattern -
This pattern basically is used to identify the biasness of the market participants and further identifies a pause in the ongoing trend or a pause for the trend to get further liquidity for broader strength.
- Outside Reversal Pattern -
This pattern depicts the range of the previous candle of a specific timeframe has been tested at both the extreme and probably the price will consolidate in the that visible range for a while.
- Extreme Reversal Pattern -
This pattern basically points at a setup that looks for an extreme pattern of selling pressure and then looks to fade this behavior to capture a bullish move higher (reverse for shorts) and vice versa .
#ATR Trails
This a just a supertrend indicator sourced with ATR to track a short/long term trend change and can be used for trailing SL's when they are kept tight for big positions!
#CPR Trails
This is the most interesting feature with multiple permutations & combinations and can be used to analyse intraday as well as EOD and positional trends. Moreover, THIS FEATURE CAN ALSO INDENTIFY MICRO INTRADAY TREND AS SMALL AS EACH 5M TREND!!
This indicator will be updated with time and depending on community's feedback and requirements.
Credits -
- Mr. Frank Ochoa (Concepts and ideas from the book 'Secrets of PivotBoss' )
- TradingView (Providing a platform to traders to simply their trading through 'PineScript')
Regards,
Mukkull
Cerca negli script per "pivot"
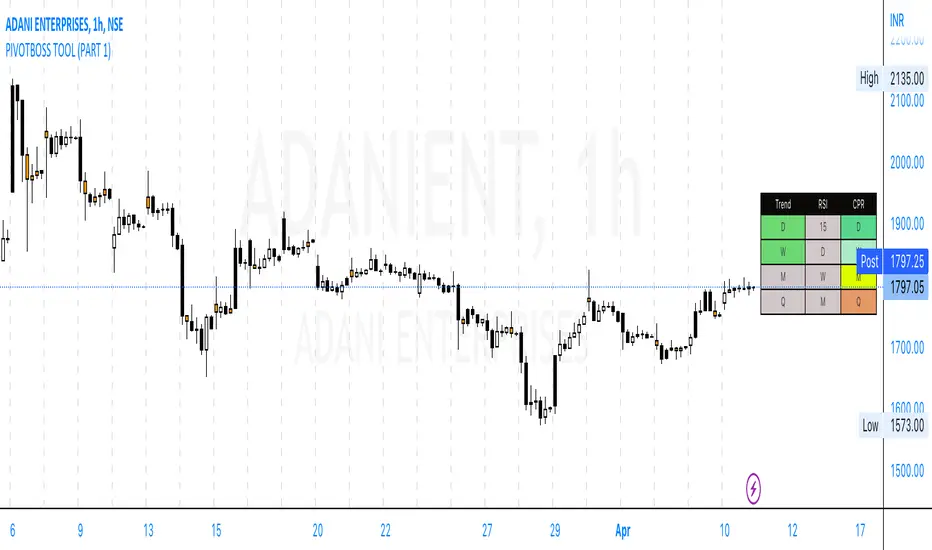
PivotBoss Tool (PART 1)Hello Everyone,
This indicator is being published on TradingView to help traders solve their multiframe analysis issue and at the same time get additional information of different timeframe like - Strength, Momentum and Central Pivot Range relationships all under one single frame.
This indicator is based on the concepts of Secrets of Pivot Boss by Mr.Frank Ochoa and strives to provide more insightful information of pivot points and other general indicators being used by traders on day-to-day basis in the simplest format possible so that traders of all kinds can relate to the same.
Below is the brief information of the indicator table you see in the layout of the above chart -
-This is the most interesting part of the indicator where the user gets to the Pivot Trend, RSI strength and Central Pivot Range (CPR) relationship all under one table which comes to be very handy during Intraday trading and Swing/Positional Trading.
#Pivot Trend
This column gives the user the information regarding price movement near to pivot points across multiple timeframes in a single frame which gives the user the accessibility to track the trend in different time frames, to make the information readily available colour code are included in the table which is customisable in the hands of the user and below is the explanation for the same -
- GREEN (Above H3)
- GREY (Between H3-L3)
- RED (Below L3)
#RSI
This column gives the user the information regarding price movement near to RSI values across multiple timeframes in a single frame which gives the user the accessibility to track the momentum in different time frames, to make the information readily available colour code are included in the table which is customisable in the hands of the user and below is the explanation for the same -
- GREEN (Above 70)
- GREY (Between 30 to 70)
- RED (Below 30)
#Central Pivot Range (CPR) Relationship
This column gives an idea of the trend direction and intensity which is exactly formulated according the concepts of PivotBoss Book and it also states the relationship of CPR's with customisable colour codes in the indicator settings, to make the information readily available colour code are included in the table which is customisable in the hands of the user and below is the explanation for the same -
There are generally six possible relationships for CPR compared to previous CPR where the timeframe can be variable but the relationship identification stays constant which is depicted as below -
- GREEN
1) Dark Green denotes "Higher Value CPR Relationship"
2) Light Green denotes "Overlapping Higher Value CPR Relationship"
- RED
3) Dark Red denotes "Lower Value CPR Relationship"
4) Light Red denotes "Overlapping Lower Value CPR Relationship"
- GREY
5) Denotes "Outside Value CPR Relationship"
- YELLOW
6) Denotes "Inside Value CPR Relationship"
This is a very basic tool created to identify Strength, Momentum and Central Pivot Relationship (CPR) across different timeframes so that the user is able to identify the broader aspect of the stock in a single frame and thus can execute his trading skills with optimum efficiency.
This indicator will be updated with time and depending on community's feedback and requirements.
Credits -
- Mr. Frank Ochoa (Concepts and ideas from the book 'Secrets of PivotBoss' )
- TradingView (Providing a platform to traders to simply their trading through 'PineScript')
Regards,
Mukkull
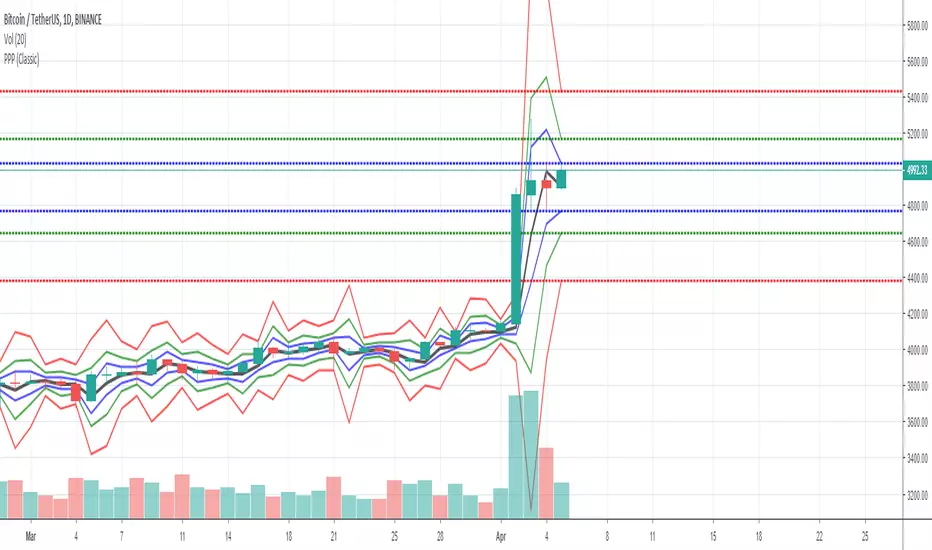
Pivot Point V2 Pivot points simply took the high, low, and closing price from the previous period and
divided by 3 to find the pivot. From this pivot, traders would then base their
calculations for three support, and three resistance levels. The calculation for the most
basic flavor of pivot points, known as ‘floor-trader pivots’, along with their support and
resistance levels.

Pivot SuperTrend Auto-Opt + WFO + MultiObj + Filter/Diag# Pivot SuperTrend (NetProfit Auto-Optimization) — Summary & Quick Start
## What this strategy is
A self-optimizing **SuperTrend-style** strategy for TradingView Pine v6 that:
- builds a **walk-forward, net-profit optimizer** directly on the chart,
- adapts its trailing stop/entry logic to **market regime** and **volatility**, and
- exposes a **filter/gate suite** so you can dial aggressiveness vs. noise without breaking auto-optimization.
Default tuning: **Bybit ETHUSDT Perpetual, 30m** (works elsewhere once tuned).
---
## Core logic (high level)
### 1) SuperTrend backbone (with Center/Pivots)
- **Center line**: smoothed running pivot from `ta.pivothigh/low`.
- **SuperTrend bands**: `Center ± Factor × ATR(length)` with a carry rule to reduce whipsaws.
- **Trend state**: `+1` above band, `-1` below band.
- **Flip**: trend change; can require **1-bar confirmation**.
### 2) Adaptive smoothing (AMA of ST)
- Performance-weighted **alpha** smooths the trailing stop.
- Alpha clamped to `alpha_min…alpha_max` using optimizer’s fitness.
### 3) On-chart net-profit optimizer (walk-forward)
- Grid of parameters:
- ATR Length `len` (min…max…step)
- ATR Factor `F` (min…max…step)
- Performance memory `A` (min…max…step)
- Each grid point is paper-traded **each bar** including fees/slippage → **fitness = net profit EMA**.
- Every `opt_interval` bars the **best** candidate is activated (with hysteresis).
- Optional: apply only **ATR margin** gate inside the optimizer for speed/stability.
### 4) Regime detection & anti-chop
- Custom **ADX** + **Center slope** to classify **trend** vs **range**.
- Adaptive thresholds in range regime (distance-to-center, ST-near-center block, etc.).
- Optional **ATR fast/slow ratio** gate.
- Other tools: **min bars since flip**, **hold bars after flip**, **distance to center**, **ST near center** block.
### 5) Entry logic
- **Immediate on flip** or **1-bar confirm**.
- Must pass the **Filter Suite** (toggleable gates):
- ATR-margin cross (hard cross or wick reject)
- Trend Regime (require trend)
- Hold-after-flip
- Distance-to-center
- ST-near-center block
- Volatility ratio (ATR fast/slow)
- Min bars since flip (flip cooldown)
- Daily trade cap & post-loss cooldown
- Trading session window
### 6) Starter preset (failsafe)
- Lenient defaults so trades start quickly to build warm-up data; then you can tighten gates.
### 7) Position management
- Strategy entries for “LONG” / “SHORT”.
- Optional **50% take-profit on Center** (“usecenter”).
- **Only-Long** mode supported with separate exit logic if regime turns bearish.
### 8) Risk controls
- **Max trades per day**, **cooldown bars after loss**, **session window**.
- Optional **bar coloring**, **trend shading**, **signal markers**.
- **Diagnostics** labels show which gate blocked an entry (letters `M T H D N V F C CD S`).
### 9) Alerts & Bybit webhook
- Use alert condition: **Any alert() function call**.
- Fires `"LONG_CONFIRMED"` / `"SHORT_CONFIRMED"`.
---
## Inputs overview
- **Pivot / Center**: pivot length; show pivots & center.
- **Visual**: line widths, bar colors, shading; warm-up bars.
- **Execution / Costs**: fee (bps), slippage (bps), “Only long”, 50% center-close.
- **Auto-Optimize**: grids for `len`, `F`, `A`, interval, memory, acceptance floor.
- **Signal Controls**: 1-bar confirm, ATR margin, min bars since flip.
- **Anti-Chop**: distance to center, hold bars, slope len, ST-near-center ATR, ATR slow len & ratio.
- **Trend Regime**: ADX len/threshold, center slope threshold, “require trend”.
- **Risk Gates**: max trades/day, loss cooldown bars.
- **Session**: optional 07:00–22:00 UTC filter.
- **Diagnostics**: show gate diagnostics labels.
- **Filter Suite**: toggle each gate; optional “apply margin to optimizer”.
- **Starter preset** selector.
---
## Plots & UI
- **Adaptive SuperTrend** (active candidate),
- **PP Center** (optional),
- **Trend shading** (price vs ST zone),
- **Entry/Exit markers** (triangles),
- **Diagnostics** text labels (optional).
---
## Webhook notes (Bybit v5)
If you use a direct Bybit webhook:
- **Symbol**: TradingView may emit `ETHUSDT.P`. Bybit wants `ETHUSDT`. Your relay should **strip `.P`**.
- **Side**: TV provides `buy/sell`. Bybit expects `Buy/Sell` → normalize casing in the relay.
- **Reduce-only**: mark exits and partial closes reduce-only to avoid reversals in Hedge mode.
- **Market orders**: pass `"orderType":"Market"`; ignore price or set to `"marketPrice"` if your relay requires it.
**Entry (Market)**
```json
{
"exchange": "BYBIT",
"category": "linear",
"symbol": "{{ticker}}",
"side": "{{strategy.order.action}}",
"orderType": "Market",
"qty": "{{strategy.order.contracts}}",
"reduceOnly": false,
"timestamp": "{{timenow}}",
"clientOrderId": "pst_{{strategy.order.id}}_{{timenow}}"
}

Pivot Points)Pivot Point Display:
Calculate and draw the Pivot Point line (center point).
Calculate and display Support and Resistance levels.
Types of Pivot Calculation Methods:
Classic (default)
Ability to select other methods such as Fibonacci, Camarilla, Woodie's (but not yet implemented in the code).
Support and Resistance Lines:
Four resistance levels (R1, R2, R3, R4) in red.
Four support levels (S1, S2, S3, S4) in bright green.
Ability to adjust line thickness:
The user can change the thickness of the lines.
Value Labeling:
Display a numerical value for Pivot, resistance and support next to each level.
Automatic Update:
Delete previous lines and labels and draw new lines on the last candle.
Works on all timeframes:
This indicator works on different timeframes such as 1 minute, 5 minutes, 1 hour, 4 hours, daily, weekly and monthly.

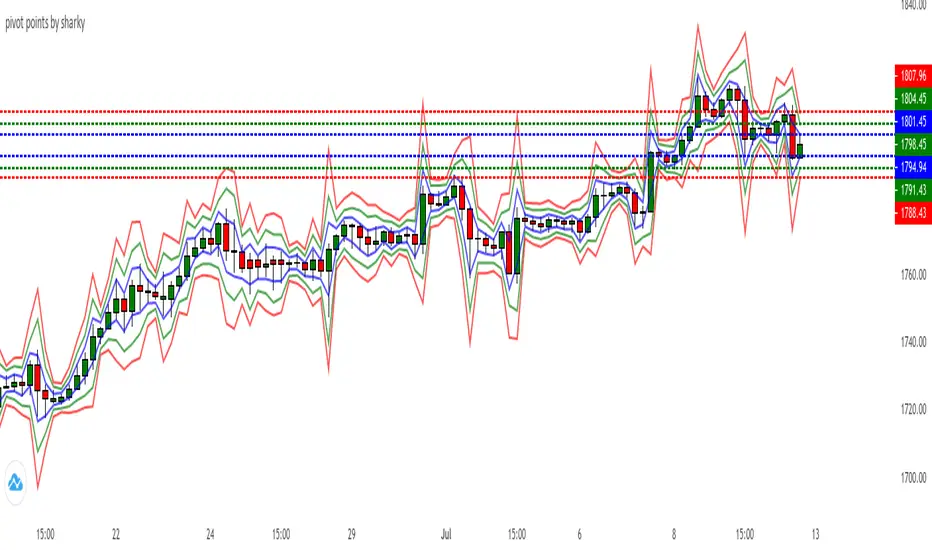
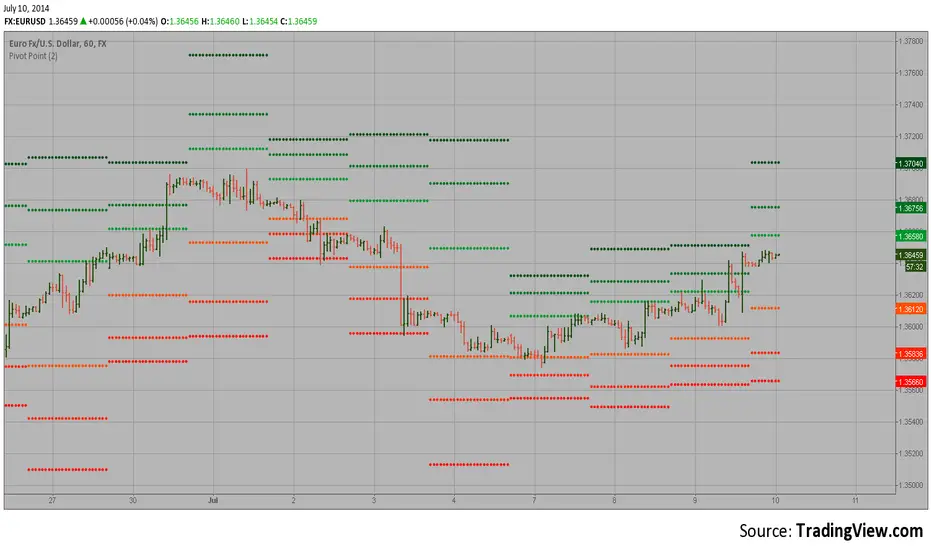
Pivot Points Std iazzuPivot point std iazzu
In financial markets, a pivot point is a price level that is used by traders as a possible indicator of market movement. A pivot point is calculated as an average of significant prices from the performance of a market in the prior trading perio


Pivot Points by ParaticaPivot Points are very important for specially day traders. But Tradingview provides only monthly Pivot Points. You can check Pivot Points in any Chart Interval with this indicator.

Pivot Reversal AlertsPivot Reversal Study script, for generating Alerts and visual plotting of Pivot Reversal lines on the charts. Use a Strategy script (like Figs & Dates), for backtesting different settings on various time frames and charts.

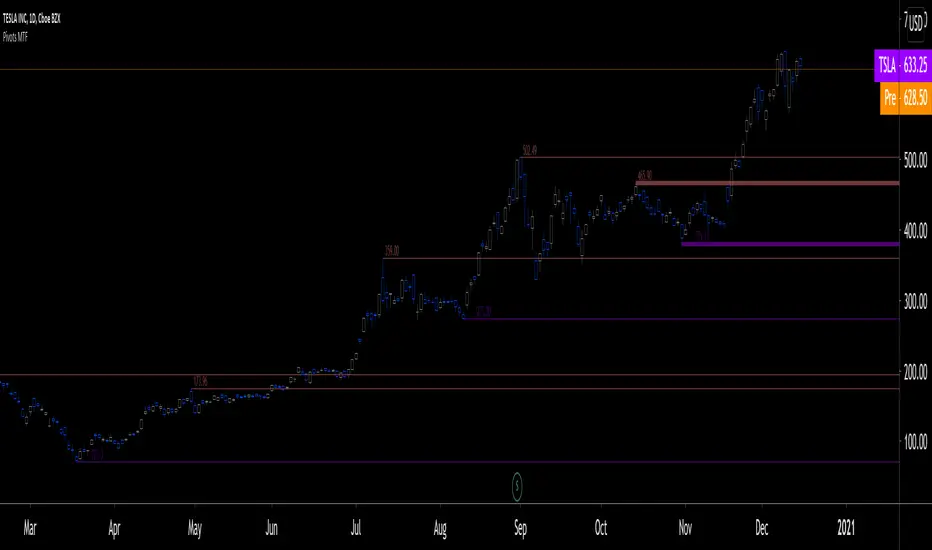
Pivots MTF [LucF]Pivots detected at higher timeframes are more significant because more market activity—or work—is required to produce them. This indicator displays pivots calculated on the higher timeframe of your choice.
Features
► Timeframe selection
— The higher timeframe (HTF) can be selected in 3 different ways:
• By steps (15 min., 60 min., 4H, 1D, 3D, 1W, 1M, 1Y). This setting is the default.
• As a multiple of the current chart's resolution, which can be fractional, so 3.5 will work.
• Fixed.
— The HTF used can be displayed near the last bar (default).
— Note that using the HTF is not mandatory. If it is disabled, the indicator will calculate on the chart's resolution.
— Non-repainting or repainting mode can be selected. This has no impact on the display of historical bars, but when no repainting is selected, pivot detection in the realtime bar will be delayed by one chart bar (not one bar at the HTF).
► Pivots
— Three color schemes are provided: green/red, aqua/pink and coral/violet (the default).
— Both the thickness and brightness of lines can be controlled separately for the hi and lo pivots.
— The visibility of the last hi/lo pivots can be enhanced.
— Prices can be displayed on pivot lines and the text's size and color can be adjusted.
— The number of bars required for the left/right pivot legs can be controlled (the default is 4).
— The source can be selected individually for hi and lo pivots (the default is hlc3 and low .
— The mean of the hi/lo pivot values of the last few thousand chart bars can be displayed. Pivots having lasted longer during the mean's period will weigh more in the calculation. The mean can be displayed in running mode and/or only showing its last level as a long horizontal line. I don't find it very useful; maybe others will.
► Markers and Alerts
— Markers can be configured on breaches of either the last hi/lo pivot levels, or the hi/lo mean. Crossovers and crossunders are controlled separately.
— Alerts can be configured using any of the marker combinations. As is usual for my indicators, only one alert is used. It will trigger on the markers that are active when you create your alert. Once your markers are set up the way you want, create your alert from the chart/timeframe you want the alert to run on, and be sure to use the “Once Per Bar Close” triggering condition. Use an alert message that will remind you of the combination of markers used when creating the alert. If you use multiple markers to trigger one alert, then having the indicator show those markers will be important to help you figure out which marker triggered the alert when it fired.
A quick look at the pattern of these markers will hopefully convince you that using them as entry/exit signals would be perilous, as they are prone to whipsaw. I have included them because some traders may use the markers as reminders.
Using Pivots
These pivots can be used in a few different ways:
— When using the high / low sources they will show extreme levels, breaches of which should be more significant.
— Another way to use them is with hlc3 (the average of the high , low and close ) for hi pivots and low for the lo pivots. This accounts for my personal mythology to the effect that drops typically reach previous lows more easily than rallies make newer highs.
— Using low for hi pivots and high for lo pivots (so backward) can be a useful way to set stops or to detect weakness in movements.
You will usually be better served by pivots if you consider them as denoting regions rather than precise levels. The flexibility in the display options of this indicator will help you adapt it to the way you use your pivots. To indicate areas rather than levels, for example, try using a brightness of 1 with a line thickness of 30. The cloud effect generated this way will show areas better than fine lines.
Realize that these pivot lines are positioned in the past, and so they are drawn after the fact because a given number of bars need to elapse before calculations determine a pivot has occurred. You will thus never see a pivot top, for example, identified on the realtime bar. To detect a pivot, it takes a number of bars corresponding to the dilation of the higher timeframe in the current one, multiplied by the number of bars you use for your pivots' right leg. Also note that the Pine native function used to detect pivots in this indicator considers a summit to be a top when the number of bars in each leg are lower or equal to that top. Bars in legs do not need to be progressively lower on each side of the pivot for a pivot to be detected.
If you program in Pine
— See the Pinecoders MTF Selection Framework for an explanation of the functions used in this script to provide the selection mechanism for the higher timeframe.
— This code uses the Pine Script Coding Conventions .
Thanks
— To the Pine coders asking questions in the Pine Script chat on TV ; your questions got me to write this indicator.
Pivot Points High Low & Missed Reversal Levels [LuxAlgo]Pivot Points High/Low, sometimes referred to as "Bar Count Reversals" allows highlighting market prices local tops and bottoms. This method compares the price value at a certain index within a user-specified window length and tests whether it is the highest (pivot high) or lowest (pivot low).
This method can return successive pivots of the same type, thus missing certain reversals, as such, we aimed to highlight those missed reversals and provide a level at their location to determine if they had any significant role to play. A zig-zag is additionally built, connecting regular pivots with missed reversals.
Settings
Pivot Length: Determine the "Bar Count Reversals" window size. higher values will highlight more significant reversals.
Other settings control the look of the displayed graphical elements within the indicator.
Usage
Missed reversals are highlighted by labels with a ghost emoji, a Zig-Zag line connecting a missed reversal is dashed. Note that labels are offset by -Pivot Length bars (with the exception of the most recent one), and as such are detected further ahead of their location.
When a missed reversal is detected, a level is displayed, starting at the location of the missed reversal and ending when a new missed reversal is detected.
These levels can be used as support and resistance.
The most recent label estimates the possible location of a confirmed reversal, and will continuously readjust whether price makes a new higher high/lower low depending on the type of previously detected pivot. A level is also made out of this estimated reversal.

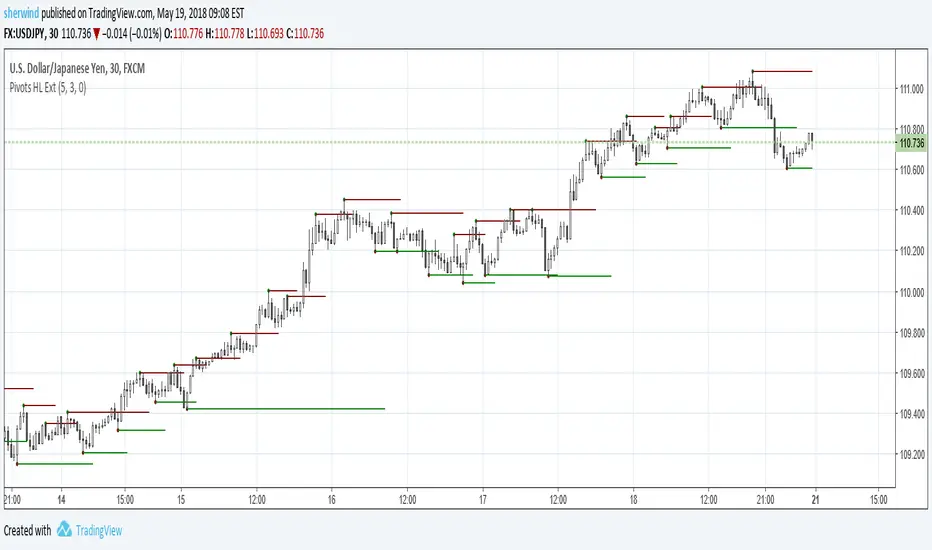
Pivot Points High Low ExtensionPivot Points High Low Extension
See Also:
- A Simple 1-2-3 Method for Trading Forex
- The Classic 1-2-3 Pattern: An Underestimated Powerhouse
- Bulkowski's 1-2-3 Trend Change
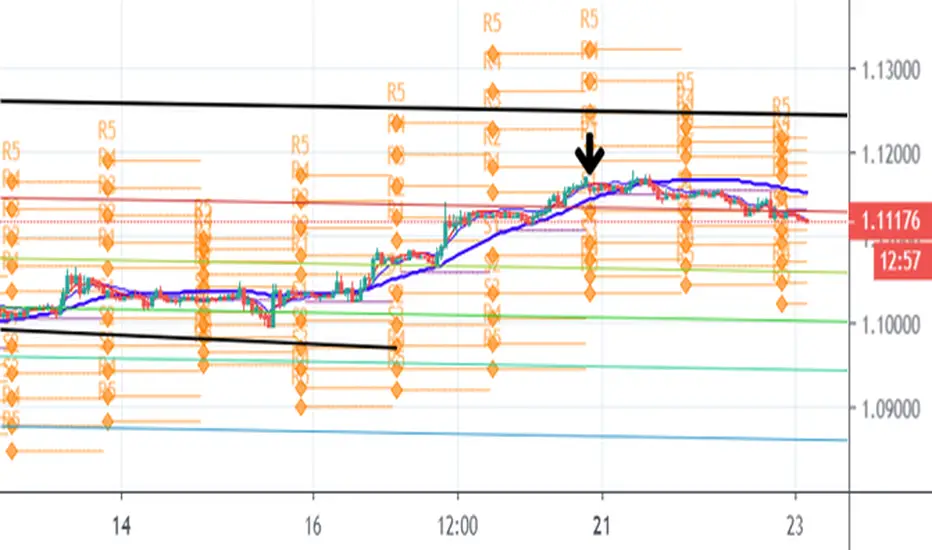
PivotSri(+) - Advanced TraditionalPivot Points Indicator
Description:
The Sri(+) Pivot Points Indicator is a powerful and customizable tool for traders looking to analyze key support and resistance levels based on Next Day CPR, Daily, Weekly, and Monthly Pivot Points. This indicator automatically calculates classic pivot levels, including support and resistance lines, providing valuable insights into market trends and potential reversal zones.
The script offers:
✅ Pivot Points Calculation - Determines key price levels using a standard pivot formula.
✅ Multi-Timeframe Support - Displays pivot points from different timeframes (Daily, Weekly, Monthly).
✅ Support & Resistance Levels (S1 to S5 / R1 to R5) - Visualizes multiple levels of support and resistance for precise market structure analysis.
✅ Customizable Colors & Styles - Allows traders to personalize pivot lines, background colors, and transparency for better visibility.
✅ Dynamic Box Display for TC & BC - Highlights the range between Top Central (TC) and Bottom Central (BC) pivot levels.
✅ Automatic Timeframe Adjustment - The script ensures pivots are aligned properly across different trading sessions.
✅ Central Pivot Range (CPR) Analysis - Identifies bullish or bearish trends based on price action relative to the Monthly CPR.
✅ No Repainting - Uses historical pivot data to ensure stable and accurate plotting.
How It Works
Pivot Calculation: The script calculates the central pivot point (P) based on the previous period’s high, low, and close prices.
Support & Resistance: The indicator derives S1-S5 and R1-R5 levels to help identify potential breakout and retracement zones.
Monthly CPR-Based Trend Bias:
If the stock is trading below the Monthly CPR, it indicates a bearish trend.
If the stock is trading above the Monthly CPR, it suggests a bullish trend.
Weekly & Monthly Adjustments: The pivot levels are updated dynamically to match the selected timeframe, ensuring traders always have relevant market data.
Pros of Using Sri(+) Pivot Indicator
🚀 Enhanced Decision Making – Identify key price zones where the market may react.
📈 Perfect for Day & Swing Traders – Get Daily, Weekly, and Monthly pivots for short and long-term analysis.
🎨 Customizable Appearance – Adjust colors, line widths, and transparency for optimal chart visibility.
⏳ Multi-Timeframe Flexibility – Works on any timeframe, from intraday scalping to long-term trend analysis.
🔄 Reliable and Accurate – No repainting; pivots remain fixed once calculated.
📊 Supports Technical Confluence – Combine with other indicators like SuperTrend, RSI, CCI, or Volume for stronger trading signals.
📉 CPR-Based Trend Confirmation – Quickly assess market bias based on price location relative to the Monthly CPR.
How to Use
1️⃣ Add the script to your TradingView chart.
2️⃣ Customize pivot settings according to your trading style.
3️⃣ Observe the Monthly CPR trend bias for directional confirmation.
4️⃣ Use the plotted levels to determine potential entry & exit points.
5️⃣ Combine with other technical indicators for improved trade confirmation.
🎯 Best Used For:
✅ Scalping & Day Trading
✅ Swing Trading
✅ Trend Reversals & Breakout Strategies
✅ Confluence with Other Indicators
Final Thoughts
The Sri(+) Pivot Indicator is an essential tool for traders looking to leverage pivot points, support, and resistance levels effectively. With its customizable settings, CPR-based trend bias, and multi-timeframe support, this script can significantly enhance your trading strategy.
📢 If you find this useful, don’t forget to give it a LIKE and SHARE with fellow traders! 🚀🎯

Pivot Point V2 Backtest Pivot points simply took the high, low, and closing price from the previous period and
divided by 3 to find the pivot. From this pivot, traders would then base their
calculations for three support, and three resistance levels. The calculation for the most
basic flavor of pivot points, known as ‘floor-trader pivots’, along with their support and
resistance levels.
WARNING:
- For purpose educate only
- This script to change bars colors.

Pivot Point Pivot points simply took the high, low, and closing price from the previous period and
divided by 3 to find the pivot. From this pivot, traders would then base their
calculations for three support, and three resistance levels. The calculation for the most
basic flavor of pivot points, known as ‘floor-trader pivots’, along with their support and
resistance levels.
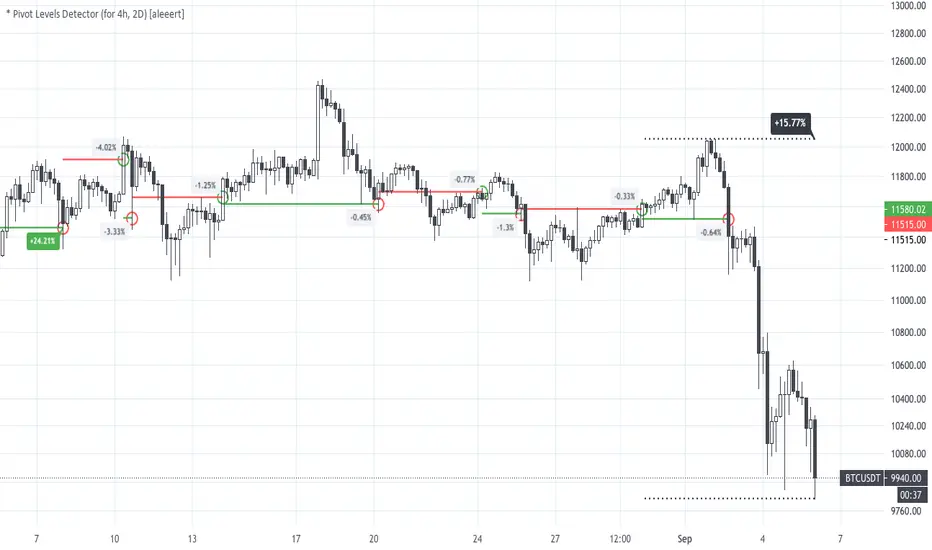
* Pivot Levels Detector (for H4, D2) [aleeert]Pivot Levels Detector is the script based on idea about breakouts of pivot levels which based on certain numbers of bars used for reaching the target and breakout the level. Working timeframes are H4 and 2D . The script works better with BTCUSD, ETHUSD, EOSBTC, AAPL, TSLA.
No repainting!
The script doesn't use any moving averages or other relative methods which cancel or change data on previous bars. Once the signal is showed it will stay forever.
NOTE: The results from Strategy Tester could slight vary from results you see on the chart. It's because of calculation method used on Strategy Tester, which uses a data from closed bars only, not by target reaching. So the results you see on the chart are more correct.
Follow me for receiving more scripts and indicators.
Regards,
aleeert