Market Structure Trailing Stop MTF [Inspired by LuxAlgo]# Market Structure Trailing Stop MTF
**OPEN-SOURCE SCRIPT**
*208k+ views on original · Modified for MTF Support*
This indicator is a direct adaptation of the renowned **Market Structure Trailing Stop** by **LuxAlgo** (original script: [Market Structure Trailing Stop ]()). The core logic remains untouched, providing dynamic trailing stops based on market structure breaks (CHoCH/BOS). The **only modification** is the addition of **Multi-Timeframe (MTF) support**, allowing users to apply the trailing stops and structures from **higher timeframes (HTF)** directly on their current chart. This enhances usability for traders analyzing cross-timeframe confluence without switching charts.
**Special thanks to LuxAlgo** for releasing this powerful open-source tool under CC BY-NC-SA 4.0. Your contributions to the TradingView community have inspired countless traders—grateful for the solid foundation!
## 🔶 How the Script Works: A Deep Dive
At its heart, this indicator detects **market structure shifts** (bullish or bearish breaks of swing highs/lows) and uses them to generate **adaptive trailing stops**. These stops trail the price while protecting profits and acting as dynamic support/resistance levels. The MTF enhancement pulls this logic from user-specified higher timeframes, overlaying HTF structures and stops on the lower timeframe chart for seamless multi-timeframe analysis.
### Core Logic (Unchanged from LuxAlgo's Original)
1. **Pivot Detection**:
- Uses `ta.pivothigh()` and `ta.pivotlow()` with a user-defined lookback (`length`) to identify swing highs (PH) and lows (PL).
- Coordinates (price `y` and bar index/time `x`) are stored in persistent variables (`var`) for tracking recent pivots.
2. **Market Structure Detection**:
- **Bullish Structure (BOS/CHoCH)**: Triggers when `close > recent PH` (break above swing high).
- If `resetOn = 'CHoCH'`, resets only on major shifts (Change of Character); otherwise, on all breaks.
- Sets trend state `os = 1` (bullish) and highlights the break with a horizontal line (dashed for CHoCH, dotted for BOS).
- Initializes trailing stop at the local minimum (lowest low since the pivot) using a backward loop: `btm = math.min(low , btm)`.
- **Bearish Structure**: Triggers when `close < recent PL`, mirroring the bullish logic (`os = -1`, local maximum for stop).
- Structure state `ms` tracks the break type (1 for bull, -1 for bear, 0 neutral), resetting based on user settings.
3. **Trailing Stop Calculation**:
- Tracks **trailing max/min**:
- On new bull structure: Reset `max = close`.
- On new bear: Reset `min = close`.
- Otherwise: `max = math.max(close, max)` / `min = math.min(close, min)`.
- **Stop Adjustment** (the "trailing" magic):
- On fresh structure: `ts = btm` (bull) or `top` (bear).
- In ongoing trend: Increment/decrement by a percentage of the max/min change:
- Bull: `ts += (max - max ) * (incr / 100)`
- Bear: `ts += (min - min ) * (incr / 100)`
- This creates a **ratcheting effect**: Stops move favorably with the trend but never against it, converging toward price at a controlled rate.
- **Visuals**:
- Plots `ts` line colored by trend (teal for bull, red for bear).
- Fills area between `close` and `ts` (orange on retracements).
- Draws structure lines from pivot to break point.
4. **Edge Cases**:
- Variables like `ph_cross`/`pl_cross` prevent multiple triggers on the same pivot.
- Neutral state (`ms = 0`) preserves prior `max/min` until a new structure.
### MTF Enhancement (Our Addition)
- **request.security() Integration**:
- Wraps the entire core function `f()` in a security call for each timeframe (`tf1`, `tf2`).
- Returns HTF values (e.g., `ts1`, `os1`, structure times/prices) to the chart's context.
- Uses `lookahead=barmerge.lookahead_off` for accurate historical repainting-free data.
- Structures are drawn using `xloc.bar_time` to align HTF lines precisely on the LTF chart.
- **Multi-Output Handling**:
- Separate plots/fills/lines for each TF (e.g., `plot_ts1`, `plot_ts2`).
- Colors and toggles per TF to distinguish HTF1 (e.g., teal/red) from HTF2 (e.g., blue/maroon).
- **Benefits**: Spot HTF bias on LTF entries, e.g., enter longs only if both TF1 (1H) and TF2 (4H) show bullish `os=1`.
This keeps the script lightweight—**no repainting, max 500 lines**, and fully compatible with LuxAlgo's original behavior when TFs are set to the chart's timeframe.
## 🔶 SETTINGS
### Core Parameters
- **Pivot Lookback** (`length = 14`): Bars left/right for pivot detection. Higher = smoother structures, fewer signals; lower = more noise.
- **Increment Factor %** (`incr = 100`): Speed of stop convergence (0-∞). 100% = full ratchet (mirrors max/min exactly); <100% = slower trail, reduces whipsaws.
- **Reset Stop On** (`'CHoCH'`): `'CHoCH'` = Reset only on major reversals (dashed lines); `'All'` = Reset on every BOS/CHoCH (tighter stops).
### MTF Support
- **Timeframe 1** (`tf1 = ""`): HTF for first set (e.g., "1H"). Empty = current chart.
- **Timeframe 2** (`tf2 = ""`): Second HTF (e.g., "4H"). Enables dual confluence.
### Display Toggles
- **Show Structures** (`true`): Draws horizontal lines for breaks (per TF colors).
- **Show Trailing Stop TF1/TF2** (`true`): Plots the stop line.
- **Show Fill TF1/TF2** (`true`): Area fill between close and stop.
### Candle Coloring (Optional)
- **Color Candles** (`false`): Enables custom `plotcandle` for body/wick/border.
- **Candle Color Based On TF** (`"None"`): `"TF1"`, `"TF2"`, or none. Colors bull trend green, bear red.
- **Candle Colors**: Separate inputs for bull/bear body, wick, border (e.g., solid green body, transparent wick).
### Alerts
- **Enable MS Break Alerts** (`false`): Notifies on structure breaks (bull/bear per TF) **only on bar close** (`barstate.isconfirmed` + `alert.freq_once_per_bar_close`).
- **Enable Stop Hit Alerts** (`false`): Triggers on stop breaches (long/short per TF), using `ta.crossunder/crossover`.
### Colors
- **TF1 Colors**: Bullish (teal), Bearish (red), Retracement (orange).
- **TF2 Colors**: Bullish (blue), Bearish (maroon), Retracement (orange).
- **Area Transparency** (`80`): Fill opacity (0-100).
## 🔶 USAGE
Trailing stops shine in **trend-following strategies**:
- **Entries**: Use structure breaks as signals (e.g., long on bullish BOS from HTF1).
- **Exits**: Trail stops for profit-locking; alert on hits for automation.
- **Confluence**: Overlay HTF1 (e.g., 1H) for bias, HTF2 (e.g., Daily) for major levels—enter LTF only on alignment.
- **Risk Management**: Lower `incr` avoids early stops in chop; reset on `'All'` for aggressive trailing.
! (i.imgur.com)
*HTF1 shows bullish structure (teal line), trailing stop ratchets up—long entry confirmed on LTF pullback.*
! (i.imgur.com)
*TF1 (blue) bearish, TF2 (red) neutral—avoid shorts until alignment.*
! (i.imgur.com)
*Colored based on TF1 trend: Green bodies on bull `os=1`.*
Pro Tip: Test on demo—pair with LuxAlgo's other tools like Smart Money Concepts for full structure ecosystem.
## 🔶 DETAILS: Mathematical Breakdown
On bullish break:
- Local min: `btm = ta.lowest(n - ph_x)` (optimized loop equivalent).
- Stop init: `ts = btm`.
- Update: `Δmax = max - max `, `ts_new = ts + Δmax * (incr/100)`.
Bearish mirrors with `Δmin` (negative, so decrements `ts`).
In MTF: HTF `time` aligns lines via `line.new(htf_time, level, current_time, level, xloc.bar_time)`.
No logs/math libs needed—pure Pine v5 efficiency.
## Disclaimer
This is for educational purposes. Not financial advice. Backtest thoroughly. Original by LuxAlgo—modify at your risk. See TradingView's (www.tradingview.com). Licensed under CC BY-NC-SA 4.0 (attribution to LuxAlgo required).
Cerca negli script per "pivot"

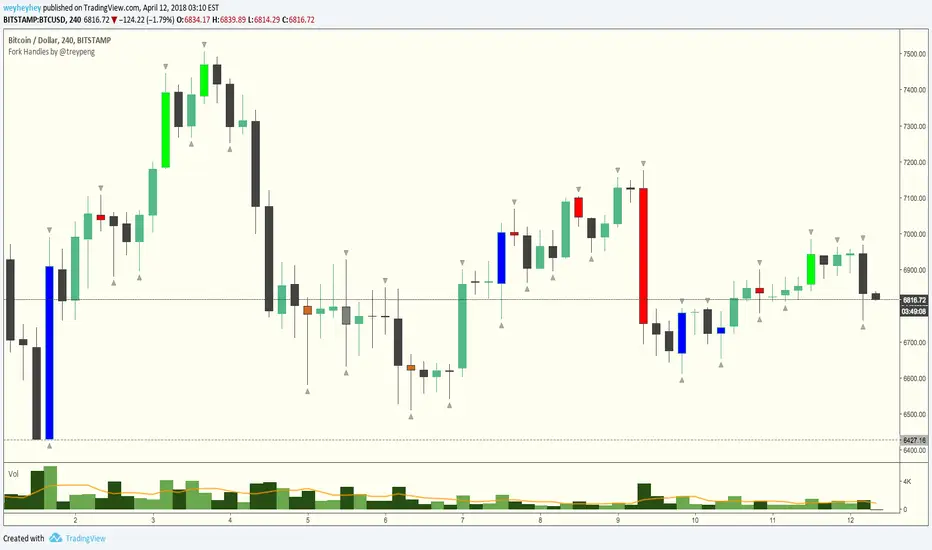
Fork Handles by @treypeng
Candle based indicator that shows swing highs and lows (pivots).
It draws an up or down arrow for simple three candle 'single' swings.
For stronger five candle 'double' swings, it colours the candle. Good for highlighting stronger reversals.
Both of these stylings can be toggled on/off individually.
Default colours
Swing HIGH on an UP candle: bright green
Swing HIGH on an DOWN candle: bright red
Swing LOW on an UP candle: blue
Swing LOW on an DOWN candle: brown
Double swings are grey or white.
Regular candles are just kept to your own default colours as specified in the chart settings.
👏 for anyone who gets the 'fork handles' joke reference.
Intermarket Swing Projection [LuxAlgo]The Intermarket Swing Projection allows traders to plot price movement swings from any user-selected asset directly onto the chart in the form of zigzags and/or horizontal support and resistance levels.
This tool rescale the external asset price on the user chart, enabling traders to make direct comparisons.
It answers the question of how different the price behavior is between two assets, accounting for each asset's volatility.
🔶 USAGE
This tool is based on swing detection of two different assets: the chart and a user-selected asset. It allows traders to compare two assets on an equal footing while accounting for volatility and price behavior.
Traders can customize the detection by selecting a custom ticker, timeframe, the number of swings and length for swing detection. This makes the tool a Swiss army knife for asset comparison.
As we can see in the image below, the Show Last, Pivot Length, and Spread parameters are key to defining the final output of the tool.
"Show Last" defines how many pivots are displayed. "Pivot Length" is used for pivot detection; a larger value will detect larger market structures. "Spread" defines how far apart the horizontal levels will be from their original location in terms of volatility.
🔹 Comparing different assets
This image shows the Nasdaq 100 futures contract compared to four other futures contracts: S&P 500, gold, bitcoin, and euro/U.S. dollar.
Plotting all of these assets in Nasdaq 100 terms makes it easy to compare and analyze price behaviors and identify key levels.
In the top left chart, we have NQ vs. ES. It's no surprise that they are practically an exact match; a large portion of the S&P 500 is technology.
In the top right chart, NQ vs. GC, we see totally different behaviors. We can clearly see the summer consolidation in gold and the resumption of the uptrend, which took gold above 29,200 NQ points, up from 21,200.
In the bottom right chart, we see bitcoin making new highs, way above the Nasdaq in May, July, and October. However, the last high was way below the Nasdaq prices on October 27—the first lower high in a while. Sellers are pushing down.
Finally, the bottom left chart is NQ vs. 6E. We can see large volatility in the uptrend since February, with NQ unable to catch up until now. The last swing low was almost a match, and 6E is in a range.
As we can see, this tool allows us to perform intermarket analysis properly by accounting for each asset's volatility and price behavior. Then, we plot them on the same scale on equal terms, which makes performing this kind of analysis easy.
As we can see in the chart above, the assets are the same as in the previous image, but the timeframe is 1H with different settings.
Note the horizontal levels acting as support and resistance, as well as how NQ prices react to the zones marked with white circles. These levels are derived from custom assets selected by the user.
🔹 Displaying Elements
Zig-zag allows traders to clearly see the path that the selected asset's price took, as well as its turning points.
Horizontal levels are displayed from those turning points to the present and can be used as support or resistance. Traders can adjust the spread parameter in the settings panel to expand or contract those levels' volatility.
There are two color modes for the levels: average and pivots. In the first mode, green is used for levels below the average and red for levels above the average. The second uses green for swing lows and red for swing highs.
The backpaint feature is enabled by default and allows the swings to be displayed in the correct location. With this feature disabled, the swings will be displayed in the current location when a new swing is detected.
🔶 DETAILS
On a more technical note, the rescaling is formed by calculating three main elements from all the swings detected on the custom and chart assets:
The chart asset's average of all swing points
The chart asset's standard deviation of all swing points
The custom asset's z-score for each swing point
Then, the re-scaled swing point is calculated as the average plus the z-score multiplied by the standard deviation. This makes it possible to plot AAPL swings on an NQ chart, for example.
Thanks to re-scaling, we can directly compare the price behavior of two assets with different price ranges and volatility on the same chart.
🔶 SETTINGS
🔹 Trendlines
Ticker: Select the custom ticker.
Timeframe: Select a custom timeframe.
Show Last: Select how many swing points to display.
Pivot Length: Select the size for swing point detection.
Spread: Volatility multiplier for horizontal levels. Larger values mean the levels are farther apart.
Backpaint: Enable or disable the backpaint feature. When enabled, the drawings will be displayed where they were detected. When disabled, the drawings will be displayed at the moment of detection.
🔹 Style
Show ZigZag: Enable or disable the ZigZag display and choose a line style.
Show Levels: Enable or disable the levels display and choose a line style.
Color Mode: Choose between Average Mode, which colors all levels below the average bullish and all levels above bearish, and Pivot Mode, which colors swing highs bearish and swing lows bullish.
Bullish: Select a bullish color.
Bearish: Select a bearish color.
ZigZag: Select the ZigZag color.

Double Top/Bottom [AlgoAlpha]Introducing the Double Top/Bottom Indicator by AlgoAlpha, a powerful tool designed to identify key reversal patterns in the market with precision. This indicator meticulously detects double tops and double bottoms, helping traders recognize potential trend reversals and make informed trading decisions.
Key Features:
🔍 Pattern Detection : Accurately identifies double top and double bottom formations based on customizable time horizons.
🎨 Customizable Appearance : Choose your preferred colors for bullish and bearish trends to match your trading style.
📊 Signal Labels : Option to display only the second pivot of the double top/bottom for a cleaner chart view.
🔧 Flexible Settings : Adjust the time horizon to control the look-back period, allowing for detection of both short-term and long-term patterns.
📈 Visual Enhancements : Draws trend lines and fills between pivotal points to visually highlight potential reversal zones.
🔔 Alerts : Set up alerts for potential double top and double bottom formations to stay informed of key market movements.
How to Use the Double Top/Bottom Indicator :
🛠 Add the Indicator : Simply add the Double Top/Bottom Indicator to your TradingView chart from your favorites. Customize the time horizon and appearance settings to fit your trading preferences.
📊 Analyze Patterns : Watch for the identified double top and double bottom patterns along with the corresponding trend lines and filled areas to anticipate potential market reversals.
🔔 Set Alerts : Enable alerts to receive notifications when double top or double bottom patterns are detected, ensuring you never miss a critical trading opportunity.
How It Works : The indicator scans the price action for pivot highs and lows within a specified time horizon, identifying potential double top and double bottom patterns. It maintains a sequence of these pivots and verifies the formation of these patterns based on the relationship between consecutive pivots and the proximity to a defined limit. When a double top or double bottom is confirmed, the indicator marks the second pivot point with a label and draws trend lines to visualize the reversal pattern. Additionally, it provides alert conditions to notify traders of potential confirmations, enhancing decision-making without cluttering the chart.
⚠️ Important Reminder : The labels indicating double tops and bottoms appear with a delay and are intended to mark the formations after they have already formed. They are not meant to be used as real-time trading signals. While they align perfectly with pivot points in hindsight, please use them as markers for analysis rather than immediate trading triggers.

PivottrendHi all!
This script is based on the concept of "higher highs and higher lows" and "lower highs and lower lows". Bullish/bearish trend changes when a previous pivot (low in bullish trend and high in bearish trend) is broken (or has equal value). Some settings are customizable by the user:
Timeframe
- You can choose what timeframe the pivots are found on
Left length
- The left length used for the pivots found
Right length
- The right length used for the pivots found
Show labels
- Choose if you want to display buy and sell labels
Show pivots
- Choose if you want to display the pivots found
Show MSS
- Choose if you want to display a line when price breaks a previous pivot
The "look and feel" is inspired by the script "SuperTrend" by KivancOzbilgic ().
Best of trading luck!

ATR ZigZag - Volatility-Filtered Market StructureDescription
This indicator draws ZigZags using an ATR based threshold for direction switching to identify major swing highs and lows. Instead of relying on fractals or fixed bar-count swings, pivots are confirmed only when price moves beyond the prior extreme by:
threshold = ATR(length) × ATR_mult
This filters noise, enforces valid swing structure (high → low → high), and adapts automatically to volatility. The ATR ZigZag is ideal for traders who want a clean, objective view of swing structure without noise. This has many uses, including mapping swing structure, drawing chart patterns, and trading around extremes.
Lag and Repainting
Pivots are confirmed only after price moves sufficiently in the opposite direction. This creates necessary lag. The ZigZag is drawn when this occurs, and will anchor to the high/low in the past. Optional detection dot plots show exactly when confirmation occurred.
What You See
ZigZag: dashed gray line, repainted to anchor at the confirmed highs and lows
Latest Pivot Levels: Dashed horizontal lines at the most recent confirmed high/low.
Optional Live Swing Leg: A real-time line from the last confirmed pivot to the current swing extreme, updating until a new pivot forms.
Optional ATR Boxes: 1×ATR shaded zones around the latest pivot for structural context.
Optional Pivot Confirmation Dots: Markers show the bar where the threshold is crossed and a swing is officially confirmed. This is to understand the lag and see when the ZigZag repainted.

Simulateur Carnet d'Ordres & Liquidité [Sese] - Custom🔹 Indicator Name
Order Book & Liquidity Simulator - Custom
🔹 Concept and Functionality
This indicator is a technical analysis tool designed to visually simulate market depth (Order Book) and potential liquidity zones.
It is important to adhere to TradingView's transparency rules: This script does not access real Level 2 data (the actual exchange order book). Instead, it uses a deductive algorithm based on historical Price Action to estimate where Buy Limit (Bid) and Sell Limit (Ask) orders might be resting.
Methodology used by the script:
Pivot Detection: The indicator scans for significant Swing Highs and Swing Lows over a user-defined lookback period (Length).
Level Projection: These pivots are projected to the right as horizontal lines.
Red Lines (Ask): Represent potential resistance zones (sellers).
Blue Lines (Bid): Represent potential support zones (buyers).
Liquidity Management (Absorption): The script is dynamic. If the current price crosses a line, the indicator assumes the liquidity at that level has been consumed (orders filled). The line is then automatically deleted from the chart.
Density Profile (Right Side): Horizontal bars appear to the right of the current price. These approximate a "Time Price Opportunity" or Volume Profile, showing where the market has spent the most time recently.
🔹 User Manual (Settings)
Here is how to configure the inputs to match your trading style:
1. Detection Algorithm
Lookback Length (Candles): Determines the sensitivity of the pivots.
Low value (e.g., 10): Shows many lines (scalping/short term).
High value (e.g., 50): Shows only major structural levels (swing trading).
Volume Factor: (Technical note: In this specific code version, this variable is calculated but the lines are primarily drawn based on geometric pivots).
2. Visual Settings
Show Price Lines (Bid/Ask): Toggles the horizontal Support/Resistance lines on or off.
Show Volume Profile: Toggles the heatmap-style bars on the right side of the chart.
Extend Lines: If checked, untouched lines will extend to the right towards the current price bar.
3. Colors and Transparency Management
Customize the aesthetics to keep your chart clean:
Bid / Ask Colors: Choose your base colors (Default is Blue and Red).
Line Transparency (%): Crucial for chart visibility.
0% = Solid, bright colors.
80-90% = Very subtle, faint lines (recommended if you overlay this on other tools).
Text Size: Adjusts the size of the price labels ("BUY LIMIT" / "SELL LIMIT").
🔹 How to Read the Indicator
Rejections: Unbroken lines act as potential walls. Watch for price reaction when approaching a blue line (support) or red line (resistance).
Breakouts/Absorption: When a line disappears, it means the level has been breached. The market may then seek the next liquidity level (the next line).
Density (Right-side boxes): More opaque/visible boxes indicate a price zone "accepted" by the market (consolidation). Empty gaps suggest an imbalance where price might move through quickly.
⚠️ Disclaimer
This script is for educational and technical analysis purposes only. It is a simulation based on price history, not real-time order book data. Past performance is not indicative of future results. Trading involves risk.

Market Structure Volume Time Velocity ProfileThis is the Market Structure Volume Time Velocity Profile (MSVTVP). It combines event-based profiling with advanced metrics like Time and Velocity (Flow Rate). Instead of fixed time periods, profiles are anchored to critical market events (Swings, Structure Breaks, Delta Breaks), giving you a precise view of value development during specific market phases.
## The 3 Dimensions of the Market
Unlike standard tools that only show Volume, MSVTVP allows you
to switch between three critical metrics:
1. **VOLUME Profile (The "Where"):**
* Shows standard acceptance. High volume nodes (HVN)
are magnets for price.
2. **TIME Profile (The "How Long"):**
* Similar to TPO, it measures how long price spent at each
level.
* **High Time:** True acceptance and fair value.
* **Low Time:** Rejection or rapid movement.
3. **VELOCITY Profile (The "How Fast"):**
* Measures the **speed of trading** (Contracts per Second).
This reveals the hidden intent of market participants.
* **High Velocity (Fast Flow):** Aggression. Initiative
buyers/sellers are hitting market orders rapidly. Often
seen at breakouts or in liquidity vacu.
* **Low Velocity (Slow Flow):** Absorption. Massive passive
limit orders are slowing price down despite high volume.
Often seen at major reversals ("hitting a brick wall").
Key Features:
1. **Event-Based Profile Anchoring:** The indicator starts a new
profile based on one of three user-selected events
('Profile Anchor'):
- **Swing:** A new profile begins when the 'impulse baseline'
(derived from intra-bar delta) changes. This baseline
adjusts when a new **price pivot** is confirmed: When a
price **high** forms, the baseline moves to the **lower**
of its previous level or the peak delta (max of
delta O/C) at the pivot. When a price **low** forms, it
moves to the **higher** of its previous level or the
trough delta (min of delta O/C) at the pivot.
- **Structure:** A new profile begins immediately on the bar
that *confirms* a market structure break (e.g., a new HH
or LL, based on a sequence of price pivots).
- **Delta:** A new profile begins immediately on the bar
that *confirms* a break in the *cumulative delta's*
market structure (e.g., a new HH or LL in the delta).
Both 'Swing' and 'Delta' anchors are derived from the same
**continuous (non-resetting) Cumulative Volume Profile Delta (CVPD)**,
which is built from the intra-bar statistical analysis.
2. **Statistical Profile Engine:** For each bar in the anchored
period, the indicator builds a volume profile on a lower
'Intra-Bar Timeframe'. Instead of simple tick counting, it
uses advanced statistical models:
- **Allocation ('Allot model'):** 'PDF' (Probability Density
Function) distributes volume proportionally across the
bar's range based on an assumed statistical model
(e.g., T4-Skew). 'Classic' assigns all volume to
the close.
- **Buy/Sell Split ('Volume Estimator'):** 'Dynamic'
applies a model that analyzes candle wicks and
recent trend to estimate buy/sell pressure. 'Classic'
classifies all volume based on the candle color.
3. **Visualization & Lag:** The indicator plots the final
profile (as a polygon) and the developing statistical
lines (POC, VA, VWAP, StdDev).
- **Note on Lag:** All anchor events require `Pivot Right Bars`
for confirmation.
- In 'Structure' and 'Delta' mode, the developing lines
(POC, VA, etc.) are plotted using a **non-repainting**
method (showing the value from `pivRi` bars ago).
- In 'Swing' mode, the profile is plotted **retroactively**,
starting *from the bar where the pivot occurred*. The
developing lines are also plotted with this full
`pivRi` lag to align with the past data.
4. **Flexible Display Modes:** The finalized profile can be displayed
in three ways: 'Up/Down' (buy vs. sell), 'Total' (combined
volume), and 'Delta' (net difference).
5. **Dynamic Row Sizing:** Includes an option ('Rows per Percent')
to automatically adjust the number of profile rows (buckets)
based on the profile's price range.
6. **Integrated Alerts:** Includes 13 alerts that trigger for:
- A new profile reset ('Profile was resetted').
- Price crossing any of the 6 developing levels (POC,
VA High/Low, VWAP, StdDev High/Low).
- **Alert Lag Assumption:** In 'Swing' mode, alerts are
delayed to match the retroactively plotted lines.
In 'Structure' and 'Delta' modes, alerts fire in
**real-time** based on the *current price* crossing
the *current (repainting)* value of the metric, which
may **differ from the non-repainting plotted line.**
**Caution: Real-Time Data Behavior (Intra-Bar Repainting)**
This indicator uses high-resolution intra-bar data. As a result, the
values on the **current, unclosed bar** (the real-time bar) will
update dynamically as new intra-bar data arrives. This includes
the values used for real-time alerts in 'Structure' and
'Delta' modes.
---
**DISCLAIMER**
1. **For Informational/Educational Use Only:** This indicator is
provided for informational and educational purposes only. It does
not constitute financial, investment, or trading advice, nor is
it a recommendation to buy or sell any asset.
2. **Use at Your Own Risk:** All trading decisions you make based on
the information or signals generated by this indicator are made
solely at your own risk.
3. **No Guarantee of Performance:** Past performance is not an
indicator of future results. The author makes no guarantee
regarding the accuracy of the signals or future profitability.
4. **No Liability:** The author shall not be held liable for any
financial losses or damages incurred directly or indirectly from
the use of this indicator.
5. **Signals Are Not Recommendations:** The alerts and visual signals
(e.g., crossovers) generated by this tool are not direct
recommendations to buy or sell. They are technical observations
for your own analysis and consideration.

Market Structure Volume ProfileThis indicator visualizes volume profiles that are dynamically anchored to market structure events, rather than fixed time intervals. It builds these profiles using high-resolution intra-bar data to provide a precise view of where value is established during critical market phases.
Key Features:
Event-Based Profile Anchoring: The indicator starts a new profile based on one of three user-selected events ('Profile Anchor'):
Swing: A new profile begins when the 'impulse baseline' (derived from intra-bar delta) changes. This baseline adjusts when a new price pivot is confirmed: When a price high forms, the baseline moves to the lower of its previous level or the peak delta (max of delta O/C) at the pivot. When a price low forms, it moves to the higher of its previous level or the trough delta (min of delta O/C) at the pivot.
Structure: A new profile begins immediately on the bar that confirms a market structure break (e.g., a new HH or LL, based on a sequence of price pivots).
Delta: A new profile begins immediately on the bar that confirms a break in the cumulative delta's market structure (e.g., a new HH or LL in the delta). Both 'Swing' and 'Delta' anchors are derived from the same continuous (non-resetting) Cumulative Volume Profile Delta (CVPD), which is built from the intra-bar statistical analysis.
Statistical Profile Engine: For each bar in the anchored period, the indicator builds a volume profile on a lower 'Intra-Bar Timeframe'. Instead of simple tick counting, it uses advanced statistical models:
Allocation ('Allot model'): 'PDF' (Probability Density Function) distributes volume proportionally across the bar's range based on an assumed statistical model (e.g., T4-Skew). 'Classic' assigns all volume to the close.
Buy/Sell Split ('Volume Estimator'): 'Dynamic' applies a model that analyzes candle wicks and recent trend to estimate buy/sell pressure. 'Classic' classifies all volume based on the candle color.
Visualization & Lag: The indicator plots the final profile (as a polygon) and the developing statistical lines (POC, VA, VWAP, StdDev).
Note on Lag: All anchor events require Pivot Right Bars for confirmation.
In 'Structure' and 'Delta' mode, the developing lines (POC, VA, etc.) are plotted using a non-repainting method (showing the value from pivRi bars ago).
In 'Swing' mode, the profile is plotted retroactively, starting from the bar where the pivot occurred. The developing lines are also plotted with this full pivRi lag to align with the past data.
Flexible Display Modes: The finalized profile can be displayed in three ways: 'Up/Down' (buy vs. sell), 'Total' (combined volume), and 'Delta' (net difference).
Dynamic Row Sizing: Includes an option ('Rows per Percent') to automatically adjust the number of profile rows (buckets) based on the profile's price range.
Integrated Alerts: Includes 13 alerts that trigger for:
A new profile reset ('Profile was resetted').
Price crossing any of the 6 developing levels (POC, VA High/Low, VWAP, StdDev High/Low).
Alert Lag Assumption: In 'Swing' mode, alerts are delayed to match the retroactively plotted lines. In 'Structure' and 'Delta' modes, alerts fire in real-time based on the current price crossing the current (repainting) value of the metric, which may differ from the non-repainting plotted line.
Caution: Real-Time Data Behavior (Intra-Bar Repainting) This indicator uses high-resolution intra-bar data. As a result, the values on the current, unclosed bar (the real-time bar) will update dynamically as new intra-bar data arrives. This includes the values used for real-time alerts in 'Structure' and 'Delta' modes.
DISCLAIMER
For Informational/Educational Use Only: This indicator is provided for informational and educational purposes only. It does not constitute financial, investment, or trading advice, nor is it a recommendation to buy or sell any asset.
Use at Your Own Risk: All trading decisions you make based on the information or signals generated by this indicator are made solely at your own risk.
No Guarantee of Performance: Past performance is not an indicator of future results. The author makes no guarantee regarding the accuracy of the signals or future profitability.
No Liability: The author shall not be held liable for any financial losses or damages incurred directly or indirectly from the use of this indicator.
Signals Are Not Recommendations: The alerts and visual signals (e.g., crossovers) generated by this tool are not direct recommendations to buy or sell. They are technical observations for your own analysis and consideration.

Bitgak [Osprey]🟠 INTRODUCTION
Bitgak , translated as "Oblique Angle" in Korean, is a strategy used by multi-hundred-million traders in Korea, sometimes more heavily than Fibonacci retracement.
It is a concept that by connecting two or more pivot points on the chart and creating equidistant parallel lines, we can spot other pivot points. As seen in the example, a line at a different height but with the same angle spots many pivot points.
This indicator spots pivot points on the chart and tests all different possible Bitgak lines with a brute-force method. Then it shows the parallel line configuration with the most pivots hitting it. You may use the lines drawn on the chart as possible reversal points.
It is best to use on Day and Week candles . In the very short range of time, the noise makes it hard to capture meaningful data.
🟠 HOW TO USE
The orange dots are the major pivot points (you can set the period of the long-term pivot) upon which the lines are built.
Change the "Manual Lookback Bars" from 300 to a meaningful period upon your inspection.
"Hit Tolerance %" means how close a pivot needs to be to the line to be considered as having touched the line.
If the line is too narrow, which is not very useful, you may consider increasing the "Long-term Pivot Bars" and experimenting with different settings for Channel Lines and Heuristics.
The result:
"Top Anchors to Test (L)" is how many L highest peaks and L lowest troughs should be weighed heavily when testing the lines. That is, with L = 1, the algorithm will reward the Bitgak lines that touch 1 highest peak and 1 lowest trough. It doesn't make much intuitive sense, so I suggest just testing it out.
🟠 HOW IT WORKS
Step 1: Pivot Detection
The indicator runs two parallel detection systems:
Short-term pivots (default: 7 bars on each side) - Captures minor swing highs/lows for detailed analysis
Long-term pivots (default: 17 bars on each side) - Identifies major structural turning points
These pivots form the foundation for all channel calculations.
Step 2: Anchor Point Selection
From the detected long-term pivots, the algorithm identifies:
The L highest peaks (default L=1, meaning the single highest peak)
The L lowest troughs (default L=1, meaning the single lowest trough)
These become potential "anchor points" for channel construction. Higher L values test more combinations but increase computation time.
Step 3: Channel Candidate Generation
For support channels: Every pair of troughs becomes a potential base line (A-B)
For resistance channels: Every pair of peaks becomes a potential base line (A-B)
The algorithm then tests each peak (for support) or trough (for resistance) as pivot C.
Step 4: Optimal Spacing Calculation
For each A-B-C combination, the algorithm calculates:
Unit Spacing = (Distance from C to A-B line) / Multiplier
It tests multipliers from 0.5 to 4.0 (or your custom range), asking: "If pivot C sits on the 1.0 line, what spacing makes the most pivots hit other lines?"
Step 5: Scoring & Selection
Each configuration is scored by counting how many pivots fall within tolerance (default 1% of price) of any parallel line in the range . The highest-scoring channel is drawn on your chart.

Divergence Indicator with Multi-Length Pivot DetectionThis Pine Script, titled “Divergence Indicator with Multi-Length Pivot Detection”, tool that detects both regular and hidden divergences between price action and an oscillator (defaulting to close, but configurable). It features multi-length pivot logic, angle-based validation, no-cross filtering, and OB/OS region filtering, making it a robust and precise divergence engine. Below is a detailed breakdown:
⸻
🔧 Inputs and Configuration
• osc_src: Oscillator source (e.g. close, RSI, MACD).
• show_hidden: Toggles detection of hidden divergences.
• min_*_angle settings: Control the minimum angle thresholds (in degrees) for confirming valid divergences (ensures momentum is strong enough).
• validate_no_cross: Ensures oscillator and price slopes don’t “cross” the actual values (i.e. filters out invalid or messy trends).
• oversold_level, overbought_level: Used when use_ob_os_filter is enabled to require oscillator to be in OS/OB zones for regular divergence.
• min_div_length: Minimum distance in bars between previous and current pivot points.
⸻
🔁 Internal Engine Mechanics
1. Pivot Detection Engine (Phase 1: Historical Memory)
• For all combinations of left1 and right1 in the range :
• Records all valid pivot lows and pivot highs.
• Stores their:
• bar index
• price value
• oscillator value
This forms a “memory buffer” of past pivots that future price pivots are compared against.
2. Current Pivot Detection (Phase 2: Scanning)
• Loops through larger pivot configurations (left2 ∈ , right2 = 1) to detect new current pivots.
• For each new pivot, it compares against the historical pivots from phase 1.
⸻
📐 Slope and Angle Calculation
For each matching pivot pair (historical vs current):
• Price and Oscillator Slopes are calculated via linear regression, producing:
• price_angle
• osc_angle
• These are converted using math.atan() and math.todegrees() to get proper angular direction and intensity of trend.
⸻
🧠 Divergence Logic
✅ Bullish Divergence
• Regular Bullish: Price makes a lower low, oscillator makes a higher low.
• Hidden Bullish: Price makes a higher low, oscillator makes a lower low.
• Conditions:
• Must meet minimum angle thresholds.
• Optional: Must be in oversold region (osc_src < oversold_level).
• If validate_no_cross is enabled, linearly interpolated slope must not be violated.
✅ Bearish Divergence
• Regular Bearish: Price makes a higher high, oscillator makes a lower high.
• Hidden Bearish: Price makes a lower high, oscillator makes a higher high.
• Conditions mirror the bullish case (with polarity reversed).
⸻
🖍️ Visualization
• Draws colored lines between pivots for visual clarity:
• Green: Regular Bullish
• Lime: Hidden Bullish
• Red: Regular Bearish
• Maroon: Hidden Bearish
• Uses plotshape() to mark divergence bars:
• Triangle-up for bullish
• Triangle-down for bearish
The lines and shapes help quickly identify divergence zones with strong momentum structure.
⸻
🧪 Filtering Enhancements
• No Cross Slope Filter: Checks that oscillator and price values stay above/below their respective slope lines throughout the interval.
• OB/OS Filter: Restricts divergence signals to occur only in oversold/overbought conditions for regular divergences.
• Signal Thinning: Keeps line count to 100 using array.shift() and line.delete().
⸻
🧬 Design Philosophy
• Built to mimic institutional-grade divergence detection, avoiding common false positives.
• Uses adaptive pivots, rigorous angle validation, and noise filtering.

Golden Pocket Syndicate [GPS]Golden Pocket Syndicate is a multi-layered market analysis toolkit built for precision entries and sniper-style reversals in both trending and ranging conditions. The script fuses volume dynamics, golden pocket structures, market maker behavior, and liquidation cluster tracking into one high-confluence system.
Core Features:
• 📐 Golden Pocket Zones: Dynamic GP levels from daily, weekly, monthly, and yearly timeframes. These levels update in real-time and serve as confluence zones for entries and exits.
• 📊 WaveTrend Divergence Diamonds: Momentum shifts are detected using a custom filtered WaveTrend cross system to mark high-probability reversal conditions.
• 🧠 Market Maker Premium Divergence: Tracks price dislocation between CME and Binance to detect large player manipulation using a configurable premium threshold.
• 💎 MM Reversal Diamonds: Identifies potential market maker traps and large player pivots using historical candle behavior, EMA alignment, and price structure breaks.
• 📉 Stealth Liquidation Cluster Arrows: Volume-based liquidation pressure visualized as lightweight directional arrows based on calculated wick expansion and volume bursts. Highlights key zones where price is likely to bounce or reject.
• 🧭 Trend Validation: Uses volume-based trend conditions and short-term EMA positioning to further qualify signals and eliminate noise.
How to Use:
This indicator is designed to help traders visualize confluence between key institutional price levels, momentum shifts, and volume-based pressure points. Long/short opportunities can be explored at marked reversal diamonds or liquidation zones that align with key GP levels. Intended for use on higher timeframes (15m to 4H), though flexible across any pair or market.

HMA Swing Levels [BigBeluga]An advanced swing structure and trend-following tool built on Hull Moving Average logic, designed to detect major reversals and track dynamic support/resistance zones.
This indicator analyzes price swings using pivot highs/lows and a smoothed HMA trend baseline. It highlights key reversal levels and keeps them active until breached, giving traders a clear visual framework for price structure and trend alignment. The pivots are calculated in real-time using non-lagging logic, making them highly responsive to market conditions.
🔵 CONCEPTS
Combines a fast-reacting Hull Moving Average (HMA) with pivot logic to capture precise directional changes.
Detects non-lagging reversal highs and lows when pivot points form and the HMA direction flips.
Projects these reversal levels forward as horizontal support/resistance lines until broken by price.
Active trend is shown with a step-style trail line that reflects HMA bias over time.
🔵 FEATURES
Swing Level Detection:
Identifies high/low reversals when trend direction changes and plots horizontal zones.
Non-lagging logic of swing points detection:
if h == high and high < h and change > 0
// Detected Swing High
if l == low and low > l and change < 0
// Detected Swing Low
Persistent Support & Resistance Lines:
Each detected swing high or low is extended forward until price invalidates the level. Dotted style is applied once breached.
Color-Coded Trend Trail:
Displays a stepped trend trail using HMA slope: lime = uptrend, blue = downtrend.
Automatic Labeling:
Each reversal level is labeled with its price for clear reference.
Age-Based Line Thickness:
Every level increases in thickness every 250 bars. The longer the level lasts, the stronger it is.
🔵 HOW TO USE
Use green (support) and blue (resistance) levels to frame key reaction zones.
Trade with the trend defined by the trail color: lime for bullish bias, blue for bearish.
Explore where buy or sell orders are stacked
Look for breaks of swing lines to anticipate trend shifts or breakout setups.
Adjust the "Trend Change" input to tune the sensitivity of swing detection.
Adjust the "SwingLevels" input to define how far back to search for valid pivots.
🔵 CONCLUSION
HMA Swing Levels offers a hybrid approach to structural and trend-based trading. With automated non-lagging swing detection, persistent support/resistance tracking, and intuitive HMA-based trend coloring, it provides a powerful visual system for discretionary and systematic traders alike.

HOG Liquidity HunterHOG Liquidity Hunter – Pivot‑Based Liquidity Zones
📌 Overview
Plots dynamic support and resistance zones on swing pivots with an ATR‑based buffer. Anchored only when pivots are confirmed, the zones stay close to current price levels—ideal for spotting liquidity runs or traps.
🔧 How It Works
Detects swing highs and lows using ta.pivothigh() / ta.pivotlow() with a user‑defined lookback.
After a pivot is confirmed, calculates BSL/SSL zone = pivot ± (ATR * margin).
Zones update only on confirmed pivots—no repainting on open bars.
⚙️ Inputs
Lookback: bars to confirm pivots (e.g. 10–20).
ATR Margin Multiplier: buffer width (e.g. 1.25).
✅ Benefits
Structure‑focused: Zones align with real swing points.
Responsive yet stable: Tight ATR margin keeps zones precise, only updating on valid pivots.
Clean visuals: Two uncluttered zones—easy to interpret.
🛠 How to Use
Detect near‑zone bounce entries or exits on 4H/1D charts.
Combine with trend or volume indicators for stronger setups.
Use zones to identify potential stop‑run, liquidity re‑tests, or range turns.
⚠️ Notes & Disclaimers
Zones base off historical pivots; may lag until confirmed.
No future-looking data—relying entirely on closing bar confirmation.
Use alongside a complete trading framework; this is not a standalone signal.

ICT Judas Swing | Flux Charts💎 GENERAL OVERVIEW
Introducing our new ICT Judas Swing Indicator! This indicator is built around the ICT's "Judas Swing" strategy. The strategy looks for a liquidity grab around NY 9:30 session and a Fair Value Gap for entry confirmation. For more information about the process, check the "HOW DOES IT WORK" section.
Features of the new ICT Judas Swing :
Implementation of ICT's Judas Swing Strategy
2 Different TP / SL Methods
Customizable Execution Settings
Customizable Backtesting Dashboard
Alerts for Buy, Sell, TP & SL Signals
📌 HOW DOES IT WORK ?
The strategy begins by identifying the New York session from 9:30 to 9:45 and marking recent liquidity zones. These liquidity zones are determined by locating high and low pivot points: buyside liquidity zones are identified using high pivots that haven't been invalidated, while sellside liquidity zones are found using low pivots. A break of either buyside or sellside liquidity must occur during the 9:30-9:45 session, which is interpreted as a liquidity grab by smart money. The strategy assumes that after this liquidity grab, the price will reverse and move in the opposite direction. For entry confirmation, a fair value gap (FVG) in the opposite direction of the liquidity grab is required. A buyside liquidity grab calls for a bearish FVG, while a sellside grab requires a bullish FVG. Based on the type of FVG—bullish for buys and bearish for sells—the indicator will then generate a Buy or Sell signal.
After the Buy or Sell signal, the indicator immediately draws the take-profit (TP) and stop-loss (SL) targets. The indicator has three different TP & SL modes, explained in the "Settings" section of this write-up.
You can set up alerts for entry and TP & SL signals, and also check the current performance of the indicator and adjust the settings accordingly to the current ticker using the backtesting dashboard.
🚩 UNIQUENESS
This indicator is an all-in-one suit for the ICT's Judas Swing concept. It's capable of plotting the strategy, giving signals, a backtesting dashboard and alerts feature. Different and customizable algorithm modes will help the trader fine-tune the indicator for the asset they are currently trading. Three different TP / SL modes are available to suit your needs. The backtesting dashboard allows you to see how your settings perform in the current ticker. You can also set up alerts to get informed when the strategy is executable for different tickers.
⚙️ SETTINGS
1. General Configuration
Swing Length -> The swing length for pivot detection. Higher settings will result in
FVG Detection Sensitivity -> You may select between Low, Normal, High or Extreme FVG detection sensitivity. This will essentially determine the size of the spotted FVGs, with lower sensitivies resulting in spotting bigger FVGs, and higher sensitivies resulting in spotting all sizes of FVGs.
2. TP / SL
TP / SL Method ->
a) Dynamic: The TP / SL zones will be auto-determined by the algorithm based on the Average True Range (ATR) of the current ticker.
b) Fixed : You can adjust the exact TP / SL ratios from the settings below.
Dynamic Risk -> The risk you're willing to take if "Dynamic" TP / SL Method is selected. Higher risk usually means a better winrate at the cost of losing more if the strategy fails. This setting is has a crucial effect on the performance of the indicator, as different tickers may have different volatility so the indicator may have increased performance when this setting is correctly adjusted.

Titans Trend LinesThis indicator will plot trend lines based on recent pivot highs and lows.
The pivot sensitivity level may be customised under the indicator settings. The pivot highs and lows are identified by 'H' and 'L' markers.
Through the indicator, a purple dotted line connects the last two pivot highs and another purple dotted line connects the last two pivot lows. These lines are extended to the left and right beyond the connected points.
If a new trend line has developed due to the formation of a new pivot high or low, the last trend line will be grayed to help with referencing.
The user is advised to use this indicator at his own risk.

Zig Lines with Percent & ValueOverview, Features, and Usage:
The Zig Lines with Percent & Value is an indicator that highlights the highest and lowest points of the market from pivot points and zigzag lines based on the ZigZag Period setting. By a default value of 13 for the ZigZag Period this works well on Bitcoin or other alt coins on the 1 hour or higher timeframe charts.
What makes this indicator unique is that it draws a green line to signify an uptrend or a red line to signify a down trend. It will also show the percent difference between the previous point/line, for example: If you see a -negative percentage point with a red line drawn to it, then you are looking at a low pivot point and then as the green line is drawn to a +positive percentage value the percentage you see is the difference between the two points. This is great to see a trend reversal as you can look at previous pivot points and notice about how far the price moves before it changes direction (trend reversal).
There is an invisible EMA line that is used to assist with coloring the negative vs positive values. The value above or below the percentage is the lowest or highest price at that pivot point . The display of the price at the pivot point depends on your ZigZag Period setting and the timeframe of your chart.
Added Bollinger Bands as it fits perfectly with the visuals of the Zig Lines & Pivots.
Usage of Bollinger Bands:
~As the price or candle gets close to the top or bottom of the Bollinger band it can give you a better confirmation that the pivot location is at it's final place, and the trend is more likely to switch directions.
It’s important to know this indicator should not be used for alerts of any type it does repaint as the green or red line is drawing based on live chart data and it can change depending on the direction of the market. This is a great visual tool for trend analysis or to be used with other indicators as a confirmation for a possible good entry or exit position.
Credits ( and consent to use ):
Credits go to user LonesomeTheBlue for creation of this 'Double Zig Zag with HHLL' script.
The addition of the Value above/below the Percentages is from user Noldo and that script is found here:
The Bollinger Bands setup was suggested by user countseven12 and his script that uses the same BB setup is found here:
References:
1. Chen, James. (2021 March 15). Zig Zag Indicator . Received from http: www.investopedia.com
2. Mitchell, Cory. (2021 April 30). Pivot Points . Received from http: www.investopedia.com

Pocket PivotsPocket Pivots are described in the book "Trade like an O'Neil Discipline" by Dr. Chris Kacher and Gil Morales. There’s no exact definition of Pocket Pivots, but there is an exact definition for the volume signature: The volume should be higher than the largest down volume of the last 10 trading days.
This is a modification of Pocket Pivots. We use the level where the Pocket Pivot occurred and draw a zone across the chart until the criteria for another Pocket Pivot is met again. This way we can use them as support/resistance zones. Instead of the volume being higher than the volume for each of the previous periods, we just use an SMA of the volume and make sure the volume on the final candle is higher than the average for the previous periods. Last but not least, we have the possibility to draw support/resistance levels off the back of different counts. Seven-count for hyper-aggressive pocket pivots, eight-count for aggressive, nine for measured and ten for passive.
Hyper-aggressive Pocket Pivots
Aggressive Pocket Pivots
Measured Pocket Pivots
Passive Pocket Pivots
All
Using "All" to see all the pivots can be messy, but the confluence of support/resistance is more than helpful for defining truly important levels.
People have created a methodology/rules for buying and selling with Pivot Points, but as I understand there's no general consensus on their application, so please do some research before you decide to use them in your trading.
References
www.chartmill.com
www.mypivots.com
Want to Learn?
If you'd like the opportunity to learn Pine but you have difficulty finding resources to guide you, take a look at this rudimentary list: docs.google.com
The list will be updated in the future as more people share the resources that have helped, or continue to help, them. Follow me on Twitter to keep up-to-date with the growing list of resources.
Suggestions or Questions?
Don't even kinda hesitate to forward them to me. My (metaphorical) door is always open.
Volume Profile DeltaThis indicator calculates the Volume Profile Delta (VPD). It constructs a high-resolution volume profile for each bar using intra-bar data, offering a detailed understanding of buying and selling pressure at discrete price levels.
Key Features:
Statistical Volume Profile Engine: For each bar, the indicator builds a high-resolution volume profile on a lower 'Intra-Bar Timeframe'. Instead of simple tick counting, it uses statistical models ('PDF' allocation) to distribute volume across price levels and advanced classifiers ('Dynamic' split) to determine the buy/sell pressure within that profile, providing a more nuanced delta calculation.
"Delta Candle" Visualization: The per-bar VPD is displayed as a candle, where:
Open: Always anchored at the zero line.
High/Low: Represent the peak buying (CVD High) and selling (CVD Low) pressure accumulated within that bar's profile.
Close: The final net delta value (CVD) for the bar.
Customizable Moving Average: An optional moving average of the net delta (Close) can be added. The MA type, length, and an optional Volume weighted setting are customizable.
Intra-Bar Peak Pivot Detection: Automatically identifies and plots significant turning points (pivots) in the peak buying (High) and selling (Low) pressure.
Note on Confirmation (Lag): Pivot signals are confirmed using a lookback method. A pivot is only plotted after the Pivot Right Bars input has passed, which introduces an inherent lag.
Multi-Timeframe (MTF) Capability:
MTF Output: The entire analysis (Delta Candles, MA, Pivots) can be calculated on a higher timeframe (using the Timeframe input), with standard options to handle gaps (Fill Gaps) and prevent repainting (Wait for...).
Limitation: The Pivot detection (Calculate Pivots) is disabled if a Higher Timeframe (HTF) is selected.
Integrated Alerts: Includes 8 alerts for:
The net delta crossing its moving average.
The detection of new peak buying or selling pivots.
Conditions of agreement or disagreement between the net delta and the main bar's direction.
Caution: Real-Time Data Behavior (Intra-Bar Repainting) This indicator uses high-resolution intra-bar data. As a result, the values on the current, unclosed bar (the real-time bar) will update dynamically as new intra-bar data arrives. This behavior is normal and necessary for this type of analysis. Signals should only be considered final after the main chart bar has closed.
DISCLAIMER
For Informational/Educational Use Only: This indicator is provided for informational and educational purposes only. It does not constitute financial, investment, or trading advice, nor is it a recommendation to buy or sell any asset.
Use at Your Own Risk: All trading decisions you make based on the information or signals generated by this indicator are made solely at your own risk.
No Guarantee of Performance: Past performance is not an indicator of future results. The author makes no guarantee regarding the accuracy of the signals or future profitability.
No Liability: The author shall not be held liable for any financial losses or damages incurred directly or indirectly from the use of this indicator.
Signals Are Not Recommendations: The alerts and visual signals (e.g., crossovers) generated by this tool are not direct recommendations to buy or sell. They are technical observations for your own analysis and consideration.

Volume DeltaThis indicator provides a detailed view of Volume Delta (VD) by analyzing order flow on a lower, intra-bar timeframe. For each bar on the chart, it calculates the net difference between buying and selling volume based on the direction of the intra-bar candles.
Key Features:
Intra-Bar Delta Calculation: The indicator analyzes price action on a user-defined lower timeframe ('Intra-Bar Timeframe') to construct a detailed picture of the underlying order flow for each bar on the main chart.
"Delta Candle" Visualization: The delta for each bar is shown as a candle, where:
Open: Always starts at the zero line.
High/Low: Represent the peak buying and selling pressure accumulated within the bar.
Close: The final net delta value for that bar. This visualization shows absorption, exhaustion, and conviction in a single glance.
Customizable Moving Average: An optional moving average of the net delta (Close) can be added. The MA type, length, and an optional Volume weighted setting are customizable.
Intra-Bar Peak Pivot Detection: Automatically identifies and plots significant turning points (pivots) in the peak buying (High) and selling (Low) pressure.
Note on Confirmation (Lag): Pivot signals are confirmed using a lookback method. A pivot is only plotted after the Pivot Right Bars input has passed, which introduces an inherent lag.
Multi-Timeframe (MTF) Capability:
MTF Output: The entire analysis (Delta Candles, MA, Pivots) can be calculated on a higher timeframe (using the Timeframe input), with standard options to handle gaps (Fill Gaps) and prevent repainting (Wait for...).
Limitation: The Pivot detection (Calculate Pivots) is disabled if a Higher Timeframe (HTF) is selected.
Integrated Alerts: Includes 8 alerts for:
The net delta crossing its moving average.
The detection of new peak buying or selling pivots.
Conditions of agreement or disagreement between the net delta and the main bar's direction (absolute volume).
Caution: Real-Time Data Behavior (Intra-Bar Repainting) This indicator uses high-resolution intra-bar data. As a result, the values on the current, unclosed bar (the real-time bar) will update dynamically as new intra-bar data arrives. This behavior is normal and necessary for this type of analysis. Signals should only be considered final after the main chart bar has closed.
DISCLAIMER
For Informational/Educational Use Only: This indicator is provided for informational and educational purposes only. It does not constitute financial, investment, or trading advice, nor is it a recommendation to buy or sell any asset.
Use at Your Own Risk: All trading decisions you make based on the information or signals generated by this indicator are made solely at your own risk.
No Guarantee of Performance: Past performance is not an indicator of future results. The author makes no guarantee regarding the accuracy of the signals or future profitability.
No Liability: The author shall not be held liable for any financial losses or damages incurred directly or indirectly from the use of this indicator.
Signals Are Not Recommendations: The alerts and visual signals (e.g., crossovers) generated by this tool are not direct recommendations to buy or sell. They are technical observations for your own analysis and consideration.

Inside SwingsOverview
The Inside Swings indicator identifies and visualizes "inside swing" patterns in price action. These patterns occur when price creates a series of pivots that form overlapping ranges, indicating potential consolidation or reversal zones.
What are Inside Swings?
Inside swings are specific pivot patterns where:
- HLHL Pattern: High-Low-High-Low sequence where the first high is higher than the second high, and the first low is lower than the second low
- LHLH Pattern: Low-High-Low-High sequence where the first low is lower than the second low, and the first high is higher than the second high
Here an Example
These patterns create overlapping price ranges that often act as:
- Support/Resistance zones
- Consolidation areas
- Potential reversal points
- Breakout levels
Levels From the Created Range
Input Parameters
Core Settings
- Pivot Lookback Length (default: 5): Number of bars on each side to confirm a pivot high/low
- Max Boxes (default: 100): Maximum number of patterns to display on chart
Extension Settings
- Extend Lines: Enable/disable line extensions - this extends the Extremes of the Swings to where a new Swing Started or Extended Right for the Latest Inside Swings
- Show High 1 Line: Display first high/low extension line
- Show High 2 Line: Display second high/low extension line
- Show Low 1 Line: Display first low/high extension line
- Show Low 2 Line: Display second low/high extension line
Visual Customization
Box Colors
- HLHL Box Color: Color for HLHL pattern boxes (default: green)
- HLHL Border Color: Border color for HLHL boxes
- LHLH Box Color: Color for LHLH pattern boxes (default: red)
- LHLH Border Color: Border color for LHLH boxes
Line Colors
- HLHL Line Color: Extension line color for HLHL patterns
- LHLH Line Color: Extension line color for LHLH patterns
- Line Width: Thickness of extension lines (1-5)
Pattern Detection Logic
HLHL Pattern (Bullish Inside Swing)
Condition: High1 > High2 AND Low1 < Low2
Sequence: High → Low → High → Low
Visual: Two overlapping boxes with first range encompassing second
Detection Criteria:
1. Last 4 pivots form High-Low-High-Low sequence
2. Fourth pivot (first high) > Second pivot (second high)
3. Third pivot (first low) < Last pivot (second low)
LHLH Pattern (Bearish Inside Swing)
Condition: Low1 < Low2 AND High1 > High2
Sequence: Low → High → Low → High
Visual: Two overlapping boxes with first range encompassing second
Detection Criteria:
1. Last 4 pivots form Low-High-Low-High sequence
2. Fourth pivot (first low) < Second pivot (second low)
3. Third pivot (first high) > Last pivot (second high)
Visual Elements
Boxes
- Box 1: Spans from first pivot to last pivot (larger range)
- Box 2: Spans from third pivot to last pivot (smaller range)
- Overlap: The intersection of both boxes represents the inside swing zone
Extension Lines
- High 1 Line: Horizontal line at first high/low level
- High 2 Line: Horizontal line at second high/low level
- Low 1 Line: Horizontal line at first low/high level
- Low 2 Line: Horizontal line at second low/high level
Line Extension Behavior
- Historical Patterns: Lines extend until the next pattern starts
- Latest Pattern: Lines extend to the right edge of chart
- Dynamic Updates: All lines are redrawn on each bar for accuracy
Trading Applications
Support/Resistance Levels
Inside swing levels often act as:
- Dynamic support/resistance
- Breakout confirmation levels
- Reversal entry points
Pattern Interpretation
- HLHL Patterns: Potential bullish continuation or reversal
- LHLH Patterns: Potential bearish continuation or reversal
- Overlap Zone: Key area for price interaction
Entry Strategies
1. Breakout Strategy: Enter on break above/below inside swing levels
2. Reversal Strategy: Enter on bounce from inside swing levels
3. Range Trading: Trade between inside swing levels
Technical Implementation
Data Structures
type InsideSwing
int startBar // First pivot bar
int endBar // Last pivot bar
string patternType // "HLHL" or "LHLH"
float high1 // First high/low
float low1 // First low/high
float high2 // Second high/low
float low2 // Second low/high
box box1 // First box
box box2 // Second box
line high1Line // High 1 extension line
line high2Line // High 2 extension line
line low1Line // Low 1 extension line
line low2Line // Low 2 extension line
bool isLatest // Latest pattern flag
Memory Management
- Pattern Storage: Array-based storage with automatic cleanup
- Pivot Tracking: Maintains last 4 pivots for pattern detection
- Resource Cleanup: Automatically removes oldest patterns when limit exceeded
Performance Optimization
- Duplicate Prevention: Checks for existing patterns before creation
- Efficient Redraw: Only redraws lines when necessary
- Memory Limits: Configurable maximum pattern count
Usage Tips
Best Practices
1. Combine with Volume: Use volume confirmation for breakouts
2. Multiple Timeframes: Check higher timeframes for context
3. Risk Management: Set stops beyond inside swing levels
4. Pattern Validation: Wait for confirmation before entering
Common Scenarios
- Consolidation Breakouts: Inside swings often precede significant moves
- Reversal Zones: Failed breakouts at inside swing levels
- Trend Continuation: Inside swings in trending markets
Limitations
- Lagging Indicator: Patterns form after completion
- False Signals: Not all inside swings lead to significant moves
- Market Dependent: Effectiveness varies by market conditions
Customization Options
Visual Adjustments
- Modify colors for different market conditions
- Adjust line widths for visibility
- Enable/disable specific elements
Detection Sensitivity
- Increase pivot length for smoother patterns
- Decrease for more sensitive detection
- Balance between noise and signal
Display Management
- Control maximum pattern count
- Adjust cleanup frequency
- Manage memory usage
Conclusion
The Inside Swings indicator provides a systematic approach to identifying consolidation and potential reversal zones in price action. By visualizing overlapping pivot ranges
The indicator's strength lies in its ability to:
- Identify key price levels automatically
- Provide visual context for market structure
- Offer flexible customization options
- Maintain performance through efficient memory management

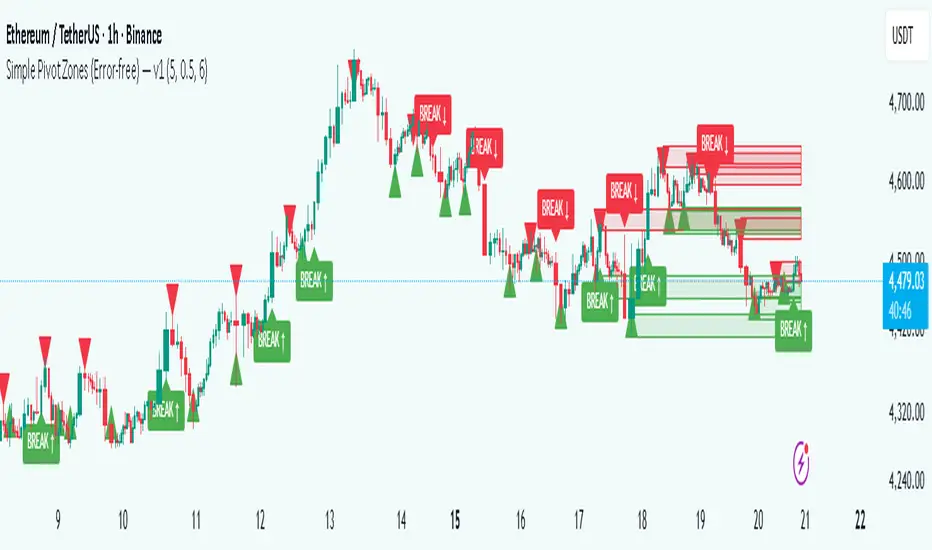
Simple Pivot Zones (Error-free) — v11. Core Idea
The indicator we built is a “pivot-based zone detector with breakout signals.”
It does three things:
1. Finds important swing highs and swing lows in price (pivots).
2. Creates support and resistance zones around those pivots using volatility (ATR).
3. Watches price action to see if those zones get broken, then gives signals.
________________________________________
2. What is a Pivot?
A pivot high happens when the price makes a local peak — a bar is higher than the bars around it.
A pivot low happens when the price makes a local dip — a bar is lower than the bars around it.
These are natural turning points in the market, showing where buyers or sellers had strong control temporarily. Traders often use them to draw support (pivot lows) and resistance (pivot highs).
________________________________________
3. Why Use ATR for Zones?
ATR (Average True Range) measures the average volatility of a market. Instead of drawing just a flat line at the pivot, we create a zone above and below it, sized according to ATR.
Example:
• If ATR is 20 points and zone size is 0.5, then the zone extends 10 points above and below the pivot level.
This turns thin “lines” into thicker areas of interest. Real markets don’t respect razor-thin levels, but zones are more realistic.
________________________________________
4. How Support & Resistance Zones Work
• Resistance zones are created at pivot highs. They mark where sellers were strong before.
• Support zones are created at pivot lows. They mark where buyers were strong before.
Over time, these zones extend forward until the price interacts with them.
________________________________________
5. Breakout Detection
The indicator checks whether the price closes beyond the last pivot high or low:
• If price closes above the last pivot high, it means buyers have broken resistance.
• If price closes below the last pivot low, it means sellers have broken support.
These moments are significant because they often trigger trend continuation.
________________________________________
6. Parameters It Uses
1. Pivot Length – how many bars to look back and forward to confirm a pivot. A higher length makes pivots less frequent but stronger.
2. ATR Length and Multiplier – defines the size of the zones (wider zones in more volatile markets).
3. Max Zones to Keep – avoids clutter by keeping only the most recent zones.
4. Colors & Styling – helps traders visually separate bullish and bearish zones.
________________________________________
7. How It Helps Traders
• Visual clarity: Instead of guessing support and resistance, the chart automatically highlights them.
• Dynamic adjustment: Zones adapt to volatility using ATR, making them useful in both calm and volatile markets.
• Breakout signals: Traders get notified when price actually breaks key levels, instead of reacting late.
• Cleaner charts: Instead of dozens of hand-drawn lines, the tool manages zones for you, deleting old ones.
________________________________________
8. The Logic in One Sentence
It finds important swing highs and lows, turns them into support/resistance zones scaled by volatility, and alerts you when the market breaks through them.
________________________________________
👉 In practice, this helps traders spot where the market is likely to bounce or break, and gives a framework to plan trades — for example, buying on bullish breakouts or selling on bearish breakouts.
________________________________________
Key Levels | Flux Charts💎 GENERAL OVERVIEW
Introducing our new Key Levels indicator! This indicator allows you to see the key levels on the current chart such as previous day lows / highs, pre-market data, yesterday's close, today's open, pivot points, and much more! It's highly user-friendly with every line being individually customizable and having a wide range of text options.
Features of the new Key Levels indicator :
Today & Yesterday High, Low, Open & Close
Previous 3-10th Day Highs & Lows
Pre-Market Highs & Lows
Previous Month High & Low
High & Low Pivots
Combination Of Same Levels
Wide Customization Options
📌 HOW DOES IT WORK ?
Key levels are important areas in a chart where a significant reaction is expected. In this indicator, you can enable up to the previous 10 days highs and lows, yesterday's close / today's open, and the latest pivot points. Key levels generally act like support & resistance. Here are a few examples :
As shown, key levels play an important role determining the current trend and can be useful in identifying potential levels where the market will reverse or breakout.
🚩UNIQUENESS
1. More Key Levels
We believe that past key levels may be as important as current ones. Some of the key-levels indicators do not include them even though strong reactions can happen around them. Thus, our indicator let's you check up to 10 days backwards.
You can select the ones you think that are the most important and just enable them, making the indicator customizable to your liking.
2. Pre-Market Data
With assets that have pre-market data available, it's crucial to analyze it to have a better understanding of the market in regular trading hours. Our indicator will plot pre-market highs and lows, even if your chart is in the regular trading hours only mode. We believe this will be helpful with your analyzing process.
3. Combination
The indicator can dynamically combine same key levels, so you can have a clear look to the chart without lines & text colliding with each other. This would also help you determine stronger key levels as if a key level occured more than a time, it could be a sign that it's a stronger one. An example :
To summarize, using key levels is an essential skill while detecting zones where strong reactions are expected. This indicator provides up to 10 day's high and low levels, and all of them can be individually turned on / off. Traders that believe older key levels can be important and want to look at the whole picture may use this feature. Also for assets that have pre-market data available, the indicator provides pre-market levels as well. Besides all that, High & Low pivots will provide latest key levels so traders can use them in their decisions.
⚙️SETTINGS
1. General Configuration
You can enable / disable :
1. Today's High / Low / Open
2. Yesterday's High / Low / Close
3. 3th-10th Day High / Low
4. Pre-Market High / Low
5. Previous Month High / Low
You can also change the colors and switch their line styles between solid, dashed and dotted.
2. High & Low Pivots
Enabled -> Enable / Disable High & Low Pivots
Pivot Range -> The range used in the detection of pivot points. Larger values will result in less pivot points, while smaller values will provide more pivot points. This essentially determines how many bars to the right & left shouldn't exceed the pivot's high or low.
You can also change the text color and text size of the pivots from the settings.
3. Style settings
Text Offset -> How many bars of offset should the texts have to the right. Increase if text collides with bars while Align Labels option is set to "Right".
Extend Lines -> If enabled, lines will be extended infinitely to right & left. If disabled, all lines will be clamped in their timelines.
Show Line Values -> If enabled, line information text will contain their price.
Align Labels ->
Right = Align line labels to right.
Center = Line labels will always be at the center of the screen.
