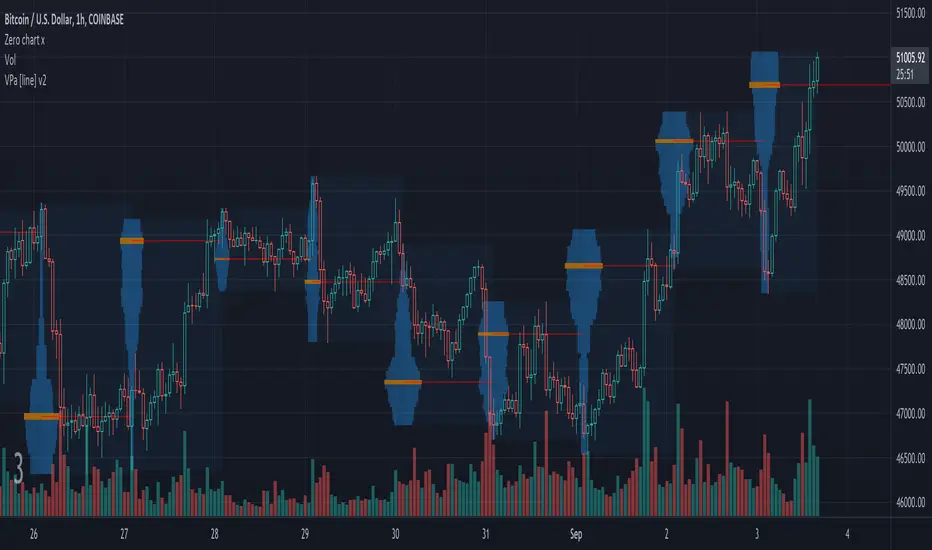
Volume Profile Regression Channel [LuxAlgo]The Volume Profile Regression Channel calculates a volume profile from an anchored linear regression channel. Users can choose the starting and ending points for the indicator calculation interval.
Like a regular volume profile, a "line" of control (LOC), value area, and a developing LOC are displayed.
🔶 SETTINGS
Sections: The number of sections the linear regression channel is divided into for the calculation of the volume profile.
Width %: Determines the length of the profile within the channel relative to the channel length.
Value Area %: Highlights the sections starting from the POC whose accumulated volume is equal to the user-defined percentage of the total profile sections volume.
🔶 USAGES
Regular volume profiles are often constructed from a horizontal price area, this can allow highlighting price areas where most trading activity takes place.
However, when price is strongly trending a classical volume profile can sometimes be more uniform. This is where using an angled volume profile can be useful.
The line of control allows highlighting the section of the channel with the most accumulated volume, this line can be used as a potential future support/resistance. This is where an angled volume profile might be the most useful.
The developing LOC highlights the LOC location at a specific time within the profile (from left to right) and can sometimes provide an estimate of the underlying trend in the price.
🔶 DETAILS
To be computed the script requires a left and right chart time coordinates. When adding the script to their charts users can determine the left and right time coordinates by clicking on the chart.
The linear regression channel width is determined so that the channel precisely encompasses the whole price.
🔶 LIMITATIONS
Using a very large calculation interval can return timeouts. Users can reduce the calculation interval to fix that issue from occurring.
The amount of drawing objects that can be used is limited, as such using a high calculation interval can display an incomplete profile.
🔶 ACKNOWLEDGEMENTS
If you are interested in these types of scripts, @HeWhoMustNotBeNamed published a similar script where users can use a custom line angle. See his 'Angled Volume Profile' script from March 2023.
Cerca negli script per "poc"

Volume Profile Matrix [LuxAlgo]The Volume Profile Matrix indicator extends from regular volume profiles by also considering calculation intervals within the calculation window rather than only dividing the calculation window in rows.
Note that this indicator is subject to repainting & back-painting, however, treating the indicator as a tool for identifying frequent points of interest can still be very useful.
🔶 SETTINGS
Lookback: Number of most recent bars used to calculate the indicator.
Columns: Number of columns (intervals) used to calculate the volume profile matrix.
Rows: Number of rows (intervals) used to calculate the volume profile matrix.
🔶 USAGE
The Volume Profile Matrix indicator can be used to obtain more information regarding liquidity on specific time intervals. Instead of simply dividing the calculation window into equidistant rows, the calculation is done through a grid.
Grid cells with trading activity occurring inside them are colored. More activity is highlighted through a gradient and by default, cells with a color that are closer to red indicate that more trading activity took place within that cell. The cell with the highest amount of trading activity is always highlighted in yellow.
Each interval (column) includes a point of control which highlights an estimate of the price level with the highest traded volume on that interval. The level with the highest traded volume of the overall grid is extended to the most recent bar.

Volume Profile Fixed Range Support and Resistance LevelsThis script is based on the excellent Volume Profile / Fixed Range indicator by @LonesomeTheBlue, so all credit for the foundations of this indicator goes to @LonesomeTheBlue
I basically made 5 instances of the original script and added horizontal lines at the beginning and end of the each Value Area. To use the script as a support and resistance tool without the Value Areas and Point of Control (POC) labels you just need to untick "Boxes" and "Labels" in the "Style" section of the “Settings”.
The default look-back periods (in bars) are 7, 30, 60, 180 and 365, but you can change this or the colour of the lines easily in the “Settings”.
The dashed lines are the respective POC.
I find this tool to be very useful for quickly identifying interest levels on any chart while also ensuring a certain amount of objectivity in your TA.
Hope you find it useful and thanks again to @LonesomeTheBlue for going through the trouble of coding this and being so generous to share it with the rest of us!
Good luck out there!

Local Model Kalman Market ModeIntroduction
Heyo guys, I made a new (repainting) indicator called Local Model Kalman Market Mode.
I created it, because I wanted a reliable market mode filter for a potential mean-reversion strategy (e. g. BB Scalping).
On the screenshot you can see an example of how to use it in a BB strategy.
E.g. you would enter long when you have bullish divergence, price is under lower BB, price is under PoC and this indicator here shows range-bound market phase.
You would exit long on cross of the middle band.
Description
The indicator attempts to model the underlying market using different local models (i.e., trending, range-bound, and choppy) and combines them using the T3 Six Pole Kalman Filter to generate an overall estimate of the market.
The Fisher Transform is applied on the price to reach a Gaussian distribution, which increases the accuracy of the indicator itself.
The script first defines state variables for each local model, which include trend direction, trend strength, upper and lower bounds of the range, volatility of the range, level of choppiness, and strength of noise.
Then, likelihood functions are defined for each local model based on the state variables.
Next, the script calculates weights for each local model based on their likelihoods and uses them to calculate state variables for the overall estimate.
Finally, the script combines the state variables using the T3 Six Pole Kalman Filter to generate the overall estimate of the market, which is plotted in blue.
Fundamental Knowledge
To understand the explanation of the indicator and the script, there are a few fundamental concepts that you need to know:
Market: A market is a place where buyers and sellers come together to exchange goods or services.
In the context of trading, the market refers to the exchange where financial instruments such as stocks, currencies, and commodities are bought and sold.
Local models: Local models are statistical models that attempt to capture the characteristics of a particular market regime.
For example, a trending market may have different characteristics than a range-bound market or a choppy market.
The indicator uses different local models to capture the different market regimes.
Trend direction and strength: The trend direction refers to the direction in which the market is moving, either up or down.
The trend strength refers to the magnitude of the trend and how likely it is to continue.
Range-bound market: A range-bound market is a market where prices are trading within a specific range, with a clear upper and lower bound.
Choppiness: Choppiness refers to the degree of irregularity in price movements, often seen in sideways or range-bound markets.
Volatility: Volatility refers to the degree of variation in the price of an asset over time. High volatility implies larger price swings, while low volatility implies smaller price swings.
Kalman filter: A Kalman filter is a mathematical algorithm used to estimate an unknown variable from a series of noisy measurements.
In the context of the indicator, the Kalman filter is used to generate an overall estimate of the market by combining the local models.
T3 Six Pole Kalman Filter: The T3 Six Pole Kalman Filter is a specific type of Kalman filter that is used to smooth and filter time-series data, such as the price data of a financial instrument.
Fisher Transform: The Fisher Transform is a mathematical formula used to transform any probability distribution into a Gaussian normal distribution. It is commonly used in technical analysis to transform non-Gaussian indicators into ones that are more suitable for statistical analysis.
By understanding these fundamental concepts, you should have a basic understanding of how the indicator works and how it generates an overall estimate of the market.
Usage
You can use this indicator on every timeframe.
Users can customize the parameters of the T3 Six Pole Kalman Filter (T3 length, alpha, beta, gamma, and delta) using input functions.
Try out different parameter combinations and use the one you like most.
Thank you for checking this out. Leave me a comment or boost the script, when you wanna support me! 👌
--
Credits to:
▪@HPotter - Fisher Transform
▪@loxx - T3
▪ChatGPT - Helped me to make the research for this indicator and helped to build the core algorithm.

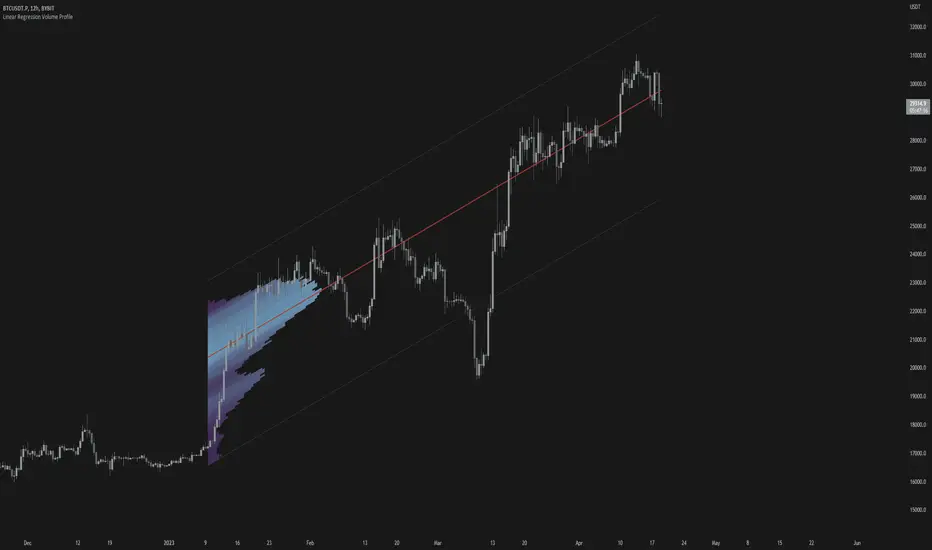
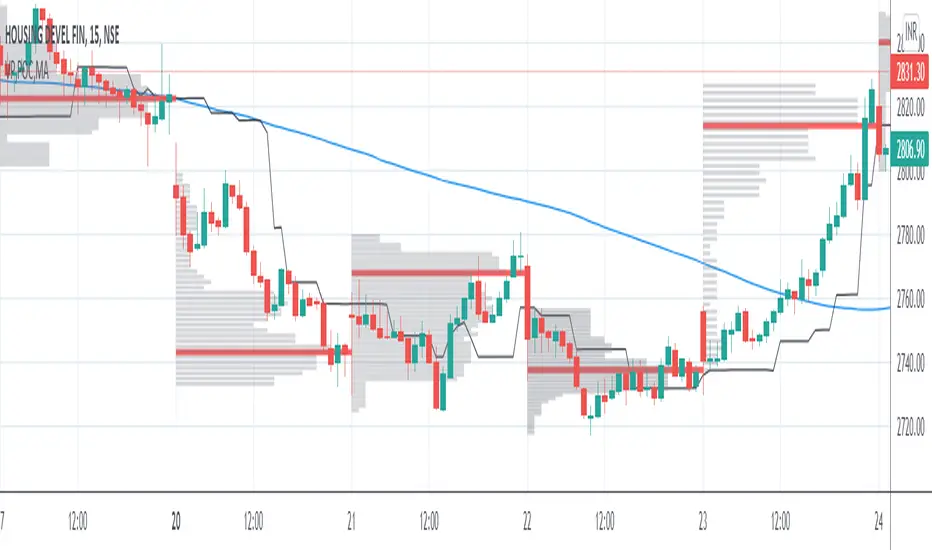
Linear Regression Volume ProfileLinear Regression Volume Profile plots the volume profile fixated on the linear regression of the lookback period rather than statically across y = 0. This helps identify potential support and resistance inside of the price channel.
Settings
Linear Regression
Linear Regression Source: the price source in which to sample when calculating the linear regression
Length: the number of bars to sample when calculating the linear regression
Deviation: the number of standard deviations away from the linear regression line to draw the upper and lower bounds
Linear Regression
Rows: the number of rows to divide the linear regression channel into when calculating the volume profile
Show Point of Control: toggle whether or not to plot the level with highest amount of volume
Usage
Similar to the traditional Linear Regression and Volume Profile this indicator is mainly to determine levels of support and resistance. One may interpret a level with high volume (i.e. point of control) to be a potential reversal point.
Details
This indicator first calculates the linear regression of the specified lookback period and, subsequently, the upper and lower bound of the linear regression channel. It then divides this channel by the specified number of rows and sums the volume that occurs in each row. The volume profile is scaled to the min and max volume.
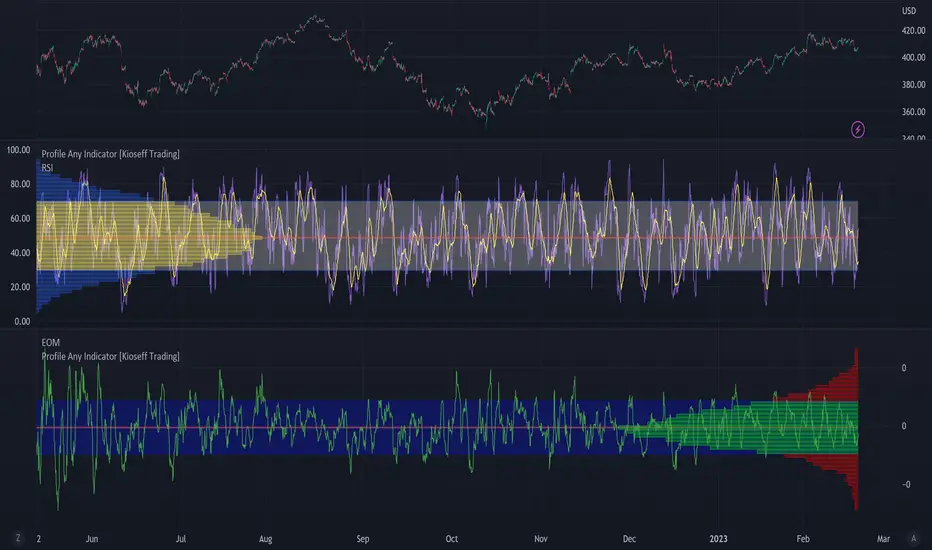
Profile Any Indicator [Kioseff Trading]Create a visible-range profile for almost any indicator!
Hello!
This script "Profile Any Indicator" allows you to create a visible-range profile for *almost* any indicator hosted on TradingView.
Therefore, the only requirement:
1. Indicator must have a retrievable plot value.
Should your indicator have a retrievable plot value (most indicators do), you can use this script to create a visible-range profile of its values!
Consequently, the profile's always oriented to the left-most or right-most side of your chart - updating as you scroll left or right.
The image above shows me using the indicator to create a profile for MACD. I am largely zoomed out and the profile has adjusted to chart orientation.
Let's zoom in and see what happens!
Voila!
The indicator adjusted to my chart positioning and created a new visible-range profile! No manual adjustments are required (:
Instructions
1. Load the indicator you'd like to profile on the chart.
The image above shows me applying the OBV indicator to the chart. Additionally, the "Profile Any Indicator" script is also loaded on the chart, instructing me to add an indicator to its settings.
2. From the settings for "Profile Any indicator", locate the "Indicator" setting and select the indicator you would like to profile.
The image above shows me selecting the OBV indicator in the settings for "Profile Any Indicator".
Once steps 1 and 2 are complete you'll have a visible-range profile for the selected indicator on your chart!
The image above shows the completion of the process.
3. Merge the indicator pane or select to plot the selected indicator in the current pane.
From here, you can select to plot the value of the selected indicator in the current pane or merge the selected indicator's pane (which must stay on the chart) with the pane designated to the "Profile Any Indicator" script.
The image above shows the two panes merged.
The image above shows the two panes separate. Alternatively, in the settings for "Profile Any Indicator", I selected to plot OBV in its pane.
You can select to populate the visible-range profile on the right of the chart!
Additionally, you can modify the POC line, value area %, and, essentially, any parameter you'd find for a volume-profile-like indicator!
Thanks for checking this out (:
BE - Pr_DayLowHigh_BreakoutScreener AlgoHerewith presenting the Screener based indicator which supports Algo trade on the NSE stocks. The idea behind this indicator is when the Current day stock breaks out of Yesterday's high or Low with promising volumes (Using MA's and POC of Volume Profile) along with formation of candle Pattern. Initiates the Trade entries.
Note: Indicator is designed to take an entry even before the candle is closed as soon as the entry level is crossed and it shall exit the trade as soon as the SL is hit even before candle is close.
How to Work with this Indicator.
You can map up to 15 Scripts in this indicator. However you may decide if you wish to load all 15 are few of them. if you wish to load only 10, below settings should help you ignore the rest 10 symbols from screening it for setups
Updating Symbol Script.
This is an important part is used for Algo trades. Read the tooltip for better understanding of the format. Acceptable format is Broker Name followed with : and space with Symbol mapping Name followed with / and Instrument token provided by broker if no token alloted for the script then you may keep 0 against symbol name followed with / and Qty in terms of absolute value or in terms of percentage.
Trade and Scan Settings
Symbol List Mapping
For Improvements in Results - Use Events and keep a track of it / use Nudges etc.

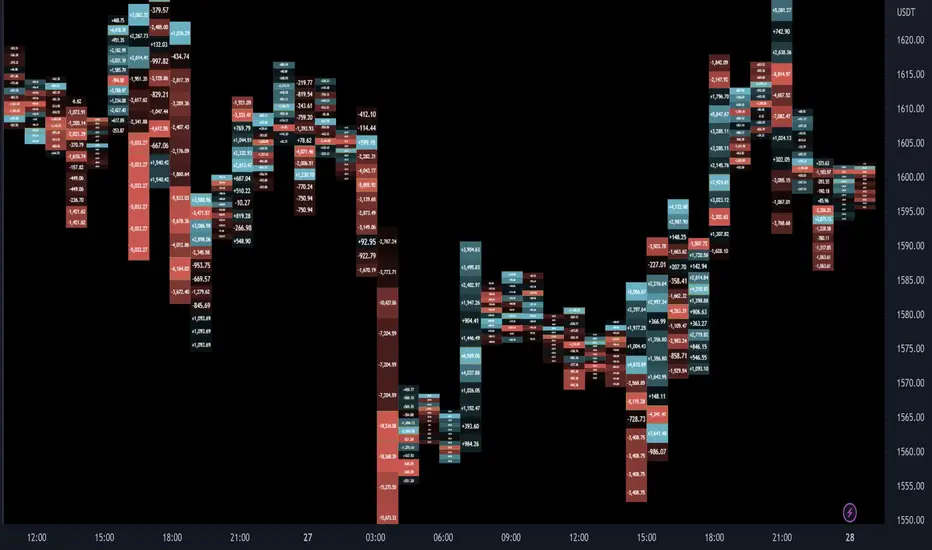
Delta Ladder [Kioseff Trading]Hello!
This script presents volume delta data in various forms!
Features
Classic mode: Volume delta boxes oriented to the right of the bar (sell closer / buy further)
On Bar mode: Volume delta boxes oriented on the bar (sell left / buy right)
Pure Ladder mode: Pure volume delta ladder
PoC highlighting
Color-coordinated delta boxes. Marginal volume differences are substantially shaded while large volume differences are lightly shaded.
Volume delta boxes can be merged and delta values removed to generate a color-only canvas reflecting vol. delta differences in price blocks.
Price bars can be split up to 497 times - allowing for greater precision.
Total volume delta for the bar and timestamp included
The image above shows Classic mode - delta blocks are oriented left/right contingent on positive/negative values!
The image above shows the same price sequence; however, delta blocks are superimposed on the price bar. Left-side blocks reflect negative delta while right-side blocks reflect positive delta! To apply this display method - select "On Bar" for the "Data Display Method" setting!
The image above shows "Pure Ladder" mode. Delta blocks remain color-coordinated; however, all delta blocks retain the same x-axis as the price bar they were calculated for!
Additionally, you can select to remove the delta values and merge the delta boxes to generate a color-based canvas indicative of volume delta at traded price levels!
The image above shows the same price sequence; however, the "Volume Assumption" setting is activated.
When active, the indicator assumes a 60/ 40 split when a level is traded at and only one metric - "buy volume" or "sell volume" is recorded. This means there shouldn't be any levels recorded where "buy volume" is greater than 0 and "sell volume" equals 0 and vice versa. While this assumption was performed arbitrarily, it may help better replicate volume delta and OI delta calculations seen on other charting platforms.
This option is configurable; you can select to have the script not assume a 60/ 40 split and instead record volume "as is" at the corresponding price level!
I plan to roll out additional features for the indicator - particularly tick-based price blocks! Stay tuned (:
Thank you!
occ3aka weighted fair price
The ultimate price source for all your stuff, unless you go completely nuts.
The ultimate way to build line charts & do pattern trading, unless you go completely nuts.
Why occ3?
You need a one-point estimate for every bar, a typical price of every bar aye? But then you see that every bar has a different distribution of prices. You can drop a stat test on every bar and pick median, mean, or whatever. But that's still prone to error (imagine borderline cases).
Instead, you can transform the task into a geometric one and say, "I wanna find the center of mass of all dem ticks within a particular interval (a day, a week, a century)". But lol ofc you won't do it, so lets's estimate it:
1) a straight line from Open to Close more/less estimates a regression line if you woulda dropped regression on all the ticks within a given interval;
2) centroid always lies on regression line, so it's always in between the endpoints of regression line. So that's why (open + close) /2;
3) Then, you remember that sequence matters, + generally the volume is higher near the close, so...;
4) Voila, (open + close + close) / 3
Why "fair" price?
Take a daily bar:
1) High & low were the best prices to sell & buy;
2) Opening & closing auctions had acceptable prices, in exchange for the the biggest potential to transact serious volume;
3) "Fair" price, logically, is somewhere in between the acceptable prices;
4) Market is fractal => the same principles propagate everywhere;
4) No, POCs and VPOCs don't make much sense as fair prices.
Nothing else to say, really advise to use it as a line chart if you trade price patterns.

TPO Letters [Kioseff Trading]Hello!
"TPO Letters" functions similarly to the script "Realtime TPO Profile"; however, TPO characters are appended to a developing bar. Simply, TPO characters display on the bar that formed them.
All colors are configurable.
The image above emphasizes functionality; TPO letters are colored on a gradient . Additionally, the value area range is shaded; characters that form within the range are gradient colored. Gray-colored characters extend beyond the value area.
The columned data displayed right of the TPO letters shows tick levels. Tick levels are shaded various colors, each color indicative of some occurrence.
Tick Levels
Red: Single Print
Yellow: POC
Lime Green: VAH or VAL
Lighter Green: Value Area Inclusive Level
Left of the TPO horizontal-axis, the aqua-colored line (blue-line inclusive) reflects the high-low range of the session; the blue-colored line reflects the initial-balance range (IBR).
You can select to color TPO letters within the IBR blue (any color).
Additionally, you can select to shade the IBR.
The image above shows auxiliary features.
Unfortunately, I'm unable to orient TPO letters at their intended tick levels using one label per bar, a contrasting feature of the "Realtime TPO Profile" script.
This means only 1000 TPO letters can be displayed simultaneously. If the number of TPO letters exceeds 1000, early-session and middle-session characters will begin to disappear. This isn't an issue for the "Realtime TPO Profile" script, as each tick level comprised one label, to which additional TPO characters were appended to the label as necessary and extended horizontally. Using this same method proved fallible for this indicator - vertical scaling is an issue. While I could append all letters formed for a bar to one label, the letters wouldn't superimpose atop their corresponding tick level (using "\n" didn't suffice).
Consequently, you'll have to, at times, rely on the label & box count oriented in the bottom-right table to see whether the number of labels & boxes transcends the upper threshold. You can hide this table at anytime (:
The image above exemplifies the "Fixed Range" portion of the indicator. A useful inclusion for the "Realtime TPO Profile" script however, while still useful for "TPO Letters", can only display 1000 TPO letters concurrently.
You can also reset the TPO profile at user-defined time intervals.
The indicator hosts an auto-calculate tick levels option; however, there will be times you'll need to manually adjust the tick levels to achieve digestible results (:
That's all! If the script would benefit from an excluded feature, or you notice an error, please let me know! Thank you (:
Shoutout to @kaigouthro for creating an exceptional library for gradient colors!! It was used in this script (:

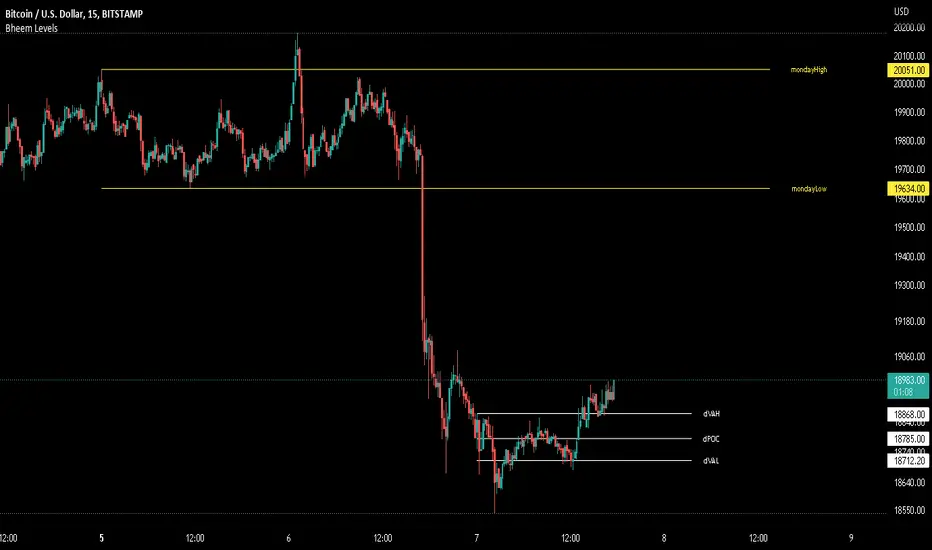
Bheem LevelsIndicator for marking certain levels where price action is respected to add confluence to trades being planned.
Includes the following options:
Open, closes, lows, highs, POC, VAL, VAH for:
day, previous Day, week, previous Week, month, previous Month.
Also includes options of:
Yearly Open, Yearly High, Yearly Low, Monday High, Monday Low.
You can customize where you want to see the value through the options of:
On the chart, On the price scale, Both, None.
This indicator does not serve the purpose of being independently used as a trade decider. It use to be used as a source of adding confluence to your setups just like we use Finocchi retracements.
Futures Full FS ScreenerFull FS Screener
This indicator allows traders to have a view of multiple pairs and timeframes buy/sell signals and specific information of parameters, based on the Futures FS Indicator also developed by me.
Futures FS Indicator Fundamentals
1. Exponential Moving Average (EMAs): The base indicator is composed of moving averages of 5, 10, 11, 13, 36 and 55 exponential periods.
2. Squeeze Momentum: This indicator allows the signals to go with the trend and not against it.
3. VPVR (Volume Profile Visible Range): It allows to determine the Point of Control (POC) which is the node with the highest volume profile. This can be used as an important retest point or to calculate potential support and resistance.
4. ADX (Average Directional Index): The ADX helps the indicator to estimate the strength of the movement, always considering the DI+ and DI- to not go against the trend.
5. RSI (Relative Strength Index): The RSI helps measuring the speed and magnitude of the recent price changes to evaluate overvalued or undervalued conditions in the price of that security. The indicator considers RSI 5, 13 and 50 as bottom and top, respectively.
6. MACD (Moving average convergence divergence): The MACD is a trend-following momentum indicator that shows the relationship between moving averages. The indicator uses moving averages of 5, 8 and 21).
7. The trend is determined according to these parameters and their different values, which might indicate that we are in a bullish or bearish trend. The trend has a max positive (bullish) value of 6 and a max negative (bearish) value of -6.
Full Screener Panel
This panel allows the trader to monitor multiple pairs at a single screen, giving an immediate vision of possible entries and exits (Long/Short/Strong Long/Strong Short Signals). Moreover, allows traders to have handy all information of the Future FS Indicator that might be analyzed further for each pair. It has the following characteristics:
• It can be placed anywhere on the screen through the main menu of the indicator.
• It can be combined with the same indicator multiple times, as per screener is limited to show 40 pairs, you can select the number of panels being added to adjust position one next to each other.
• It strengthens colors when a pair has changed its signals in order to the trader to know immediate changes and then do the follow up
• The screener shows the pairs, which can be changed within the menus.
• The screener shows the Long, Short, Strong Long and Strong Short Signals in its las column but previously, it shows the parameters that determined the possible position. Therefore, the EMAs, SQZ, ADX, VPVR, RSI and MACD calculated internally, are also summarized in the screener.
For analyzing a specific pair, refer to the TwV Futures Indicator – FS, which is other indicator that might be on my TradingView Profile and that was used as base for the screener.

Futures Simple FS ScreenerSimple FS Screener
This indicator allows traders to have a simple view of multiple pairs and timeframe buy/sell signals, based on the Futures FS Indicator also developed by me.
Futures FS Indicator Fundamentals
1. Exponential Moving Average (EMAs): The base indicator is composed of moving averages of 5, 10, 11, 13, 36 and 55 exponential periods.
2. Squeeze Momentum: This indicator allows the signals to go with the trend and not against it.
3. VPVR (Volume Profile Visible Range): It allows to determine the Point of Control (POC) which is the node with the highest volume profile. This can be used as an important retest point or to calculate potential support and resistance.
4. ADX (Average Directional Index): The ADX helps the indicator to estimate the strength of the movement, always considering the DI+ and DI- to not go against the trend.
5. RSI (Relative Strength Index): The RSI helps measuring the speed and magnitude of the recent price changes to evaluate overvalued or undervalued conditions in the price of that security. The indicator considers RSI 5, 13 and 50 as bottom and top, respectively.
6. MACD (Moving average convergence divergence): The MACD is a trend-following momentum indicator that shows the relationship between moving averages. The indicator uses moving averages of 5, 8 and 21).
Simple Screener Panel
This panel allows the trader to monitor multiple pairs at a single screen, giving an immediate vision of possible entries and exits (Long/Short/Strong Long/Strong Short Signals). It has the following characteristics:
It can be placed anywhere on the screen through the main menu of the indicator.
It can be combined with the same indicator multiple times, as per screener is limited to show 40 pairs, you can select the number of panels being added to adjust position one next to each other.
It strengthens colors when a pair has changed its signals in order to the trader to know immediate changes and then do the follow up
The screener shows the pairs (which can be changed within the menus) and as part of being the simple screener it shows the Long, Short, Strong Long and Strong Short Signals. Therefore, the EMAs, SQZ, ADX, VPVR, RSI and MACD are calculated internally and its data will not be shown.
For viewing all parameters, refer to the Futures FS Full Screener or the TwV Futures Indicator – FS, which are other indicators that might be on my TradingView Profile

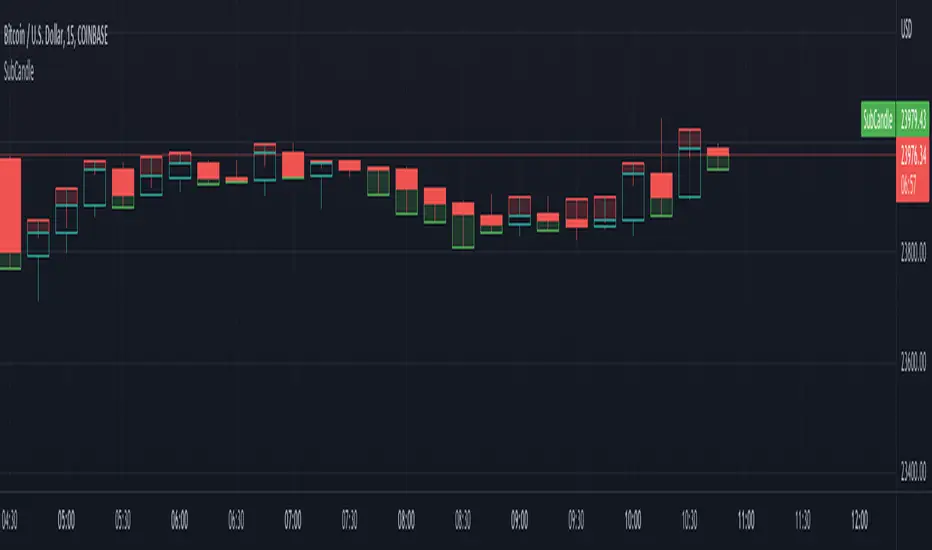
SubCandleI created this script as POC to handle specific cases where not having tick data on historical bars create repainting. Happy to share if this serves purpose for other coders.
What is the function of this script?
Script plots a sub-candle which is remainder of candle after forming the latest peak.
Higher body of Sub-candle refers to strong retracement of price from its latest peak. Color of the sub-candle defines the direction of retracement.
Higher wick of Sub-candle refers to higher push in the direction of original candle. Meaning, after price reaching its peak, price retraced but could not hold.
Here is a screenshot with explanation to visualise the concept:
Settings
There is only one setting which is number of backtest bars. Lower timeframe resolution which is used for calculating the Sub-candle uses this number to automatically calculate maximum possible lower timeframe so that all the required backtest windows are covered without having any issue.
We need to keep in mind that max available lower timeframe bars is 100,000. Hence, with 5000 backtest bars, lower timeframe resolution can be about 20 (100000/5000) times lesser than that of regular chart timeframe. We need to also keep in mind that minimum resolution available as part of security_lower_tf is 1 minute. Hence, it is not advisable to use this script for chart timeframes less than 15 mins.
Application
I have been facing this issue in pattern recognition scripts where patterns are formed using high/low prices but entry and targets are calculated based on the opposite side (low/high). It becomes tricky during extreme bars to identify entry conditions based on just the opposite peak because, the candle might have originated from it before identifying the pattern and might have never reached same peak after forming the pattern. Due to lack of tick data on historical bars, we cannot use close price to measure such conditions. This leads to repaint and few unexpected results. I am intending to use this method to overcome the issue up-to some extent.
Self-Optimizing RSI Strategy [Kioseff Trading]Hello!
Introducing the Self-Optimizing RSI Strategy.
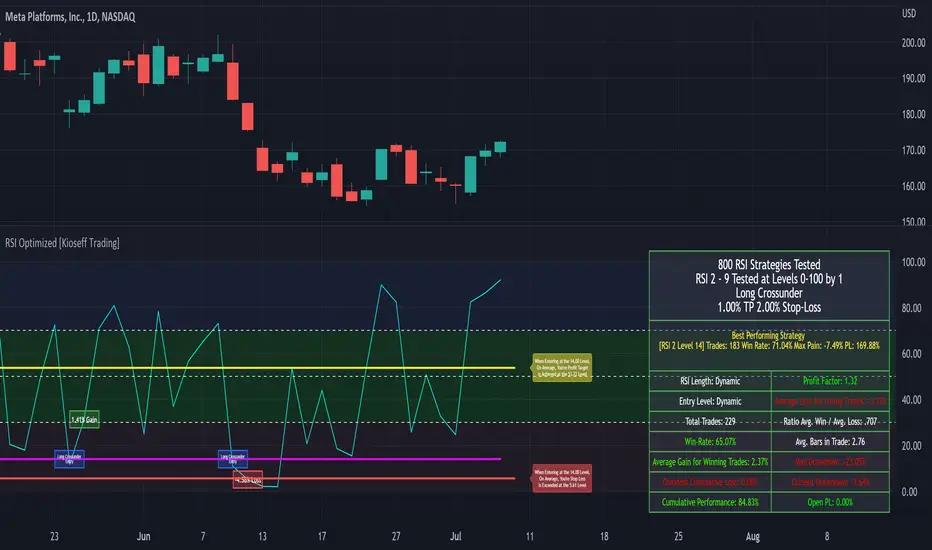
The indicator tests up to 800 RSI strategies simultaneously, looping through arrays, and auto plots the best performing parameter set.
The image above shows the result of 800 RSI strategies concurrently.
The table oriented bottom right shows the performance and risk metrics of the best performing RSI system tested across the bar set. Additionally, the conditions for entry and exit are displayed; for the image - a long entry system predicated on RSI crossunders and exit system predicated on a 1% TP and 2% SL are shown.
The indicator calculates numerous risk and performance metrics.
Calculated metrics include:
RSI Parameters
RSI Cross Entry Level
Total Trades
Win Rate
Avg. Gain for Winning Trades
Max Pain
PnL (Cumulative Performance)
Profit Factor
Avg. Loss for Losing Trades
Ratio Avg. Win / Avg. Loss
Avg. Bars in Trade
Max Drawdown
Current Drawdown
Open Position PnL
"Dynamic" indicates the performance of self-optimizing RSI system was tested.
The image above shows the performance of the greatest-performing RSI system - a fixed set of parameters - when adhering to a 1% TP and 2% fixed SL.
Trailing Stops and Profit-Taking Limit orders can be set/simulated.
The image above shows a dynamic entry level - plotted as a purple, non-transparent line.
The entry level "self-optimizes" to mimic the best performing RSI system at current time.
The image above exemplifies the functionality for all horizontal lines plotted on the chart.
The average RSI level achieved subsequent a profitable trade is shown.
The average RSI level achieved subsequent a losing trade is shown.
The entry level for RSI crossunders/crossovers is shown.
The image above show the Self-Optimizing RSI indicator recording entries & exits; gains & losses, for each executed trade.
You can "verify" trades manually.
Blue boxes reflect an entered position.
Green boxes reflect a closed, profitable trade.
Red boxes reflect a close, losing trade.
The percentage gain for a profitable trade is appended to green boxes; the percentage loss for a losing trade is appended to red boxes.
The Self-Optimizing RSI indicator plots off the chart; however, percentage gains/losses are measured against price, not RSI.
Boxes correlate to the interval a trade was entered/exited on.
The indicator hosts various methods to filter the outcome for testing.
For instance, you can:
Use trailing stops or fixed stop losses
Test RSI crossunders and crossovers
Configure the RSI settings that are tested (i.e. RSI 2 - 9, RSI 14 - 20, RSI 50 - 57)
Test short-based RSI Systems and long-based RSI systems
Simulate limit orders (Exit intrabar at fixed stop losses or trailing stop losses; exit intrabar at profit targets)
Require all tested RSIs to trend above or below their respective average (i.e. all RSIs must trend above/below their 50-interval EMA values. SMAs can also be used)
Use external indicators and require a user-defined value be exceeded, measured below, or that price exceed or measure below an indicator. The Self-Optimizing RSI indicator incorporates a few built-in technical indicators - ADX, %k, MFI, CMFI, and RSI. Consequently, you can require these indicators to measure above/below a specified level prior to entry. Additionally, you can supplement an extrinsic indicator (anything custom coded with plot values) to the entry logic for the Self-Optimizing RSI indicator. I'll show an example shortly.
Adjust the time window that's tested.
Adjust PT and SL percentages.
Override plot an RSI system to procure thorough statistics.
Require a symbol to measure above/Below or equal to a particular price level to “validate” a Long/Short entry signal. You can retrieve any data hosted by TradingView and require it measure above/below a user-defined level prior to entry. For instance, you can select "$VIX", and require the ticker to measure less than $30 prior to long/short entry. If "$VIX" measures greater than $30 prior to a long/short signal the position will not open. Alternatively, you can require a symbol to measure above a user-defined price prior to entry. If the retrieved ticker doesn't measure above the user-defined level prior to entry a trade will not open.
Use trailing stops or fixed stop losses
The image above shows results for 800 short-based RSI systems - using a trailing stop loss.
Test RSI crossunders and crossovers
The image shows results for 800 long-based RSI systems. Positions are entered subsequent to RSI crossovers.
You can select which RSI strategies are tested - you aren't not limited to testing RSI 2 - RSI 9 (:
Simulate limit orders (Exit intrabar at fixed stop losses or trailing stop losses; exit intrabar at profit targets)
The image above shows performance test results when exiting during the interval subsequent to the profit target being exceeded.
The image above shows performance test results when exiting during the interval subsequent to the stop loss being exceeded.
Require all tested RSIs to trend above or below their respective average (i.e. all RSIs must trend above/below their 50-interval EMA values. SMAs can also be used)
The image above shows an RSI EMA in addition to prerequisite condition. For each RSI strategy tested, the RSI used for the strategy must measure above an EMA of its values prior to entry. You can require RSI to measure below an EMA of its values prior to entry, use an SMA, and change the length of the MA used.
Use external indicators and require a user-defined value be exceeded, measured below, or that price exceed or measure below an indicator. The Self-Optimizing RSI indicator incorporates a few built-in technical indicators - ADX, %k, MFI, CMFI, and RSI. Consequently, you can require these indicators to measure above/below a specified level prior to entry. Additionally, you can supplement an extrinsic indicator (anything custom coded with plot values) to the entry logic for the Self-Optimizing RSI indicator. I'll show an example shortly.
The image above shows me requiring the ADX indicator to measure above "20" prior to long entry. Any of the built-indicators can be used with similar conditions; you can implement a custom-coded indicator for trade logic.
Additionally, you can supplement an extrinsic indicator (anything custom coded with plot values) to the entry logic for the Self-Optimizing RSI indicator.
The image above shows me retrieving the value for Volume Profile Point of Control - a TradingView coded indicator.
Consequently, I can require price to measure above/below the session's Poc prior to RSI long/short entry.
You can use this feature with any custom coded indicator providing historical plot values - something you or a favored author have coded.
]Adjust PT and SL percentages
The image above shows adjusted TP & SL percentages - optimize and reward/risk ratio you'd like (:
Override plot an RSI system to procure thorough statistics.
The image above shows manually plotted RSI parameters and a corresponding stat sheet.
Require a symbol to measure above/Below or equal to a particular price level to “validate” a Long/Short entry signal. You can retrieve any data hosted by TradingView and require it measure above/below a user-defined level prior to entry. For instance, you can select "$VIX", and require the ticker to measure less than $30 prior to long/short entry. If "$VIX" measures greater than $30 prior to a long/short signal the position will not open. Alternatively, you can require a symbol to measure above a user-defined price prior to entry. If the retrieved ticker doesn't measure above the user-defined level prior to entry a trade will not open.
The image above shows me requiring the ticker "$VIX" to measure below $30 prior to long/short entry. If %VIS measures greater than $30 when a long/short signal triggers a position will not be opened. Further refine your trading system with this feature - exploit correlations.
Adjust the time window that's tested.
The image above shows configurable start and end dates for the optimization period.
You won't be able to test 800 RSI strategies concomitantly on a 20,000 bar data set.
Consequently, for large data sets (intrasession data) you will have to narrow the optimization window to test a larger number of combinations.
You can test 80 (loads on all data sets), 144 (loads on all data sets), 264 (loads on ~15,000 bar data sets), 312 (loads on ~11,500 bar data sets) and 800 (loads on ~4950 bar data sets)combinations simultaneously. You can test 800 RSI strategies simultaneously on intrasession data; however, you'll likely have to narrow the tested time window.
I recently published a bar count script titled "Bar Count for Backtesting", you can access the script here:
The above script is useful for quickly calculating the number of bars in a time window, or the date for a bar that is "x" number of bars back. Therefore, implementing these scripts cooperatively should improve date selection efficiency (not arbitrarily selecting test start & end dates that fail to load).
I included a tool tip describing the near-maximum bars in a data set that the higher numbers of simultaneous RSI strategies can be tested on.
More to come; enjoy!
(P.S. The script uses private libraries and, consequently, is unable to be published open source)
An optimization script is best implemented to discover what won't work, not what will work. The best performing "optimized" parameters are not a guaranteed profitable investment system. While we may see an exceptionally positive performance for a set of parameters, it's impossible to know how much of that performance is the beneficiary of market noise in the absence of additional testing. Most market moves are noise - irreplicable sequences that offer no predictive utility - and most "good" backtests overwhelmingly benefit from these irreplicable sequences. An investor unfamiliar with this concept may be lead to believe they have found a valid correlation between an indicator sequence and subsequent price movement, despite the correlation being illusory.
Consequently, it should be assumed that the best performing parameters strongly benefitted from market noise and will not work in a live market - until further rigorous statistical tests are performed on an investment system built around the best performing parameters. This includes out-of-sample, in-sample, and forward testing in addition to testing negatively correlated, positively correlated and zero-correlation assets; testing additional assets should be treated as prerequisite to live implementation.
Of course, all trading strategies, even one's that methodically exploit a valid correlation/replicable sequence, will benefit from market noise - it's impossible to avoid. However, a "legit" trading strategy has a chance to work on future price data, while an overoptimized strategy will fail miserably on new price data!
An overoptimized strategy is virtually guaranteed to have a better backtest performance than a valid strategy. The overoptimized strategy will fail in a live market while the valid strategy has a chance of working. So, should you notice the best performing RSI parameters, be sure to build a comprehensive trading system around the parameters and perform additional tests. This is the only way to know if the optimized parameters will truly work in a live market!
Unfortunately, they often will not!
This publication does not constitute investment advice.
Easy FootprintThis script represents a simple footprint system which can currently be applied on time based candles only.
Options:
Display Bid/Ask volumes at price
Display horizontal delta at price
Highlight Buuying/Selling/Both imbalances at price (default, green, red or orange(both) background color)
Highlight the POC of the current candle (yellow cell border)
Display the current candle
Parameters:
Imbalance threshold: Minimal proportion to highlight cells in case of buying/selling imbalances (2=200% , 3=300%, etc...)
Text size: Just a display option to select the size of the text in cells
Price truncation factor: Allows the user to configure the size of each cell (default factor 0 is 1pts, factor 1 is 0.1 pts, factor 2 is 0.01 pts, factor -1 is 10 pts, etc...)
Volume decimals: Select the precision you want to see in volume information
Enable display of bid/ask volume at price
Enable display of horizontal delta at price
Note :
Some cells might be missing within a candle when gaps appear

Volume spread analysis V1 (RT)Volume Spread Analysis is a method used by professional traders to identify the Smart money's activities (Institutional Traders) in the markets based on Price and Volume data. and it is considered to be one of the best technical analysis compared to all forms of trading since it is not prone to smart money manipulation but the method itself is to identify the smart money's activity in any markets.
Volume plays an important role in trading since it is used to identify the Smart trader's activity in the markets and it can play a crucial role when it comes to identifying accurate Chart patterns and levels with entries and exits.
Important Features included in this indicator:-
1. Volume Spread Analysis signals to identify SOS (Signal of strength) and SOW (Signal of weakness).
2. Potential Volume zones to identify important levels of Smart money.
3. Gap up and Gap Down Levels to identify the irregular gaps and corrections in the markets.
4. Added Historic signals and other parameter options in the settings.
5. Effort VS Result Option included.
6. Volume Waves, Also known as Cumulative Volume to identify Effort vs result and Buyers/Seller's Activity in the markets.
7. Multiple Options to change the colors of various indicators included.
8. The indicator also consists VWAP option which can be used as POC on Day Trading.
Please note that this indicator will be developed with time as we will constantly be adding more VSA signals in the upcoming days and we are constantly working on the quality of the indicator.
YouTube:- www.youtube.com
Feel Free to reach us via our WhatsApp number +91 9964982366 and provide us with your valuable feedback and ideas for the development of our indicators.
SpaceTime RemasteredSpaceTime Remastered
SpaceTime Remastered provides a new code base for TPO Calculations. Significantly enhanced and some differences justifying leaving both choices for users to choose between. Using the PineV5 library, providing the ability to create a profile of price and time.
The main advantage is now being able to run multiple sessions simultaneously whilst also being more efficient. This has allowed for synchronous data generation for multi profile uses and still executing at a faster speed. Additionally this has given the rise to London, New York and Asia sessions as options with this new knowledge in mind. However, the sessions can be utilised beyond this in the form of D,W,M at the same time as an example with a multitude of possible combinations up to the users interest.
Tick for the multiple sessions to determine the segmented data generation of the TPO, can be split between the sessions and work independently of one another. This tick is vital alongside time and price. The generation of this tool can be used to highlight trending and ranging conditions and opportunities to spot both can be used to take trades, e.g. using value migration in use of trend development.
The release of the AutoTick improvements is significant as well providing more consistency and less affected reaction to the volatility in its calculation leading to a more accurate profile tool. AutoTick is a global controller and will handle tick generation for any enabled session.
The words and their abbreviation plus key.
POC: Point Of Control
VA: Value Area
SP: Single Print
EXS: Excess *sell or buy tail
PHL: Poor High/Low
TPO: Time Price Opportunity
N = Naked e.g. NPOC Naked Point of Control
D = Developing e.g. DVA Developing Value Area
VAStyles and POCStyles exist to better customise the representation of datak,
Show Text Data is toggleable to give the text representation of key inflection points and data. TPO Count, TickSize used, Excess location boundaries, Single Print Location Boundaries.
Display modes exist for All data, VA + Levels and Levels up to the users choosing.
Session timings are adjustable.
ToDo:
Add Initial balance if requested.
Add User Settings for select members of the community.
Add TPO lettering, delayed as mostly unused in predecessor.
Add Rotation Factor

Key Levels Importer (blockFlow)Introduction
This script was inspired by the Chart Champions team who generously share the key levels that they are monitoring with the group.
It provides a way for TradingView users to import the levels from a text file (known as the “dataset”) which can also be shared with the community.
The script will plot the levels with different colours depending on whether they are daily, weekly, monthly. volume or fibs.
It will also calculate and draw the high/low for the previous day.
The dataset
The format for the dataset is as follows:
:=::
The type value can be:
D - Daily level
W - Weekly level
M- Monthly level
V - Volume level (eg. VAH, POC, VAL)
F - Fib level
Alternatively you can use freeform text for the type but it may not be colour-coded as you wish
Note, lines and fields without an “=“ are ignored.
Example dataset
:#BTCUSD
:
:---------------------------
:Daily levels
:---------------------------
:
:D=57220:
:D=47724:
:D=40711:
:D=38190:
:D=29775.5:
:
:---------------------------
:Weekly levels
:---------------------------
:
:W=65560.5:
:W=50776:
:W=43190:
:W=31773:
:
:---------------------------
:Monthly levels
:---------------------------
:
:M=61421.5:
:M=43800:
:M=35027:
:
:---------------------------
:Fib levels MTF/HTF
:---------------------------
:
:F=59693.5:
:F=58521.5:
:F=44180.5:
:F=42481.5:
:F=28773:
:F=25984:
:
:---------------------------
:Other levels
:---------------------------
:
:nPOC=47980.5:
:nPOC=48340:
:Global_VAH=63775:
:Global_POC=57364.5:
:Global_VAL=40217:
:MTF_POC=47174:
:MTF_POC=34125.5:
How to import the dataset
It is recommended to create the dataset with a text editor.
To import it:
Open the indicator settings
Click the ‘Import Dataset’ field, press Control-A and Delete to clear out the contents
Copy/paste the dataset into the field
Click Ok
Additional settings
You can choose the line colour for each type of level
Show imported datarows - Check this box to displays the imported dataset values in tabular format on the bottom-left of the chart
Show yellow dots - Show yellow diamonds when price touches a level - see alerting below.
Hide levels > N% from current price - Levels more than 20% away from the current price will be hidden if this box is checked. The percentage value can be changed.
Alerting
The script can raise alerts when the price touches any of the levels.
This is visually represented on the chart by a yellow dot when the "show yellow dots option" is checked.
To avoid duplicate alerts when price repeatedly touches the level, the following criteria must be satisfied before an alert is raised (or a yellow dot printed).
1) Price first touches the level (open,high,low or close)
2) Price did not touch the level in the previous 10 candles

Volume Profile Auto [line]This project is about:
- VPSV
- array.new_line()
- array.new_box()
VPSV (pine) is one of the rare features that draws lines/figures BETWEEN bars
It doesn't run on Pine script, which makes it possible to do such things.
I wanted to have something similar while a restriction of Pine script is the impossibility to draw between bars, the only way I could think of is by using line width
In this script the higher timeframe is started with several lines (left) and a box, this box goes further until the higher timeframe ends.
During the creation of the box, each candle (lower timeframe) in this box (higher timeframe - period) is checked for position and volume, the volume is added to the left line, so when you see a thicker line, this means at that level there is more volume traded.
One of the big differences with other volume profiles is that many look back to a previous period, here when a period starts, the lines collect data - volume until the period ends, it is especially very visible in very low TF's (seconds)
This is my first script with array.new_line() - array.new_box(), which is a very nice Pine feature!
I hope this script can be helpful to see the possibilities
Settings:
'Parts' -> amount of lines (left of box)
5 Parts:
15 Parts:
25 Parts:
50 Parts:
'Max Width' -> Sets the max width of the lines
'Automatic Settings' -> Sets the higher time frame automatically, see the tooltip ⓘ for more info
The yellow line is the max volume line of that period, last period has a red line (POC), also referring the max.
Cheers!
VP and POCThis code is credited to juliangonzaconde. Have taken his help to modify his beautiful creation.
Volume profile is a key study when comes to understanding the auction trading process. Volume Profiles will show you exactly how much volume, as well as relative volume, occurred at each price as well as the exact number of contracts for the entire session. It is a visualization tool to understand the high activity zone and low activity zone.
Volume profile measures the confidence of the traders in the market. From short term trading perspective monitoring the developing volume profile in realtime make more sense to track current market participation behavior to take better trading decisions.
Hope this helps you in trading on daily timeframe.
Happy Trading.
Volume Profile / Fixed RangeHello All,
This script calculates and shows Volume Profile for the fixed range . Recently we have box.new() feature in Pine Language and it's used in this script as an example. Thanks to Pine Team and Tradingview!..
Sell/Buy volumes are calculated approximately!.
Options:
"Number of Bars" : Number of the bars that volume profile will be calculated/shown
"Row Size" : Number of the Rows
"Value Area Volume % " : the percent for Value Area
and there are other options for coloring and POC line style
Enjoy!

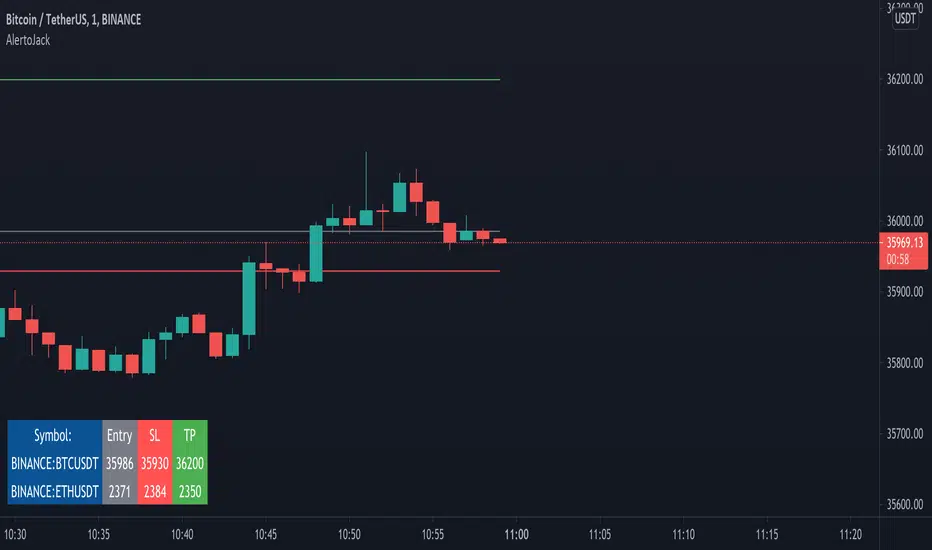
AlertoJack AlertoJack
v0.1a
coded by Bogdan Vaida
This indicator was created to provide easily defined alerts on multiple symbols.
It's still POC code.
Usage:
- Add it on any coin,
- The chart timeframe will be the timeframe for the alerts;
- Configure it with the symbols you want to be alerted on,
- Add the prices to be alerted for,
- Use Add Alert -> condition AlertoJack -> "Any alert() function call"
- Check the Alerts log.
Notes:
- Alert happens when candle crosses the price.
- Because of how Trading View functions, if you modify the indicator settings
you'll need to add the alerts again (because an alert uses the code version
it was created from).
- The alert runs once per current bar's timeframe (e.g. once per minute
if you're on the 1m).