Trend Signals with TP & SL [UAlgo]The "Trend Signals with TP & SL " indicator is a versatile tool designed to assist traders in identifying potential trend continuation opportunities within financial markets Utilizing a combination of technical indicators and user-defined parameters, this indicator aims to provide clear and actionable signals to aid traders in making informed trading decisions.
🔶 Features:
Trend Continuation Signals : The indicator generates signals to identify potential trend continuation points based on the input parameters such as sensitivity, ATR length, and cloud moving average length.
Take-Profit and Stop-Loss Levels: It calculates and plots three levels of take-profit (1R, 2R, 3R) and stop-loss levels based on the entry price of the trade.
Short Position Example:
Long Position Example:
Visualization: The script visualizes the trend signals, entry points, take-profit levels, and stop-loss levels on the price chart, making it easier for traders to interpret the signals.
Alert System: The indicator includes an alert system that notifies the user when there is a change in trend direction or when a buy/sell signal is generated. The alerts provide essential information such as entry price, take-profit levels, and stop-loss levels.
🔶 Calculations :
Trend Calculation: Trend signals are determined based on the comparison between the current closing price and the upper and lower bounds calculated using the Average True Range (ATR) multiplied by a sensitivity factor. A trend is considered bullish if the closing price is above the upper bound and bearish if it's below the lower bound.
Entry, Stop Loss, and Take Profit Calculation: Entry points for long and short positions are identified when there's a change in trend direction.
Stop-loss levels are calculated as a percentage of the entry price, where users can define the percentage based on their risk tolerance.
Take-profit levels are calculated as multiples of the stop-loss level (1R, 2R, 3R).
Cloud Moving Averages: Simple moving averages (SMAs) are calculated for high and low prices over a specified period to create a "cloud" visualization on the chart.
MACD Clouds: Moving Average Convergence Divergence (MACD) indicator is used to determine the market's momentum and trend direction. Positive and negative clouds are plotted based on the MACD line and its signal line, indicating potential bullish or bearish trends.
Signal Generation: Buy and sell signals are generated based on specific conditions such as RSI, CMO (Chande Momentum Oscillator), and pivot points.
Signals are triggered when certain criteria are met, indicating potential opportunities for entering or exiting trades.
🔶 Disclaimer:
Use at Your Own Risk: Trading involves significant risk, and this script is provided for educational and informational purposes only. It does not guarantee profitable trades, and users should exercise caution and perform their own analysis before making trading decisions.
Parameter Sensitivity: The effectiveness of the indicator may vary depending on the chosen parameters, market conditions, and timeframe. Users are encouraged to backtest the script thoroughly and adjust the parameters according to their trading preferences.
Not Financial Advice: The information provided by this script should not be considered as financial advice. Users are solely responsible for their trading decisions and should consult with a qualified financial advisor if needed.
Backtesting and Validation: Before implementing this indicator in live trading, users are strongly encouraged to conduct rigorous backtesting and validation to assess its performance under various market conditions. Past performance is not indicative of future results, and users should carefully evaluate the effectiveness of the indicator based on their individual trading preferences and risk tolerance.
Cerca negli script per "profitable"

TTP Intelligent AccumulatorThe intelligent accumulator is a proof of concept strategy. A hybrid between a recurring buy and TA-based entries and exits.
Distribute the amount of equity and add to your position as long as the TA condition is valid.
Use the exit TA condition to define your exit strategy.
Decide between adding only into losing positions to average down or take a riskier approach by allowing to add into a winning position as well.
Take full profit or distribute your exit into multiple take profit exists of the same size.
You can also decide if you allow your exit conditions to close your position in a loss or require a minimum take profit %.
The strategy includes a default built-in TA conditions just for showcasing the idea but the final intent of this script is to delegate the TA entries and exists to external sources.
The internal conditions use RSI length 7 crossing below the BB with std 1 for entries and above for exits.
To control the number of orders use the properties from settings:
- adjust the pyramiding
- adjust the percentage of equity
- make sure that pyramiding * % equity equals 100 to prevent over use of equity (unless using leverage)
The script is designed as an alternative to daily or weekly recurring buys but depending on the accuracy of your TA conditions it might prove profitable also in lower timeframes.
The reason the script is named Intelligent is because recurring buy is most commonly used without any decision making: buy no matter what with certain frequency. This strategy seeks to still perform recurring buys but filtering out some of the potential bad entries that can delay unnecessarily seeing the position in profits. The second reason is also securing an exit strategy from the beginning which no recurring buy option offers out-of-the-box.

Scalper's Volatility Filter [QuantraSystems]Scalpers Volatility Filter
Introduction
The 𝒮𝒸𝒶𝓁𝓅𝑒𝓇'𝓈 𝒱𝑜𝓁𝒶𝓉𝒾𝓁𝒾𝓉𝓎 𝐹𝒾𝓁𝓉𝑒𝓇 (𝒮𝒱𝐹) is a sophisticated technical indicator, designed to increase the profitability of lower timeframe trading.
Due to the inherent decrease in the signal-to-noise ratio when trading on lower timeframes, it is critical to develop analysis methods to inform traders of the optimal market periods to trade - and more importantly, when you shouldn’t trade.
The 𝒮𝒱𝐹 uses a blend of volatility and momentum measurements, to signal the dominant market condition - trending or ranging.
Legend
The 𝒮𝒱𝐹 consists of a signal line that moves above and below a central zero line, serving as the indication of market regime.
When the signal line is positioned above zero, it indicates a period of elevated volatility. These periods are more profitable for trading, as an asset will experience larger price swings, and by design, trend-following indicators will give less false signals.
Conversely, when the signal line moves below zero, a low volatility or mean-reverting market regime dominates.
This distinction is critical for traders in order to align strategies with the prevailing market behaviors - leveraging trends in volatile markets and exercising caution or implementing mean-reversion systems in periods of lower volatility.
Case Study
Here we can see the indicator's unique edge in action.
Out of the four potential long entries seen on the chart - displayed via bar coloring, two would result in losses.
However, with the power of the 𝒮𝒱𝐹 a trader can effectively filter false signals by only entering momentum-trades when the signal line is above zero.
In this small sample of four trades, the 𝒮𝒱𝐹 increased the win rate from 50% to 100%
Methodology
The methodology behind the 𝒮𝒱𝐹 is based upon three components:
By calculating and contrasting two ATR’s, the immediate market momentum relative to the broader, established trend is calculated. The original method for this can be credited to the user @xinolia
A modified and smoothed ADX indicator is calculated to further assess the strength and sustainability of trends.
The ‘Linear Regression Dispersion’ measures price deviations from a fitted regression line, adding further confluence to the signals representation of market conditions.
Together, these components synthesize a robust, balanced view of market conditions, enabling traders to help align strategies with the prevailing market environment, in order to potentially increase expected value and win rates.

Timely Opening Range Breakout Strategy [TORB] (Zeiierman)█ Overview
The Timely Opening Range Breakout (TORB) indicator builds upon the classic Open Range Breakout (ORB) concept. The ORB strategy is a popular trading setup used to identify trades around the opening range of an asset. It's based on the idea that the first few minutes (15-60 minutes) of trading often set the tone for the rest of the day, with breakouts above or below the opening range signifying potential trends.
TORB refines the concept by stating that a trade is only valid if there is sufficient market activity. This means a breakout beyond the upper or lower range is only of interest during the most active trading hours, as defined by PMMV (Per-Minute Mean Volume)
█ How It Works
ORB
The indicator works by first defining a session's opening range based on user-specified settings, including the session's start and end times and the applicable time zone. During this session, it calculates the high and low price points, which form the basis for identifying potential breakout levels.
PMMV
PMMV (Per-Minute Mean Volume) provides a snapshot of the market's activity level at each minute of the trading day. PMMV is calculated by averaging the trading volume in a one-minute interval over a specified number of trading days. This script uses the average volume over the last N periods to determine the PMMV value. This average volume provides a smoother representation of volume activity compared to using a single volume value. It considers the volume over a broader timeframe, filtering out short-term fluctuations and potentially offering a more reliable indicator of underlying market activity.
TORB
TORB works by integrating the Opening Range Breakout (ORB) highs and lows with the Per-Minute Mean Volume (PMMV) metric to assess the validity of breakouts. The objective is to identify breakouts from the opening high and low levels during periods of heightened market activity, as indicated by PMMV.
█ How to Use
To effectively utilize the Timely Opening Range Breakout (TORB) strategy, follow these steps:
Identify Active Hours: Employ PMMV to pinpoint periods of peak activity within the trading day.
Apply Basic ORB Rules: If the price surpasses the upper range (resistance), buy; if it breaches the lower range (support), sell.
Breakouts
The TORB strategy identifies breakout signals when the price moves beyond the established range, supported by volume exceeding a set threshold. This technique aims to eliminate false signals, focusing on price movements during high market activity.
█ Settings
Session
Trading Session: Customize the trading session's start and end times.
Volume
Volume analysis is integral to the TORB strategy, as it uses volume data to confirm the strength and validity of breakout signals.
Period: Sets the number of periods (or bars) to calculate the average volume, which is then used to assess market activity level.
Sensitivity and Significance: Adjusts how responsive the volume analysis is to changes in trading volume. By adjusting the sensitivity, traders can decide how much emphasis to place on volume spikes, potentially reducing false breakouts and focusing on those supported by significant trading activity.
Breakout Threshold
This setting establishes a criterion to identify when the price movement is significant enough.
Threshold: Traders set a threshold level to identify high market activity. If the PMMV is greater than or equal to this threshold, it indicates significant market activity.
Setting the correct threshold is key to balancing sensitivity and specificity. Too low of a threshold may lead to many false positives, while too high of a threshold might filter out potentially profitable breakouts. This setting helps in pinpointing when market activity indicates a strong move, thereby aligning trade entries with moments of heightened market momentum.
-----------------
Disclaimer
The information contained in my Scripts/Indicators/Ideas/Algos/Systems does not constitute financial advice or a solicitation to buy or sell any securities of any type. I will not accept liability for any loss or damage, including without limitation any loss of profit, which may arise directly or indirectly from the use of or reliance on such information.
All investments involve risk, and the past performance of a security, industry, sector, market, financial product, trading strategy, backtest, or individual's trading does not guarantee future results or returns. Investors are fully responsible for any investment decisions they make. Such decisions should be based solely on an evaluation of their financial circumstances, investment objectives, risk tolerance, and liquidity needs.
My Scripts/Indicators/Ideas/Algos/Systems are only for educational purposes!
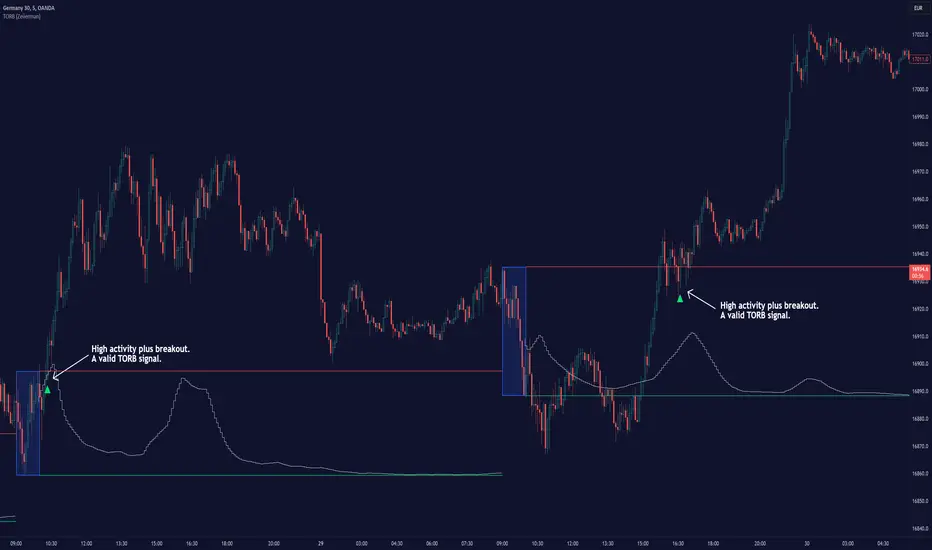
Table to filter trades per dayThis script contains a block of code that allows users to filter the total number of trades, loss trades, win trades and win rate per day in a table. This makes it easier to compare which days were profitable and which were not.
Be aware that this script can only be used in strategy scripts. To use the script, open it and copy every line from "START" to "STOP". Then, paste these lines at the very bottom of the strategy script that you want to attach it to.
The user has the ability to adjust the position of the table and customize the size of the text displayed.
If the user sets "Check when the trade:" to "Opened", the script will monitor when the trade opens and add it to the table once it has been closed. If "Check when the trade:" is set to "Closed", the script will track when the trade is closed and add it to the table once it has been closed.
It is recommended to run the script on the "Exchange" setting for more accurate results, even though a "Set the timezone" option is available. This will prevent discrepancies caused by daylight saving time changes.
Please note that the code will only work properly if you choose a daily timeframe or lower.

5 ema strategyThis Strategy is based of Subhashish Pani's (power of stocks) 5 EMA Strategy.strategy used for sell in 5 minutes and for buy in 15 minutes ..
Rules for this strategy ..
Sell signal -
1) if price is above 5 Ema and not touching Ema use as alert candle..
2) if price break low of alert candle strategy open trade ..
3) if price move more upside low of alert candle keep change into next candle ..
4) input we can select number of trade per day .as rule should take only 4 signal should execute
5) stop loss is fixed highest high of last 2 candle and take profit is input multiply of stop loss
buy signal-
1) if price is below 5 Ema and not touching Ema use as alert candle..
2) if price break high of alert candle strategy open trade ..
3) if price move more downside high of alert candle keep change into next candle ..
4) input we can select number of trade per day .as rule should take only 4 signal should execute
5) stop loss is fixed lowest low of last 2 candle and take profit is input multiply of stop loss
notes -input can be selected which side should take signal either buy or sell side ...number of trade can be adjusted ..
Disclaimer -Traders can use this script as a starting point for further customization or as a reference for developing their own trading strategies. It's important to note that past performance is not indicative of future results, and thorough testing and validation are recommended before deploying any trading strategy.

CCI based support and resistance strategy
WARNING:
Commissions and slippage has not been considered! Don’t take it easy adding commissions and slippage could turns a fake-profitable strategy to a real disaster.
We consider account size as 10k and we enter 1000 for each trade.
Less than 100 trades is too small sample community and it’s not reliable, Also the performance of the past do not guarantee future performance. This result was handpicked by author and will differ by other timeframes, instruments and settings.
*PLEASE SHARE YOUR SETTINGS THAT WORK WITH THE COMMUNITY.
Introduction:
The CCI-based dynamic support and resistance is a "Bands and Channels" kind of indicator consisting an upper and lower band. This is a strategy which uses CCI-based (Made by me) indicator to execute trades.
SL and TP are calculated based on max ATR during last selected time period. You can edit strategy settings using "Ksl", "Ktp" and the other button for time period. “KSL” and “KTP” are 2.5 and 5 by default.
Bands are calculated regarding CCI previous high and low pivot. CCI length, right pivot length and left pivot length are 50.
A dynamic support and resistance has been calculated using last upper-cci minus a buffer and last lower-cci plus the buffer. The buffer is 10.
If "Trend matter?" button is on you can detect trend by color of the upper and lower line. Green is bullish and red is bearish! "Trend matter?" is on.
The "show mid?" button makes mid line visible, which is average of upper and lower lines, visible. The button is not active by default.
Reaction to the support could be a buy signal while a reaction to the resistance could interpreted as a sell signal.
How this strategy work?
Donald Lambert, a technical analyst, created the CCI, or Commodity Channel Index, which he first published in 1980. CCI is calculated regarding CCI can be used both as trend-detector or an oscillator. As an oscillator most traders believe in static predefined levels. Overbought and oversold candles which are clear in the chart could be used as sell and buy signals.
During my trading career I’ve noticed that there might be some reversal points for the CCI. I believe CCI could have to potential to reverse more from lately reversal point. Of course, just like other trading strategies we are talking about probabilities. We do not expect a win trade each time.
On price chart
Now this the question! What price should the instrument reach that CCI turns to be equal to our reversing aim for CCI? Imagine we have found last important bearish reversal of CCI in 200. Now, if we need the CCI to be 200 what price should we wait for?
How to calculate?
This is the CCI formula:
CCI = (Typical Price - SMA of TP) / (0.015 x Mean Deviation)
Where, Typical Price (TP) = (High + Low + Close)/3
For probable reversing points, high and low pivots of 50 bars have been used.
So we do have an Upper CCI and a Lower CCI. They are valid until the next pivot is available.
By relocating factors in CCI formula you can reach the “Typical Price”.
“
Typical Price = CCI (0.015 * Mean Deviation) + SMA of TP
So we could have a Support or Resistance by replacing CCI with Upper and Lower CCI.
A buy signal is valid if the trend is bullish (or “trend matter” is off) and lowest low of last 2 candles is lower than support and close is greater than both support and open.
A Sell signal is produced in opposite situation.
There are 2+1 options for trend!
Trend matter box is on by default, which means we’ll just open trades in direction of the trend. It’s available to turn it off.
Other 2 options are cross and slope. Cross calculated by comparing fast SMA and slow SMA. The slope one differentiate slow SMA to last “n” one.
Considering last day and today highest ATR as the ATR to calculating SL and TP is our unique technique.

[F][IND] FVG IdentifierMastering Market Imbalances with Ease
The FVG Identifier stands as a groundbreaking TradingView indicator, crafted to illuminate the often-overlooked Fair Value Gaps (FVG) in the dynamic world of price action trading. Let’s dive into how this tool is transforming the approach to identifying market inefficiencies.
Decoding Fair Value Gaps
Central to the concept of FVGs is the identification of market imbalances — moments where the equilibrium between buying and selling pressures is disrupted. These gaps are typically seen in a sequence of three candles, where a dominant candle is surrounded by others whose wicks fail to fully overlap it. These formations are critical as they often influence future price directions, acting as potential magnets.
Simplifying the Detection of FVGs
The FVG Identifier is engineered to enhance the visibility of Fair Value Gaps, making them starkly apparent even in complex market charts. Its algorithms ensure that these vital market indicators are easily and promptly recognized, allowing traders to spot valuable trading opportunities with minimal effort.
Features of the FVG Identifier
1. Intuitive Interface: The indicator is designed for ease of use, accommodating both beginners and experienced traders.
2. Customizable Settings: It offers flexible configuration options, allowing for adaptation to various trading styles and strategies.
3. Strategic Trading Insight: By highlighting FVGs, the tool provides traders with actionable insights for strategic entry and exit points based on potential price movements.
Elevating Your Trading Strategy
Incorporating the FVG Identifier into your trading arsenal equips you with a nuanced perspective on market analysis. It not only assists in identifying significant market imbalances but also enriches your technical analysis with powerful, data-backed insights.
Revolutionizing Price Action Trading
The FVG Identifier transcends the role of a mere indicator; it represents a significant leap in trading methodology. Compatible with various trading platforms, this tool is ready to enhance your market understanding and application of Fair Value Gaps.
Embrace the FVG Identifier to uncover the hidden dynamics of market gaps and translate these insights into efficient and profitable trading strategies.
Disclaimer:
This indicator is provided for educational purposes only. Trading involves risk, and users should consult with a financial professional before making any trading decisions.
Your Feedback Matters!
Please feel free to comment or reach out if you have any improvement suggestions or if you would like to request the development of a specific indicator. Your feedback is invaluable!

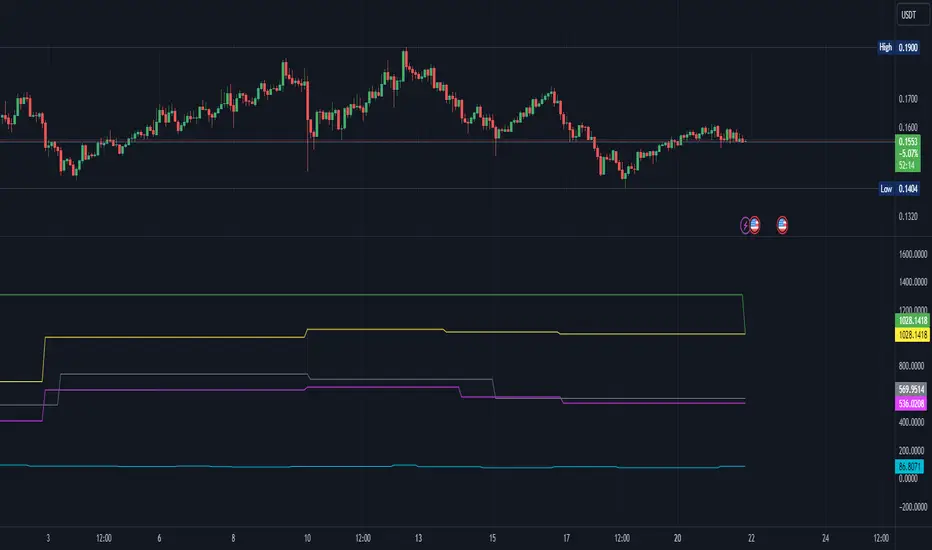
VWAP RangeThe VWAP Range indicator is a highly versatile and innovative tool designed with trading signals for trading the supply and demand within consolidation ranges.
What's a VWAP?
A VWAP (Volume Weighted Average Price) represents an equilibrium point in the market, balancing supply and demand over a specified period. Unlike simple moving averages, VWAP gives more weight to periods with higher volume. This is crucial because large volumes indicate significant trading activity, often by institutional traders, whose actions can reflect deeper market insights or create substantial market movements. The VWAP is also often used as a benchmark to evaluate the efficiency of executed trades. If a trader buys below the VWAP and sells above it, they are generally considered to have transacted favourably.
This is how it works:
Multiple VWAP Anchors:
This indicator uses multiple VWAPs anchored to different optional time periods, such as Daily, Weekly, Monthly, as well as to the highest high a lowest low within those periods. This multiplicity allows for a comprehensive view of the market’s average price based on volume and price, tailored to different trading styles and strategies.
Dynamic and Fixed Periods:
Traders can choose between using dynamic ranges, which reset at the start of each selected period, and specifying a date and time for a particular fixed range to trade. This flexibility is crucial for analyzing price movements within specific ranges or market phases.
Fixed ranges allow VWAPs to be calculated and anchored to a significant market event, the beginning of a consolidation phase or after a major news announcement.
Signal Generation:
The indicator generates buy and sell signals based on the relationship of the price to the VWAPs. It also allows for setting a maximum number of signals in one direction to avoid overtrading or pyramiding. Be sure to wait for the candle close before trading on the signals.
Average Buy/Sell Signal Lines:
Lines can be plotted to display the average buy and sell signal prices. The difference between the lines shows the average profit per trade when trading on the signals in that range. It's a good way to see how profitable a range is on average without backtesting the signals. The lines will also often turn into support and resistance areas, similar to value areas in a volume profile.
Customizable Settings:
Traders have control over various settings, such as the VWAP calculation method and bar color. There are also tooltips for every function.
Hidden Feature:
There's a subtle feature in this indicator: if you have 'Indicator values' turned on in TradingView, you'll see a Sell/Buy Ratio displayed only in the status line. This ratio indicates whether there are more sell signals than buy signals in a range, regardless of the Max Signals setting. A red value above 1 suggests that the market is trending upward, indicating you might want to hold your long positions a bit longer. Conversely, a green value below 1 implies a downward trend.

BreakoutTrendFollowingINFO:
The "BreakoutTrendFollowing" indicator is a comprehensive trading system designed for trend-following in various market environments. It combines multiple technical indicators, including Moving Averages (MA), MACD, and RSI,
along with volume analysis and breakout detection from consolidation, to identify potential entry points in trending markets. This strategy is particularly effective for assets that exhibit strong trends and significant price movements.
Note that using the consolidation filter reduces the amount of entries the strategy detects significantly, and needs to be used if we want to have an increased confidence in the trend via breakout.
However, the strategy can be easily transformed to various only trend-following strategies, by applying different filters and configurations.
The indicator can be used to connect to the Signal input of the TTS (TempalteTradingStrategy) by jason5480 in order to backtest it, thus effectively turning it into a strategy (instructions below in TTS CONNECTIVITY section)
DETAILS:
The strategy's core is built upon several key components:
Moving Average (MA): Used to determine the general trend direction. The strategy checks if the price is above the selected MA type and length.
MACD Filter: Analyzes the relationship between two moving averages to confirm the trend's momentum.
Consolidation Detection: Identifies periods of price consolidation and triggers trades on breakouts from these ranges.
Volume Analysis: Assesses trading volume to confirm the strength and validity of the breakout.
RSI: Used to avoid overbought conditions, ensuring trades are entered in favorable market situations.
Wick filters: make sure there is not a long wick that indicates selling pressure from above
The strategy generates buy signals when several conditions are met concurrently (each one of them can be individually enabled/disabled)"
The price is above the selected MA.
A breakout occurs from a configurable consolidation range.
The MACD line is above the signal line, indicating bullish momentum.
The RSI is below the overbought threshold.
There's an increase in trading volume, confirming the breakout's strength.
Currently the strategy fires SL signals, as the approach is to check for loss of momentum - i.e. crossunder of the MACD line and signal line, but that is to everyone to determine the exit conditions.
The buy and SL signals are set on the chart using green or orange triangles on the below/above the price action.
SETTINGS:
Users can customize various parameters, including MA type and period, MACD settings, consolidation length, and volume increase percentage. The strategy is equipped with alert conditions for both entry (buy signals) and exit (set stop loss) points, facilitating both manual and automated trading.
Each one of the technical indicators, as well as the consilidation range and breakout/wick settings can be configured and enabled/disabled individually.
Please thoroughly review the available settings of the script, but here is an outline of the most important ones:
Use bar wicks (instead of open/close) - the ref_high/low will be taken based on the bar wicks, rather than the open/close when determining the breakout and MA
Enter position only on green candles - additional filters to make sure that we enter only on strong momentum
MA Filter: (enable, source, type, length) - general settings for MA filter to be checked against the stock price (close or upper wick)
MACD Filter: (enable, source, Osc MA type, Signal MA type, Fast MA length, Slow MA length, Low MACD Hist) - detailed settings for fine MACD tuning
Consolidation:
Consolidation Type: we have two different ways of detecting the consolidation, note the types below.
CONSOLIDATION_BASIC - consolidation areas by looking for the pivot point of a trend and counts the number of bars that have not broken the consolidation high/low levels.
CONSOLIDATIO_RANGE_PERCENT - identifies consolidation by comparing the range between the highest and lowest price points over a specified period.
So in summary the CONSOLIDATIO_RANGE_PERCENT uses a percentage-based range to define consolidation, while CONSOLIDATION_BASIC uses a count of bars within a high-low range to establish consolidation.
Thus the former is more focused on the tightness of the price range, whereas the latter emphasizes the duration of the consolidation phase.
The CONSOLIDATIO_RANGE_PERCENT might be more sensitive to recent price movements and suitable for shorter-term analysis, while CONSOLIDATION_BASIC could be better for identifying longer-term consolidation patterns.
Min consolidation length - applicable for CONSOLIDATION_BASIC case, the min number of bars for the price to be in the range to consider consolidation
Consolidation Loopback period - applicable for CONSOLIDATION_BASIC case, the loopback number of bars to look for consolidation
Consolidation Range percent - applicable for CONSOLIDATIO_RANGE_PERCENT, the percent between the high and low in the range to consider consolidation
Plot consolidation - enables plotting of the consolidation (only for debug purposes)
Breakout: (enable, low, high) - the definition of the breakout from the previous consolidation range, the price should be between to determine the breakout as successfull
Upper wick: (enable, percent) - defines the percent of the upper wick compared to the whole candle to allow breakout (if the wick is too big part of the candle we can consider entering the position riskier)
RSI: (enable, length, overbought) - general settings for RSI TA
Volume (enbale, percentage increase, average volume filter en, loopback bars) - percentage of increase of the volume to consider for a breakout. There are two modes - percentage increase compared to the previous bar, or percentage against the average volume for the last loopback bars.
Note that there are many different configuration that you can play with, and I believe this is the strength of the strategy, as it can provide a single solution for different cases and scenarios.
My advice is to try and play with the different options for different markets based on the approach you want to implement and try turning features on/off and tuning them further.
TTS SETTINGS (NEEDED IF USED TO BACKTEST WITH TTS):
The TempalteTradingStrategy is a strategy script developed in Pine by jason5480, which I recommend for quick turn-around of testing different ideas on a proven and tested framework
I cannot give enough credit to the developer for the efforts put in building of the infrastructure, so I advice everyone that wants to use it first to get familiar with the concept and by checking
by checking jason5480's profile www.tradingview.com
The TTS itself is extremely functional and have a lot of properties, so its functionality is beyond the scope of the current script -
Again, I strongly recommend to be thoroughly explored by everyone that plans on using it.
In the nutshell it is a script that can be feed with buy/sell signals from an external indicator script and based on many configuration options it can determine how to execute the trades.
The TTS has many settings that can be applied, so below I will cover only the ones that differ from the default ones, at least according to my testing - do your own research, you may find something even better :)
The current/latest version that I've been using as of writing and testing this script is TTSv48
Settings which differ from the default ones:
Deal Conditions Mode - External (take enter/exit conditions from an external script)
🔌Signal 🛈➡ - BreakoutTrendFollowing: 🔌Signal to TTS (this is the output from the indicator script, according to the TTS convention)
Order Type - STOP (perform stop order)
Distance Method - HHLL (HigherHighLowerLow - in order to set the SL according to the strategy definition from above)
The next are just personal preferences, you can feel free to experiment according to your trading style
Take Profit Targets - 0 (either 100% in or out, no incremental stepping in or out of positions)
Dist Mul|Len Long/Short- 10 (make sure that we don't close on profitable trades by any reason)
Quantity Method - EQUITY (personal backtesting preference is to consider each backtest as a separate portfolio, so determine the position size by 100% of the allocated equity size)
Equity % - 100 (note above)

G2RIntroducing G2R – The Universal Indicator! Unlock the secret to trading success with G2R an extraordinary indicator that provides automatic signals across every time frame and market, from forex, crypto, stocks, & options with over 80% signal accuracy. Say goodbye to guesswork and hello to precision as G2R empowers you with real-time insights , giving you the edge to seize opportunities in any market condition . Elevate your trading strategy and conquer the financial world with G2R – your ultimate guide to profitable trading!
Features
• Bollinger bands
• 2 exponential moving averages
• Automatic buy and sell signals
• Works for Forex, Crypto, Indices, Stocks, & Options
• Tailored for all Timeframes
Trading Tips
• Trading Signals
• 30 Secs - 1 Min | SCALPING
• 3 Min - 5 Min | DAY TRADING
• 15 Min - 1 Hr | SWING & POSITION
• Take signal trades during London, New York, & Asia sessions
• Take Profits are found on the 15 Min, 30 Min, & 1 Hr timeframe at the trend channel or Moving Averages
• Stop loss are found above or below trend channel or moving averages
Warning
Never blindly take a trade on a G2R - wait for a proper market structure to occur before considering a trade.

Contrarian DC Strategy - w Entry SL Pause and TrailingStopDonchian Channel Setup:
The strategy uses a tool called the Donchian Channel. Imagine this as two lines (bands) on a chart that show the highest and lowest prices over a certain number of past trading days (default is 20 days).
There's also a centerline, which is the average of these two bands.
Entry Conditions for Trades:
Buying (Going Long): The strategy considers buying when the price touches or falls below the lower band of the Donchian Channel. However, this only happens if there has been a pause after a previous losing trade. This pause is a number of candles where no new trades are taken.
Selling (Going Short): Similarly, the strategy considers selling when price reaches or exceeds the upper band of the Donchian Channel. Again, this is subject to a pause after a losing trade.
Stop Loss and Take Profit:
Each trade has a "Stop Loss" and "Take Profit" set. The Stop Loss is a preset price level where the trade will close to prevent further losses if the market moves against your position. The Take Profit does the same but locks in profit if the market moves in your favor.
The Stop Loss is set based on a percentage of the price at which you entered the trade.
The Take Profit is determined by the Risk/Reward Ratio. This ratio helps balance how much you're willing to risk versus the potential reward.
Trailing Stop Loss:
When a trade is profitable, the strategy should involve a "Trailing Stop Loss." This means the Stop Loss level moves (or trails) the price movement to lock in profits as the market moves in your favor.
For a buy trade, if the price moves above the centerline of the Donchian Channel, the Trailing Stop Loss should be adjusted in the middle between the entry price and the centerline. Viceversa for a sell trade, it should be adjusted in the same way if the price goes below the centerline.
IMPORTANT: There's no allert for the trailing stop at the moment.
Post-Stop Loss Pause:
If a trade hits the Stop Loss (i.e., it's a losing trade), the strategy takes a break before opening another trade in the same direction. This pause helps to avoid entering another trade immediately in a potentially unfavorable market.
In summary, this strategy is designed to make trades based on the Donchian Channel, with specific rules for when to enter and exit trades, and mechanisms to manage risk and protect profits. It's contrarian because it tends to buy when the price is low and sell when the price is high, which is opposite to what many traders might do.

Donchian Quest Research// =================================
Trend following strategy.
// =================================
Strategy uses two channels. One channel - for opening trades. Second channel - for closing.
Channel is similar to Donchian channel, but uses Close prices (not High/Low). That helps don't react to wicks of volatile candles (“stop hunting”). In most cases openings occur earlier than in Donchian channel. Closings occur only for real breakout.
// =================================
Strategy waits for beginning of trend - when price breakout of channel. Default length of both channels = 50 candles.
Conditions of trading:
- Open Long: If last Close = max Close for 50 closes.
- Close Long: If last Close = min Close for 50 closes.
- Open Short: If last Close = min Close for 50 closes.
- Close Short: If last Close = max Close for 50 closes.
// =================================
Color of lines:
- black - channel for opening trade.
- red - channel for closing trade.
- yellow - entry price.
- fuchsia - stoploss and breakeven.
- vertical green - go Long.
- vertical red - go Short.
- vertical gray - close in end, don't trade anymore.
// =================================
Order size calculated with ATR and volatility.
You can't trade 1 contract in BTC and 1 contract in XRP - for example. They have different price and volatility, so 1 contract BTC not equal 1 contract XRP.
Script uses universal calculation for every market. It is based on:
- Risk - USD sum you ready to loss in one trade. It calculated as percent of Equity.
- ATR indicator - measurement of volatility.
With default setting your stoploss = 0.5 percent of equity:
- If initial capital is 1000 USD and used parameter "Permit stop" - loss will be 5 USD (0.5 % of equity).
- If your Equity rises to 2000 USD and used parameter "Permit stop"- loss will be 10 USD (0.5 % of Equity).
// =================================
This Risk works only if you enable “Permit stop” parameter in Settings.
If this parameter disabled - strategy works as reversal strategy:
⁃ If close Long - channel border works as stoploss and momentarily go Short.
⁃ If close Short - channel border works as stoploss and momentarily go Long.
Channel borders changed dynamically. So sometime your loss will be greater than ‘Risk %’. Sometime - less than ‘Risk %’.
If this parameter enabled - maximum loss always equal to 'Risk %'. This parameter also include breakeven: if profit % = Risk %, then move stoploss to entry price.
// =================================
Like all trend following strategies - it works only in trend conditions. If no trend - slowly bleeding. There is no special additional indicator to filter trend/notrend. You need to trade every signal of strategy.
Strategy gives many losses:
⁃ 30 % of trades will close with profit.
⁃ 70 % of trades will close with loss.
⁃ But profit from 30% will be much greater than loss from 70 %.
Your task - patiently wait for it and don't use risky setting for position sizing.
// =================================
Recommended timeframe - Daily.
// =================================
Trend can vary in lengths. Selecting length of channels determine which trend you will be hunting:
⁃ 20/10 - from several days to several weeks.
⁃ 20/20 or 50/20 - from several weeks to several months.
⁃ 50/50 or 100/50 or 100/100 - from several months to several years.
// =================================
Inputs (Settings):
- Length: length of channel for trade opening/closing. You can choose 20/10, 20/20, 50/20, 50/50, 100/50, 100/100. Default value: 50/50.
- Permit Long / Permit short: Longs are most profitable for this strategy. You can disable Shorts and enable Longs only. Default value: permit all directions.
- Risk % of Equity: for position sizing used Equity percent. Don't use values greater than 5 % - it's risky. Default value: 0.5%.
⁃ ATR multiplier: this multiplier moves stoploss up or down. Big multiplier = small size of order, small profit, stoploss far from entry, low chance of stoploss. Small multiplier = big size of order, big profit, stop near entry, high chance of stoploss. Default value: 2.
- ATR length: number of candles to calculate ATR indicator. It used for order size and stoploss. Default value: 20.
- Close in end - to close active trade in the end (and don't trade anymore) or leave it open. You can see difference in Strategy Tester. Default value: don’t close.
- Permit stop: use stop or go reversal. Default value: without stop, reversal strategy.
// =================================
Properties (Settings):
- Initial capital - 1000 USD.
- Script don't uses 'Order size' - you need to change 'Risk %' in Inputs instead.
- Script don't uses 'Pyramiding'.
- 'Commission' 0.055 % and 'Slippage' 0 - this parameters are for crypto exchanges with perpetual contracts (for example Bybit). If use on other markets - set it accordingly to your exchange parameters.
// =================================
Big dataset used for chart - 'BITCOIN ALL TIME HISTORY INDEX'. It gives enough trades to understand logic of script. It have several good trends.
// =================================

Backtest Strategy Optimizer Adapter - Supertrend ExampleSample Code
This is a sample code for my Backtest Strategy Optimizer Adapter library.
You can find the library at:
Backtest Strategy Optimizer Tester
With this indicator, you will be able to run one or multiple backtests with different variables (combinations). For example, you can run dozens of backtests of Supertrend at once with an increment factor of 0.1, or whatever you prefer. This way, you can easily grab the most profitable settings and use them in your strategy. The chart above shows different color plots, each indicating a profit backtest equal to tradingview backtesting system. This code uses my backtest library, available in my profile.
Below the code you should edit yourself
You can use ChatGPT or write a python script to autogenerate code for you.
// #################################################################
// # ENTRIES AND EXITS
// #################################################################
// You can use the link and code in the description to create
// your code for the desired number of entries / exits.
// #################################################################
// AUTO GENERATED CODE
// ▼▼▼▼▼▼▼▼▼▼▼▼▼▼▼▼▼▼▼▼▼▼▼▼▼▼▼▼▼▼▼▼▼▼▼▼▼▼▼▼▼▼▼▼▼▼▼▼▼▼▼▼▼▼▼▼▼▼▼▼▼▼▼▼▼
= ti.supertrend(10, 0.1)
= ti.supertrend(10, 0.2)
= ti.supertrend(10, 0.3)
= ti.supertrend(10, 0.4)
// 005 etc...
pnl_001 = backtest.profit(date_start, date_end, entry_001, exit_001)
pnl_002 = backtest.profit(date_start, date_end, entry_002, exit_002)
pnl_003 = backtest.profit(date_start, date_end, entry_003, exit_003)
pnl_004 = backtest.profit(date_start, date_end, entry_004, exit_004)
plot(pnl_001, title='0.1', color=backtest.color(001))
plot(pnl_002, title='0.2', color=backtest.color(002))
plot(pnl_003, title='0.3', color=backtest.color(003))
plot(pnl_004, title='0.4', color=backtest.color(004))
// Make sure you set the correct array size.
// The amount of tests + 1 (e.g. 4 tests you set it to 5)
var results_list = array.new_string(5)
if (ta.change(pnl_001))
array.set(results_list, 0, str.tostring(pnl_001) + '|0.1')
if (ta.change(pnl_002))
array.set(results_list, 1, str.tostring(pnl_002) + '|0.2')
if (ta.change(pnl_003))
array.set(results_list, 2, str.tostring(pnl_003) + '|0.3')
if (ta.change(pnl_004))
array.set(results_list, 3, str.tostring(pnl_004) + '|0.4')
// ▲▲▲▲▲▲▲▲▲▲▲▲▲▲▲▲▲▲▲▲▲▲▲▲▲▲▲▲▲▲▲▲▲▲▲▲▲▲▲▲▲▲▲▲▲▲▲▲▲▲▲▲▲▲▲▲▲▲▲▲▲▲▲▲▲
// AUTO GENERATED CODE
// #################################################################
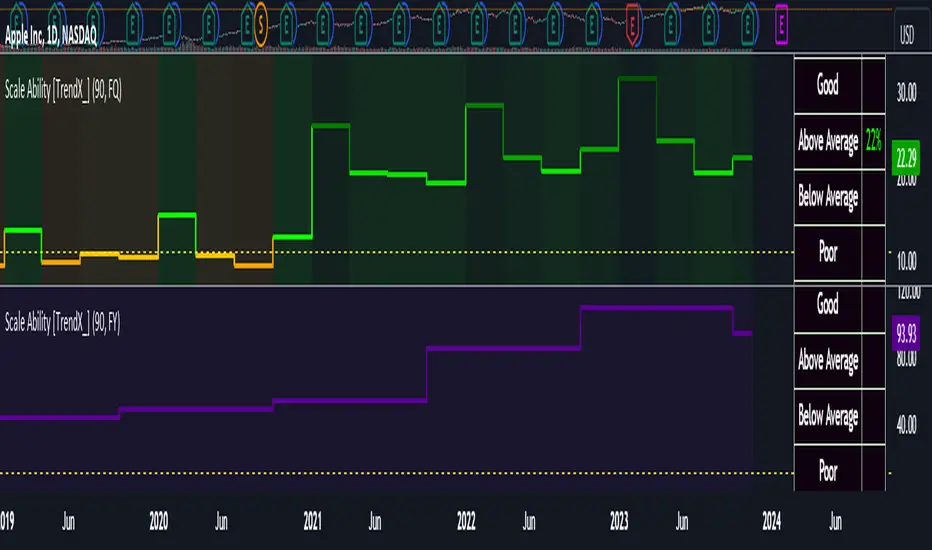
Scale Ability [TrendX_]Scale Ability indicator can indicate a company’s potential for future growth and profitability.
A scalable company is one that can increase its revenue and market share without increasing its costs proportionally, which can benefit from economies of scale. Therefore, the high-scale ability can generate more value for its shareholders - which is important for investment decisions.
Scale Ability indicator consists of 3 financial components:
Cash Flow from Investing Activities to Total Assets Ratio (CFIA / TA)
Net Income to Total Debt Ratio (NI / TD)
Earnings Before Interest, Taxes, Depreciation and Amortization to Equity Ratio (EBITDA / E)
These measures can help investors assess how efficiently and effectively a company uses its resources to generate revenue and profit.
Note:
This can be customizable between Fiscal Quarter (FQ) and Fiscal Year (Fy)
This is suitable for companies in fast-growing industries.
FUNCTION
CFIA / TA Ratio
A company with a net income to total debt of 9% could indicate that it is investing in its assets to keep up with the market demand and the technological changes which can create competitive advantages.
NI/ TD Ratio
A company with a net income to total debt of 9% could show that it is profitable and has a strong financial position, which can easily cover its debt payments.
EBITDA / E Ratio
A company with a net income to total debt of 14% illustrates that it is generating a high return on its equity.
USAGE
Scale index division:
> 43 : Excellent
32 - 43 : Good
12 - 31 : Above Average
= 11 : Average
8 - 10 : Below Average
5 - 7 : Poor
< 4 : Very Poor
DISCLAIMER
This is only a rough estimate, and the actual ratio may differ significantly depending on the stage of the business cycle and the company’s strategy, and the comparison of each company and its peers.
This indicator is not financial advice, it can only help traders make better decisions. There are many factors and uncertainties that can affect the outcome of any endeavor, and no one can guarantee or predict with certainty what will occur.
Therefore, one should always exercise caution and judgment when making decisions based on past performance.
MACD_RSI_trend_followingINFO:
This indicator can be used to build-up a strategy for trading of assets which are currently in trending phase.
My preference is to use it on slowly moving assets like GOLD and on higher timeframes, but practice may show that we find more usefull cases.
This script uses two indicators - MACD and RSI, as the timeframe that those are extracted for is configurable (defaults with the Chart TF, but can be any other selected by the user).
The strategy has the following simple idea - buy if any if the conditions below is true:
The selected TF MACD line crosses above the signal line and the TF RSI is above the user selected trigger value
The selected TF MACD line is above the signal line and the TF RSI crosses above the user selected trigger value
Once we're in position we wait for the selected TF MACD line to cross below the signal line, and then we set a SL at the low of that bar
DETAILS and USAGE:
In the current implementation I find two possible use cases for the indicator:
as a stand-alone indicator on the chart which can also fire alerts that can help to determine if we want to manually enter/exit trades based on them
can be used to connect to the Signal input of the TTS (TempalteTradingStrategy) by jason5480 in order to backtest it, thus effectively turning it into a strategy (instructions below in TTS CONNECTIVITY section)
In the example below we see a position opened at the bar after the buy indicator from the script has been triggered, and then later after the SL indicator from the script has been triggered a SL has been set on the lower wick of the closing candle, and the position eventually got closed once the price hit that level. Note that most of the drawing on the example snapshot below are from the TTS indicator following the buy/sell/SL conditions themseves:
Trading period can be selected from the indicator itself to limit to more interesting periods.
Arrow indications are drawn on the chart to indicate the trading conditions met in the script - green arrow for a buy signal indication and orange for LTF crossunder to indicate setting of SL.
SETTINGS:
Leaving all of the settings as in vanilla use case, as both the MACD and RSI indicator's settings follow the default ones for the stand-alone indicators themselves.
The start-end date is a time filter that can be extermely usefull when backtesting different time periods.
Pesonal preference is using the script on a D/W timeframe, while the indicator is configured to use Monthly chart.
The default value of the RSI filter is left to 50, which can be changed. I.e. if the RSI is above 50 we have a regime filter based on the MACD criteria.
EXTERNAL LIBRARIES:
The script uses a couple of external libraries:
HeWhoMustNotBeNamed/enhanced_ta/14 - collection of TA indicators
jason5480/tts_convention/3 - more details about the Template Trading Strategy below
I would like to highly appreciate and credit the work of both HeWhoMustNotBeNamed and jason5480 for providing them to the community.
TTS SETTINGS (NEEDED IF USED TO BACKTEST WITH TTS):
The TempalteTradingStrategy is a strategy script developed in Pine by jason5480, which I recommend for quick turn-around of testing different ideas on a proven and tested framework
I cannot give enough credit to the developer for the efforts put in building of the infrastructure, so I advice everyone that wants to use it first to get familiar with the concept and by checking
by checking jason5480's profile www.tradingview.com
The TTS itself is extremely functional and have a lot of properties, so its functionality is beyond the scope of the current script -
Again, I strongly recommend to be thoroughly epxlored by everyone that plans on using it.
In the nutshell it is a script that can be feed with buy/sell signals from an external indicator script and based on many configuration options it can determine how to execute the trades.
The TTS has many settings that can be applied, so below I will cover only the ones that differ from the default ones, at least according to my testing - do your own research, you may find something even better :)
The current/latest version that I've been using as of writing and testing this script is TTSv48
Settings which differ from the default ones:
from - False (time filter is from the indicator script itself)
Deal Conditions Mode - External (take enter/exit conditions from an external script)
🔌Signal 🛈➡ - MACD_RSI_trend_following: 🔌Signal to TTSv48 (this is the output from the indicator script, according to the TTS convention)
Sat/Sun - true (for crypto, in order to trade 24/7)
Order Type - STOP (perform stop order)
Distance Method - HHLL (HigherHighLowerLow - in order to set the SL according to the strategy definition from above)
The next are just personal preferenes, you can feel free to experiment according to your trading style
Take Profit Targets - 0 (either 100% in or out, no incremental stepping in or out of positions)
Dist Mul|Len Long/Short- 10 (make sure that we don't close on profitable trades by any reason)
Quantity Method - EQUITY (personal backtesting preference is to consider each backtest as a separate portfolio, so determine the position size by 100% of the allocated equity size)
Equity % - 100 (note above)

Dual_MACD_trendingINFO:
This indicator is useful for trending assets, as my preference is for low-frequency trading, thus using BTCUSD on 1D/1W chart
In the current implementation I find two possible use cases for the indicator:
- as a stand-alone indicator on the chart which can also fire alerts that can help to determine if we want to manually enter/exit trades based on the signals from it (1D/1W is good for non-automated trading)
- can be used to connect to the Signal input of the TTS (TempalteTradingStrategy) by jason5480 in order to backtest it, thus effectively turning it into a strategy (instructions below in TTS CONNECTIVITY section)
Trading period can be selected from the indicator itself to limit to more interesting periods.
Arrow indications are drawn on the chart to indicate the trading conditions met in the script - light green for HTF crossover, dark green for LTF crossover and orange for LTF crossunder.
Note that the indicator performs best in trending assets and markets, and it is advisable to use additional indicators to filter the trading conditions when market/asset is expected to move sideways.
DETAILS:
It uses a couple of MACD indicators - one from the current timeframe and one from a higher timeframe, as the crossover/crossunder cases of the MACD line and the signal line indicate the potential entry/exit points.
The strategy has the following flow:
- If the weekly MACD is positive (MACD line is over the signal line) we have a trading window.
- If we have a trading window, we buy when the daily macd line crosses AND closes above the signal line.
- If we are in a position, we await the daily MACD to cross AND close under the signal line, and only then place a stop loss under the wick of that closing candle.
The user can select both the higher (HTF) and lower (LTF) timeframes. Preferably the lower timeframe should be the one that the Chart is on for better visualization.
If one to decide to use the indicator as a strategy, it implements the following buy and sell criterias, which are feed to the TTS, but can be also manually managed via adding alerts from this indicator.
Since usually the LTF is preceeding the crossover compared to the HTF, then my interpretation of the strategy and flow that it follows is allowing two different ways to enter a trade:
- crossover (and bar close) of the macd over the signal line in the HIGH TIMEFRAME (no need to look at the LOWER TIMEFRMAE)
- crossover (and bar close) of the macd over the signal line in the LOW TIMEFRAME, as in this case we need to check also that the macd line is over the signal line for the HIGH TIMEFRAME as well (like a regime filter)
The exit of the trade is based on the lower timeframe MACD only, as we create a stop loss equal to the lower wick of the bar, once the macd line crosses below the signal line on that timeframe
SETTINGS:
All of the indicator's settings are for the vanilla/general case.
User can set all of the MACD parameters for both the higher and lower (current) timeframes, currently left to default of the MACD stand-alone indicator itself.
The start-end date is a time filter that can be extermely usefull when backtesting different time periods.
TTS SETTINGS (NEEDED IF USED TO BACKTEST WITH TTS)
The TempalteTradingStrategy is a strategy script developed in Pine by jason5480, which I recommend for quick turn-around of testing different ideas on a proven and tested framework
I cannot give enough credit to the developer for the efforts put in building of the infrastructure, so I advice everyone that wants to use it first to get familiar with the concept and by checking
by checking jason5480's profile www.tradingview.com
The TTS itself is extremely functional and have a lot of properties, so its functionality is beyond the scope of the current script -
Again, I strongly recommend to be thoroughly epxlored by everyone that plans on using it.
In the nutshell it is a script that can be feed with buy/sell signals from an external indicator script and based on many configuration options it can determine how to execute the trades.
The TTS has many settings that can be applied, so below I will cover only the ones that differ from the default ones, at least according to my testing - do your own research, you may find something even better :)
The current/latest version that I've been using as of writing and testing this script is TTSv48
Settings which differ from the default ones:
- from - False (time filter is from the indicator script itself)
- Deal Conditions Mode - External (take enter/exit conditions from an external script)
- 🔌Signal 🛈➡ - Dual_MACD: 🔌Signal to TTSv48 (this is the output from the indicator script, according to the TTS convention)
- Sat/Sun - true (for crypto, in order to trade 24/7)
- Order Type - STOP (perform stop order)
- Distance Method - HHLL (HigherHighLowerLow - in order to set the SL according to the strategy definition from above)
The next are just personal preferenes, you can feel free to experiment according to your trading style
- Take Profit Targets - 0 (either 100% in or out, no incremental stepping in or out of positions)
- Dist Mul|Len Long/Short- 10 (make sure that we don't close on profitable trades by any reason)
- Quantity Method - EQUITY (personal backtesting preference is to consider each backtest as a separate portfolio, so determine the position size by 100% of the allocated equity size)
- Equity % - 100 (note above)
EXAMPLES:
If used as a stand-alone indicator, the green arrows on the bottom will represent:
- light green - MACD line crossover signal line in the HTF
- darker green - MACD line crossover signal line in the LTF
- orange - MACD line crossunder signal line in the LTF
I recommend enabling the alerts from the script to cover those cases.
If used as an input to the TTS, we'll get more decorations on the chart from the TTS itself.
In the example below we open a trade on the next day of LTF crossover, then a few days later a crossunder in the LTF occurs, so we set a SL at the low of the wick of this day. Few days later the price doesn't recover and hits that SL, so the position is closed.

Backtest Strategy Optimizer AdapterBacktest Strategy Optimizer Adapter
With this library, you will be able to run one or multiple backtests with different variables (combinations). For example, you can run 100 backtests of Supertrend at once with an increment factor of 0.1. This way, you can easily fetch the most profitable settings and apply them to your strategy.
To get a better understanding of the code, you can check the code below.
Single backtest results
= backtest.results(date_start, date_end, long_entry, long_exit, take_profit_percentage, stop_loss_percentage, atr_length, initial_capital, order_size, commission)
Add backtest results to a table
backtest.table(initial_capital, profit_and_loss, open_balance, winrate, entries, exits, wins, losses, backtest_table_position, backtest_table_margin, backtest_table_transparency, backtest_table_cell_color, backtest_table_title_cell_color, backtest_table_text_color)
Backtest result without chart labels
= backtest.run(date_start, date_end, long_entry, long_exit, take_profit_percentage, stop_loss_percentage, atr_length, initial_capital, order_size, commission)
Backtest result profit
profit = backtest.profit(date_start, date_end, long_entry, long_exit, take_profit_percentage, stop_loss_percentage, atr_length, initial_capital, order_size, commission)
Backtest result winrate
winrate = backtest.winrate(date_start, date_end, long_entry, long_exit, take_profit_percentage, stop_loss_percentage, atr_length, initial_capital, order_size, commission)
Start Date
You can set the start date either by using a timestamp or a number that refers to the number of bars back.
Stop Loss / Take Profit Issue
Unfortunately, I did not manage to achieve 100% accuracy for the take profit and stop loss. The original TradingView backtest can stop at the correct position within a bar using the strategy.exit stop and limit variables. However, it seems unachievable with a crossunder/crossover function in PineScript unless it is calculated on every tick (which would make the backtesting results invalid). So far, I have not found a workaround, and I would be grateful if someone could solve this issue, if it is even possible. If you have any solutions or fixes, please let me know!
Multiple Backtest Results / Optimizer
You can run multiple backtests in a single strategy or indicator, but there are certain requirements for placing the correct code in the right way. To view examples of running multiple backtests, you can refer to the links provided in the updates I posted below. In the samples I have also explained how you can auto-generate code for your backtest strategy.
Liquidity Spike PoolThe “Liquidity Pools” indicator is a tool for market analysts that stands out for its ability to clearly project the intricate zones of manipulation present in financial markets. These crucial territories emerge when supply or demand takes over, resulting in long shadows (wicks) on the chart candles. Imagine these regions as "magnets" for prices, as they represent authentic "liquidity pools" where the flow of money into the market is significantly concentrated. But the value of the indicator goes beyond this simple visualization: these zones, when identified and interpreted correctly, can play a crucial role for traders looking for profitable entry points. They can mutate into important bastions of support or resistance, providing traders with key anchor points to make informed decisions within their trading strategies.
A key aspect to consider is the importance of different time frames in analyzing markets. Larger time frames, such as daily or 4h, tend to host larger and more relevant liquidity zones. Therefore, a successful strategy might involve identifying these areas of manipulation over longer time frames through the use of this indicator, and then applying these findings to shorter time frames. This approach allows you to turn manipulation zones into crucial reference points that merit constant surveillance while making trading decisions on shorter time frames.
The indicator uses color to convey information clearly and effectively:
- Dark blue lines highlight candles with significant upper wick, signaling the possible presence of an important manipulation area in the considered area.
- Dark red lines are reserved for sizable candlesticks with significant upper wick, emphasizing situations that are particularly relevant to traders.
- Dark gray lines highlight candles with significant lower wick, providing a valuable indication of manipulation zones where the bid may have prevailed.
- White lines highlight sizable candlesticks with significant lower wick, clearly indicating situations where demand has been predominant and may have helped form a liquidity pool.
This indicator constitutes an important resource for identifying and clearly displaying candles with significant wicks, allowing traders to distinguish between ordinary market conditions and circumstances particularly relevant to their trading strategies. Thanks to the distinctive colors of the lines, the indicator offers intuitive visual guidance, allowing traders to make more informed decisions while carrying out their analyses.

Improved EMA & CDC Trailing Stop StrategyImproved EMA & CDC Trailing Stop Strategy
Objective: This strategy seeks to exploit potential trend reversals or continuations using Exponential Moving Averages (EMAs) and a trailing stop based on the Chande Dynamic Convergence Divergence (CDC) ATR method.
Components:
Exponential Moving Averages (EMAs):
60-period EMA (Blue Line): Faster-moving average that reacts more quickly to price changes.
90-period EMA (Red Line): Slower-moving average that provides a smoother indication of long-term price direction.
MACD Indicator:
Utilized to confirm the trend direction. When the MACD line is above its signal line, it may indicate a bullish trend. Conversely, when the MACD line is below its signal line, it may indicate a bearish trend.
CDC Trailing Stop ATR:
Used to set dynamic stop-loss levels that adjust with market volatility. This stop is based on the Average True Range (ATR) with a user-defined multiplier, providing the strategy with a flexible way to protect against adverse price movements.
Profit Targets:
Based on a multiple of the ATR, this sets an objective level at which to take profits, ensuring gains are captured while potentially still leaving room for further profitable movement.
Trading Rules:
Entry:
Long (Buy) Entry Conditions:
Price is above the 60-period EMA.
The 60-period EMA is above the 90-period EMA.
The MACD line is above its signal line.
Price is above the calculated CDC Trailing Stop ATR level.
Short (Sell) Entry Conditions:
Price is below the 60-period EMA.
The 60-period EMA is below the 90-period EMA.
The MACD line is below its signal line.
Price is below the calculated CDC Trailing Stop ATR level.
Exit:
Long (Buy) Exit Conditions:
Price reaches the predetermined profit target based on the ATR.
Price drops below the CDC Trailing Stop ATR level.
Short (Sell) Exit Conditions:
Price reaches the predetermined profit target based on the ATR.
Price rises above the CDC Trailing Stop ATR level.
Visualization:
The strategy displays the 60-period and 90-period EMAs on the chart.
The CDC Trailing Stop ATR levels for both long and short trades are also plotted for clarity.
The MACD Histogram is shown to visualize the difference between the MACD line and its signal line.
Recommendations: Before deploying this strategy, traders should backtest it across various historical data sets and market conditions. Regularly reviewing and potentially adjusting the strategy is recommended as market dynamics evolve.

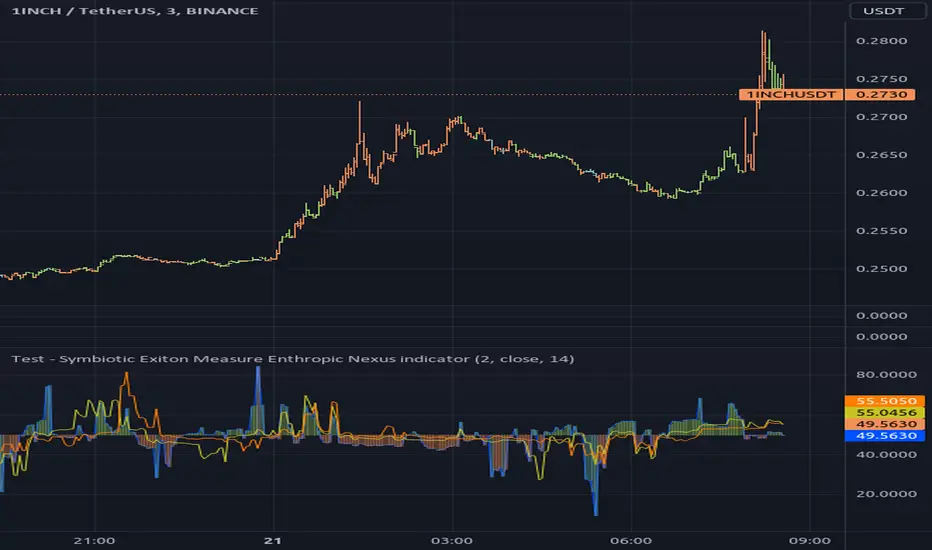
Test - Symbiotic Exiton Measure Enthropic Nexus indicatorThe Symbiotic Exiton Measure Enthropic Nexus (SEMEN) Indicator is a technical analysis tool used in trading and investing. It's name might sound complex, but its function is quite simple - to help traders make informed decisions about buying or selling stocks by predicting market trends.
The SEMEN indicator uses a combination of various factors such as volume, price action, moving averages, and other indicators to generate a single numerical value that represents the overall health of the market. A high reading indicates a strong uptrend, while a low one suggests a downtrend.
Traders can use this information to enter or exit positions with confidence.
In essence, the SEMEN indicator provides a comprehensive view of the market's sentiment and direction, making it an essential tool for any trader or investor looking to make profitable decisions in today's volatile stock markets.
~description generated with Airoboros7b
- The indicator is experimental so use at your own discretion..
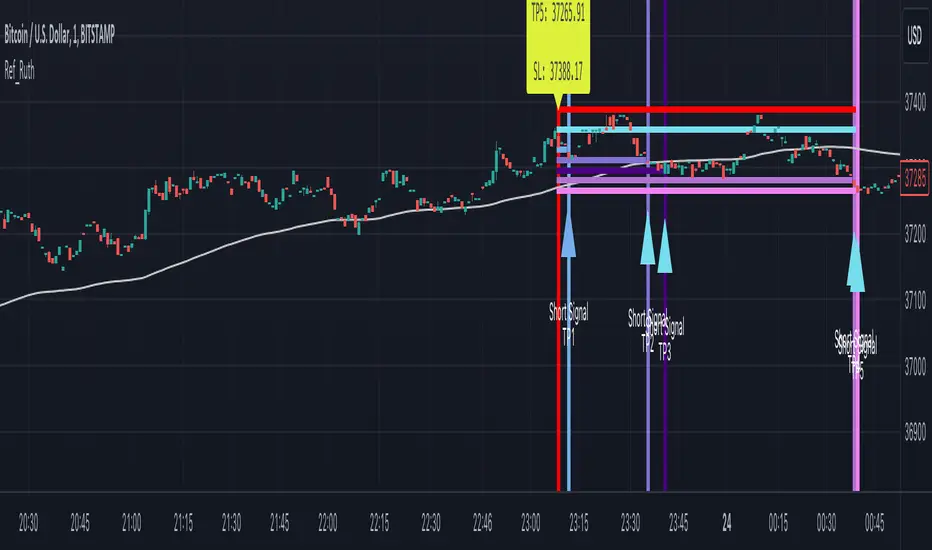
Ruth Buy/Sell Signal for Day Trade and Swing TradeRuth is based on the most known technical indicators and designed for intraday traders. Ruth's aim is to find the best Buy/Sell points and decide to stop loss point with minimum Loss also Ruth tries to find multiple Profit points as TP1/TP2/TP3/TP4/TP5. Ruth was designed based on the heat map colors to be user-friendly and easy to read. While cold color preferred for Short positions, warm colors preferred for Long positions. The most important feature of Ruth is that after the signal is generated, the candles in which the profitable levels are painted one by one with their own special color codes, so that even the most inexperienced users can understand where they should close their positions.
There are two types of signal Ruth can produce for fast trade.
Short Signal: These signals means market tends to be move to down.
Short Stop Loss Point: This is the maximum risk for the position. Shown with single red line inside of the signal.
Short Entry Point: This is the best entry price for short side position. Shown with single baby blue line inside of the signal.
Short Take Profit (TP1): This level represents the profit level the signal is most likely to reach. Shown with single blue line inside of the signal.
Short Take Profit (TP2): This level represents the profit level with a high probability of the signal occurring. Shown with single light purple line inside of the signal.
Short Take Profit (TP3): This level represents the profit level with an intermediate probability of the signal occurring. Shown with single dark purple line inside of the signal.
Short Take Profit (TP4): This level represents the profit level with a low probability of the signal occurring. Shown with single light lilac line inside of the signal.
Short Take Profit (TP5): This level represents the profit level with a tight probability of the signal occurring. Shown with single dark lilac line inside of the signal.
Long Signal: These signals means market tends to be move to up.
Long Stop Loss Point: This is the maximum risk for the position. Shown with single red line inside of the signal.
Long Entry Point: This is the best entry price for short side position. Shown with single baby blue line inside of the signal.
Long Take Profit (TP1): This level represents the profit level the signal is most likely to reach. Shown with single greenish yellow line inside of the signal.
Long Take Profit (TP2): This level represents the profit level with a high probability of the signal occurring. Shown with yellow purple line inside of the signal.
Long Take Profit (TP3): This level represents the profit level with an intermediate probability of the signal occurring. Shown with single dark yellow line inside of the signal.
Long Take Profit (TP4): This level represents the profit level with a low probability of the signal occurring. Shown with single orange line inside of the signal.
Long Take Profit (TP5): This level represents the profit level with a tight probability of the signal occurring. Shown with single dark orange line inside of the signal.
Timeframe: In general best and fastest results occurred in shorter timeframes like 1 min / 5 mins / 15 mins but feel free to try higher timeframes.
Tips & Tricks:
1) Gray line drawn ot the graph represents Dema, we suggests you to go on Short Singals under gray line and go on Long Signals upper gray line.
2) Mostly, Signals easily reach their TP2 / TP3 levels and then generally there is reaction or take profit desire so commodity price turns the opposite direction. If in short time price won't turn to Signal direction close position.
3) Don't forget, every positions has own risks and profits but trade in main trend is crucial.
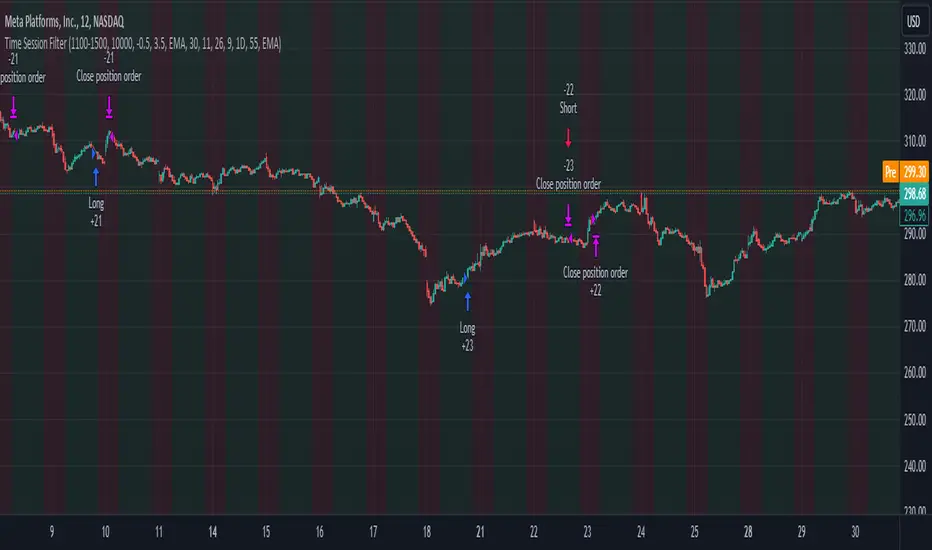
Time Session Filter - MACD exampleTime Session Filter in TradingView Strategy: A Comprehensive Guide
Welcome to this educational TradingView blog where we dive deep into the functionality and utility of the time session filter in trading strategies. It's interesting to note that the time session filter is a commonly overlooked feature in Pine Script, often not integrated into overall trading strategies. Yet, when used wisely, this tool can significantly enhance your trading approach. In essence, the session filter ensures that trades are only made within a specific, user-defined time frame. By incorporating this often-neglected building block, you can make your strategy more adaptable to various market conditions and trading preferences.
What is a Time Session Filter?
A time session filter is designed to:
Select Times of the Day to Trade: The filter allows you to choose specific hours during the day in which trades are allowed to be excecuted.
Toggle Days to Trade: You can decide which days of the week you want to trade, giving you the flexibility to avoid days that are historically not profitable for your strategy.
Close Trade When Session Ends: The filter can automatically close any open trade once the specified time session concludes, reducing the risk associated with holding positions outside your chosen time frame.
The user interface is streamlined, taking minimal space for the input sections, making it convenient to integrate with other indicators in your overall strategy script. In addition the script colors the background of the chart green when the timesession filter is on and makes the background red when the filter doesn't allow any trades. This helps you to visualise the selected timeframes in relation to chart patterns.
Best Practices for Time Selection
From my personal trading experience I share some input settings you can try to play around with:
Stocks: Trading stocks sometimes yield better results if you only trade in the mornings until lunchtime. This is the period when markets are generally more active, and traders are keenly participating.
Cryptocurrencies: For cryptocurrencies, it sometimes makes sense to avoid trading on Fridays, a day when futures contracts often expire. Various other market-moving events also typically occur on Fridays.
Random Selection: Interestingly, sometimes choosing a random selection of times and days can improve the script's performance, adding an element of unpredictability that might outperform more systematic approaches.
Strategy Overview
This strategy script incorporates various elements, including risk position size and MACD indicator, to provide a comprehensive trading strategy. For a detailed explanation of risk position sizing, please refer to this article:
For a complete understanding of the MACD indicator utilized, visit the following explanation:
Additionally, for high time frame trend filters, consult this resource for more info:
Educational Purposes and Risks
Please note that this script is for educational purposes and serves merely as an example of how to incorporate a time session filter into a trading strategy for pinescript. It is a simplified strategy without a fixed stop-loss, which can result in higher exposure to significant losses. The time session filter can be a powerful addition to your trading strategy, providing you with the tools to tailor your approach according to time-specific market conditions. By understanding its functionalities and best practices, you can make more informed trading decisions, but always remember that trading carries inherent risks.
Happy trading!