Monthly Strategy Performance TableWhat Is This?
This script code adds a Monthly Strategy Performance Table to your Pine Script strategy scripts so you can see a month-by-month and year-by-year breakdown of your P&L as a percentage of your account balance.
The table is based on realized equity rather than open equity, so it only updates the metrics when a trade is closed.
That's why some numbers will not match the Strategy Tester metrics (such as max drawdown), as the Strategy Tester bases metrics like max drawdown on open trade equity and not realized equity (closed trades).
The script is still a work-in-progress, so make sure to read the disclaimer below. But I think it's ready to release the code for others to play around with.
How To Use It
The script code includes one of my strategies as an example strategy. You need to replace my strategy code with your own. To do that just copy the source code below into a blank script, delete lines 11 -> 60 and paste your strategy code in there instead of mine. The script should work with most systems, but make sure to read the disclaimer below.
It works best with a significant amount of historical data, so it may not work very effectively on intraday timeframes as there is a severe limitation of available bars on TradingView. I recommend using it on 4HR timeframes and above, as anything less will produce very little usable data. Having a premium TradingView plan will also help boost the number of available bars.
You can hover your mouse over a table cell to get more information in the form of tooltips (such as the Long and Short win rate if you hover over your total return cell).
Credit
The code in this script is based on open-source code originally written by QuantNomad, I've made significant changes and additions to the original script but all credit for the idea and especially the display table code goes to them - I just built on top of it:
Why Did I Make This?
None of this is trading or investment advice, just my personal opinion based on my experience as a trader and systems developer these past 6+ years:
The TradingView Strategy Tester is severely limited in some important ways. And unless you use complex Excel formulas on exported test data, you can't see a granular perspective of your system's historical performance.
There is much more to creating profitable and tradeable systems than developing a strategy with a good win rate and a good return with a reasonable drawdown.
Some additional questions we need to ask ourselves are:
What did the system's worst drawdown look like?
How long did it last?
How often do drawdowns occur, and how quickly are they typically recovered?
How often do we have a break-even or losing month or year?
What is our expected compounded annual growth rate, and how does that growth rate compare to our max drawdown?
And many more questions that are too long to list and take a lifetime of trading experience to answer.
Without answering these kinds of questions, we run the risk of developing systems that look good on paper, but when it comes to live trading, we are uncomfortable or incapable of enduring the system's granular characteristics.
This Monthly Performance Table script code is intended to help bridge some of that gap with the Strategy Tester's limited default performance data.
Disclaimer
I've done my best to ensure the numbers this code outputs are accurate, and according to my testing with my personal strategy scripts it appears to work fine. But there is always a good chance I've missed something, or that this code will not work with your particular system.
The majority of my TradingView systems are extremely simple single-target systems that operate on a closed-candle basis to minimize many of the data reliability issues with the Strategy Tester, so I was unable to do much testing with multiple targets and pyramiding etc.
I've included a Debug option in the script that will display important data and information on a label each time a trade is closed. I recommend using the Debug option to confirm that the numbers you see in the table are accurate and match what your strategy is actually doing.
Always do your own due diligence, verify all claims as best you can, and never take anyone's word for anything.
Take care, and best of luck with your trading :)
Kind regards,
Matt.
PS. If you're interested in learning how this script works, I have a free hour-long video lesson breaking down the source code - just check out the links below this script or in my profile.
Cerca negli script per "profitable"

Inside Day ProbabilityThe "Inside Day Probability" indicator is a tool developed for market analysis on the TradingView platform. Its main objective is to calculate the probability of success of a pattern known as "Inside Day" (Día Interior in Spanish).
An Inside Day occurs when the price range (difference between the high and low) of a candle is completely contained within the price range of the previous candle. This pattern indicates a consolidation in the market and is usually followed by a sharp move in a certain direction.
The indicator uses a combination of statistical and mathematical analysis to determine the probability that an Inside Day will result in a successful market move. It is based on historical data and past patterns to calculate the probability of a significant price rise or sharp decline following an Inside Day.
The indicator provides a graphical display of the probability of success, usually in the form of a percentage value or a color scale. This allows traders to easily identify potentially profitable trading opportunities based on the occurrence of Inside Days.
It is important to note that this indicator is a decision support tool and does not guarantee accurate results in all cases. It is recommended to use it in conjunction with other technical analysis tools and consider other relevant factors before making operations in the financial market.
Remember that the proper interpretation and use of this indicator requires an understanding and knowledge of technical analysis and trading principles.

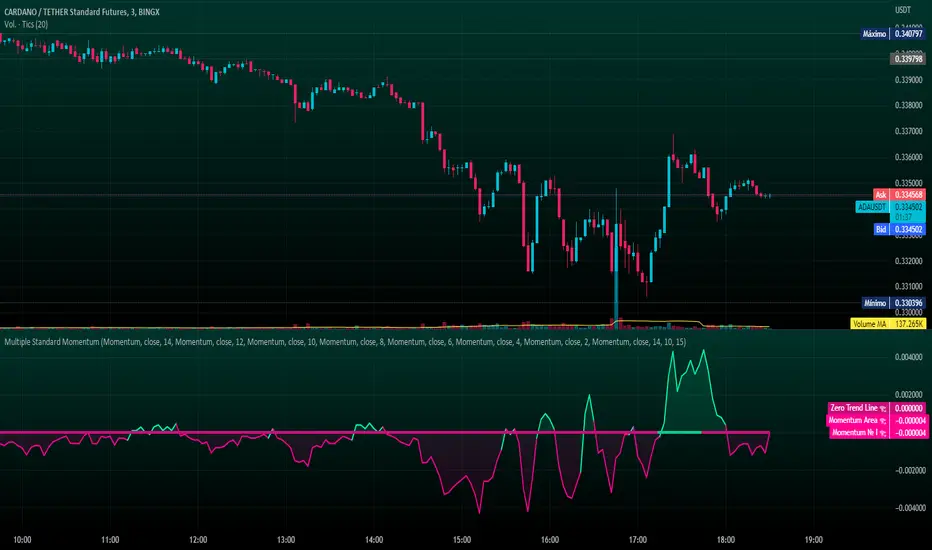
Volume-Weighted RSI with Adaptive SmoothingThis indicator is designed to provide traders with insights into the relative strength of a security by incorporating volume-weighted elements, effectively combining the concepts of Relative Strength Index (RSI) and volume-weighted averages to generate meaningful trading signals.
The indicator calculates the traditional RSI, which measures the speed and change of price movements, as well as the volume-weighted RSI, which considers the influence of trading volume on price action. It then applies adaptive smoothing to the volume-weighted RSI, allowing for customization of the smoothing process. The resulting smoothed volume-weighted RSI is plotted alongside the original RSI, providing traders with a comprehensive view of the price strength dynamics.
The line coloration in this indicator is designed to provide visual cues about the relationship between the RSI and the volume-weighted RSI. When the RSI line is above or equal to the volume-weighted RSI line, it suggests a potentially bullish condition with positive market momentum. In such cases, the line is colored lime. Conversely, when the RSI line (fuchsia) is below the volume-weighted RSI line, it indicates a potentially bearish condition with negative market momentum. The line color is set to fuchsia. By observing the line color, traders can quickly assess the relative strength between the RSI and the volume-weighted RSI, aiding their decision-making process.
The bar color and background color further enhance the visual interpretation of the indicator. The bar color reflects the RSI's relationship with the volume-weighted RSI and the predefined thresholds. If the RSI line is above both the volume-weighted RSI line and the overbought threshold (70), the bar color is set to lime, indicating a potentially overbought condition. Conversely, if the RSI line is below both the volume-weighted RSI line and the oversold threshold (30), the bar color is set to fuchsia, suggesting a potentially oversold condition. When the RSI line is between these two thresholds, the bar color is set to yellow, indicating a neutral or intermediate state. The background color, displayed with a semi-transparent shade, provides additional context by reflecting the prevailing market conditions. It turns lime if the volume-weighted RSI is above the overbought threshold, fuchsia if below the oversold threshold, and yellow if it falls between these two thresholds. This coloration scheme aids traders in quickly assessing market conditions and potential trading opportunities.
Calculations:
-- RSI Calculation : The traditional RSI is calculated based on the price movements of the asset. The up and down movements are determined, and exponential moving averages are used to smooth the values. The RSI value ranges from 0 to 100, with levels above 70 indicating overbought conditions and levels below 30 indicating oversold conditions.
-- Volume-Weighted RSI Calculation : The volume-weighted RSI incorporates the trading volume of the asset into the calculations. The closing price is multiplied by the corresponding volume, and the average is taken over a specific length. The up and down movements are smoothed using exponential moving averages to generate the volume-weighted RSI value.
-- Adaptive Smoothing : The indicator offers an adaptive smoothing option, allowing traders to customize the smoothing process of the volume-weighted RSI. By adjusting the smoothing length, traders can fine-tune the responsiveness of the indicator to changes in market conditions. Smoothing helps reduce noise and enhances the clarity of the signals.
Interpretation:
The indicator provides two main components for interpretation:
-- RSI : The traditional RSI reflects the price momentum and potential overbought or oversold conditions. Traders can look for RSI values above 70 as potential overbought signals, suggesting a possible price reversal or correction. Conversely, RSI values below 30 indicate potential oversold signals, indicating a potential price rebound or rally.
-- Volume-Weighted RSI : The volume-weighted RSI incorporates trading volume, which provides insights into the strength of price movements. When the volume-weighted RSI is above the traditional RSI, it suggests that the buying pressure supported by higher volume is stronger, potentially indicating a more reliable trend. Conversely, when the volume-weighted RSI is below the traditional RSI, it suggests that the selling pressure supported by higher volume is stronger, potentially indicating a more significant price reversal.
Potential Strategies:
-- Overbought and Oversold Signals : Traders can utilize the RSI component of the indicator to identify overbought and oversold conditions. A potential strategy is to consider taking short positions when the RSI is above 70 and long positions when the RSI is below 30. These levels can act as dynamic support and resistance areas, indicating possible price reversals.
-- Confirmation with Volume : Traders can use the volume-weighted RSI as a confirmation tool to validate price movements. When the volume-weighted RSI is above the traditional RSI, it may provide additional confirmation for long positions, suggesting stronger buying pressure. Conversely, when the volume-weighted RSI is below the traditional RSI, it may provide confirmation for short positions, indicating stronger selling pressure.
-- Trend Reversal Strategy : Watch for the volume-weighted RSI to reach extreme levels above 70 (overbought) or below 30 (oversold). Look for a reversal signal where the RSI line (green or fuchsia) crosses below or above the volume-weighted RSI line. Enter a trade when the reversal signal occurs, and the RSI line changes color. Exit the trade when the RSI line crosses back in the opposite direction or reaches the opposite extreme level.
-- Divergence Strategy : Compare the direction of the RSI line (green or fuchsia) with the volume-weighted RSI line. A bullish divergence occurs when the RSI line makes higher lows while the volume-weighted RSI line makes lower lows. A bearish divergence occurs when the RSI line makes lower highs while the volume-weighted RSI line makes higher highs. Once a divergence is identified, wait for the RSI line to cross above or below the volume-weighted RSI line as confirmation of a potential trend reversal. Consider using additional indicators or price action analysis to time the entry more accurately. Use stop-loss orders and profit targets to manage risk and secure profits.
-- Trend Continuation Strategy : Assess the overall trend direction by observing the RSI line's position relative to the volume-weighted RSI line. When the RSI line consistently stays above the volume-weighted RSI line, it indicates a bullish trend, while the opposite suggests a bearish trend. Look for temporary pullbacks within the ongoing trend where the RSI line (green or fuchsia) touches or crosses the volume-weighted RSI line. Enter trades in the direction of the dominant trend when the RSI line crosses back in the trend direction. Exit the trade when the RSI line starts to deviate significantly from the volume-weighted RSI line or when the trend shows signs of weakening through other technical or fundamental factors.
Limitations:
-- False Signals : Like any indicator, the "Volume-Weighted RSI with Adaptive Smoothing" may produce false signals, especially during periods of low liquidity or choppy market conditions. Traders should exercise caution and consider using additional confirmation indicators or tools to validate the signals generated by this indicator.
-- Lagging Nature : The indicator relies on historical price data and volume to calculate the RSI and volume-weighted RSI. As a result, the signals provided may have a certain degree of lag compared to real-time price action. Traders should be aware of this inherent lag and consider combining the indicator with other timely indicators to enhance the accuracy of their trading decisions.
-- Parameter Sensitivity : The indicator's effectiveness can be influenced by the choice of parameters, such as the length of the RSI, smoothing length, and adaptive smoothing option. Different market conditions may require adjustments to these parameters to optimize performance. Traders are encouraged to conduct thorough testing and analysis to determine the most suitable parameter values for their specific trading strategies and preferences.
-- Market Conditions : The indicator's performance may vary depending on the prevailing market conditions. It is essential to understand that no indicator can guarantee accurate predictions or consistently profitable trades. Traders should consider the broader market context, fundamental factors, and other technical indicators to complement the insights provided by the "Volume-Weighted RSI with Adaptive Smoothing" indicator.
-- Subjectivity : Interpretation of the indicator's signals involves subjective judgment. Traders may have varying interpretations of overbought and oversold levels, as well as the significance of the volume-weighted RSI in relation to the traditional RSI. It is crucial to combine the indicator with personal analysis and trading experience to make informed trading decisions.
Remember, no single indicator can provide foolproof trading signals. The "Volume-Weighted RSI with Adaptive Smoothing" indicator serves as a valuable tool for analyzing price strength and volume dynamics. It can assist traders in identifying potential entry and exit points, validating trends, and managing risk. However, it should be used as part of a comprehensive trading strategy that considers multiple factors and indicators to increase the likelihood of successful trades.

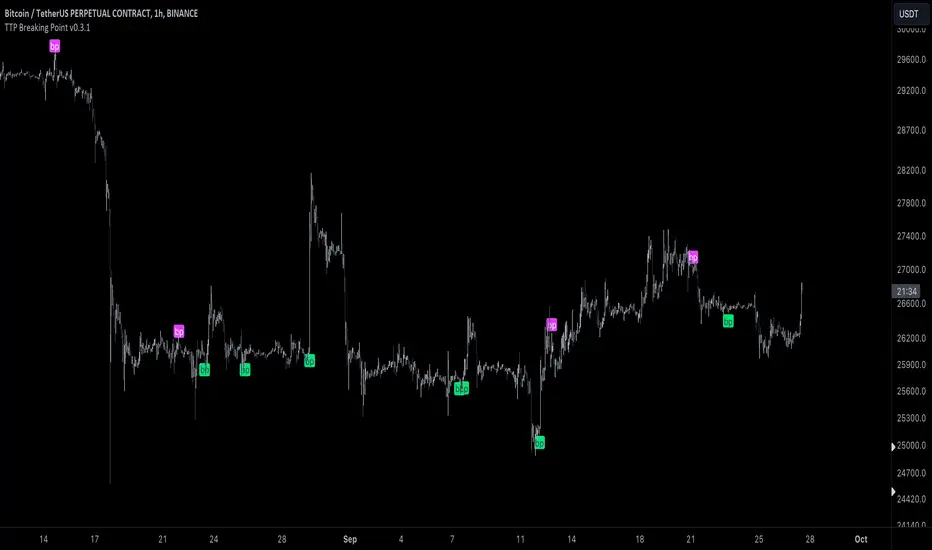
TTP Breaking PointThis signal uses information from BITFINEX:BTCUSDLONGS and BITFINEX:BTCUSDSHORTS to forecast tops and bottoms.
The idea behind is very simple.
We calculate the RSI of the ratio of longs vs shorts and find areas where both the SMA of this RSI and the RSI itself are overextended.
You might notice that the win rate is not high but most of the wins provide a decent move that, if combined with proper risk management, can be used to build profitable strategies.
The signal offers a backtesting stream: 1 for buy and 2 for sell.
Shortly I'll be adding new features including: alerts, support for other symbols, filters, etc.
Range BreakerStrategy Description: Range Breaker
The Range Breaker strategy is a breakout trading strategy that aims to capture profits when the price of a financial instrument moves out of a defined range. The strategy identifies swing highs and swing lows over a specified lookback period and enters long or short positions when the price breaks above the swing high or below the swing low, respectively. It also employs stop targets based on a percentage to manage risk and protect profits.
Beginner's Guide:
Understand the concepts:
a. Swing High: A swing high is a local peak in price where the price is higher than the surrounding prices.
b. Swing Low: A swing low is a local trough in price where the price is lower than the surrounding prices.
c. Lookback Period: The number of bars or periods the strategy analyzes to determine swing highs and swing lows.
d. Stop Target: A predetermined price level at which the strategy will exit the position to manage risk and protect profits.
Configure the strategy:
a. Set the initial capital, order size, commission, and pyramiding as needed for your specific trading account.
b. Choose the desired lookback period to identify the swing highs and lows.
c. Set the stop target multiplier and stop target percentage as desired to manage risk and protect profits.
Backtest the strategy:
a. Set the backtest start date to analyze the strategy's historical performance.
b. Observe the backtesting results to evaluate the strategy's effectiveness and adjust the parameters if necessary.
Implement the strategy:
a. Apply the strategy to your preferred financial instrument on the TradingView platform.
b. Monitor the strategy's performance and adjust the parameters as needed to optimize its effectiveness.
Risk management:
a. Always use a stop target to protect your trading capital and manage risk.
b. Don't risk more than a small percentage of your trading capital on a single trade.
c. Be prepared to adjust the strategy or stop trading it if the market conditions change significantly.
Adjusting the Lookback Period and Timeframes for Optimal Strategy Performance
The Range Breaker strategy uses a lookback period to identify swing highs and lows, which serve as the basis for determining entry and exit points for long and short positions. By adjusting the lookback period and analyzing different timeframes, you can potentially find the best strategy configuration for each specific asset.
Adjusting the lookback period:
The lookback period is a critical parameter that affects the sensitivity of the strategy to price movements. A shorter lookback period will make the strategy more sensitive to smaller price fluctuations, resulting in more frequent trading signals. On the other hand, a longer lookback period will make the strategy less sensitive, generating fewer signals but potentially capturing larger price movements.
To optimize the lookback period for a specific asset, you can test different lookback values and compare their performance in terms of risk-adjusted returns, win rate, and other relevant metrics. Keep in mind that using an overly short lookback period may lead to overtrading and increased transaction costs, while an overly long lookback period may cause the strategy to miss profitable trading opportunities.
Analyzing different timeframes:
Timeframes refer to the duration of each bar or candlestick on the chart. Shorter timeframes (e.g., 5-minute, 15-minute, or 30-minute) focus on intraday price movements, while longer timeframes (e.g., daily, weekly, or monthly) capture longer-term trends. The choice of timeframe affects the number of trading signals generated by the strategy and the length of time each position is held.
To find the best strategy for each asset, you can test the Range Breaker strategy on different timeframes and analyze its performance. Keep in mind that shorter timeframes may require more active monitoring and management due to the increased frequency of trading signals. Longer timeframes, on the other hand, may require more patience as positions are held for extended periods.
Finding the best strategy for each asset:
Every asset has unique price characteristics that may affect the performance of a trading strategy. To find the best strategy for each asset, you should:
a. Test various lookback periods and timeframes, observing the strategy's performance in terms of profitability, risk-adjusted returns, and win rate.
b. Consider the asset's historical price behavior, such as its volatility, liquidity, and trend-following or mean-reverting tendencies.
c. Evaluate the strategy's performance during different market conditions, such as bullish, bearish, or sideways markets, to ensure its robustness.
d. Keep in mind that each asset may require a unique set of strategy parameters for optimal performance, and there may be no one-size-fits-all solution.
By experimenting with different lookback periods and timeframes, you can fine-tune the Range Breaker strategy for each specific asset, potentially improving its overall performance and adaptability to changing market conditions. Always practice proper risk management and be prepared to make adjustments as needed.
Remember that trading strategies carry inherent risk, and past performance is not indicative of future results. Always practice proper risk management and consider your own risk tolerance before trading with real money.

Step RSI [Loxx]Enhanced Moving Average Calculation with Stepped Moving Average and the Advantages over Regular RSI
Technical analysis plays a crucial role in understanding and predicting market trends. One popular indicator used by traders and analysts is the Relative Strength Index (RSI). However, an enhanced approach called Stepped Moving Average, in combination with the Slow RSI function, offers several advantages over regular RSI calculations.
Stepped Moving Average and Moving Averages:
The Stepped Moving Average function serves as a crucial component in the calculation of moving averages. Moving averages smooth out price data over a specific period to identify trends and potential trading signals. By employing the Stepped Moving Average function, traders can enhance the accuracy of moving averages and make more informed decisions.
Stepped Moving Average takes two parameters: the current RSI value and a size parameter. It computes the next step in the moving average calculation by determining the upper and lower bounds of the moving average range. It accomplishes this by adjusting the values of smax and smin based on the given RSI and size.
Furthermore, Stepped Moving Average introduces the concept of a trend variable. By comparing the previous trend value with the current RSI and the previous upper and lower bounds, it updates the trend accordingly. This feature enables traders to identify potential shifts in market sentiment and make timely adjustments to their trading strategies.
Advantages over Regular RSI:
Enhanced Range Boundaries:
The inclusion of size parameters in Stepped Moving Average allows for more precise determination of the upper and lower bounds of the moving average range. This feature provides traders with a clearer understanding of the potential price levels that can influence market behavior. Consequently, it aids in setting more effective entry and exit points for trades.
Improved Trend Identification:
The trend variable in Stepped Moving Average helps traders identify changes in market trends more accurately. By considering the previous trend value and comparing it to the current RSI and previous bounds, Stepped Moving Average captures trend reversals with greater precision. This capability empowers traders to respond swiftly to market shifts and potentially capture more profitable trading opportunities.
Smoother Moving Averages:
Stepped Moving Average's ability to adjust the moving average range bounds based on trend changes and size parameters results in smoother moving averages. Regular RSI calculations may produce jagged or erratic results due to abrupt market movements. Stepped Moving Average mitigates this issue by dynamically adapting the range boundaries, thereby providing traders with more reliable and consistent moving average signals.
Complementary Functionality with Slow RSI:
Stepped Moving Average and Slow RSI function in harmony to provide a comprehensive trading analysis toolkit. While Stepped Moving Average refines the moving average calculation process, Slow RSI offers a more accurate representation of market strength. The combination of these two functions facilitates a deeper understanding of market dynamics and assists traders in making better-informed decisions.
Extras
-Alerts
-Signals

ICT Donchian Smart Money Structure (Expo)█ Concept Overview
The Inner Circle Trader (ICT) methodology is focused on understanding the actions and implications of the so-called "smart money" - large institutions and professional traders who often influence market movements. Key to this is the concept of market structure and how it can provide insights into potential price moves.
Over time, however, there has been a notable shift in how some traders interpret and apply this methodology. Initially, it was designed with a focus on the fractal nature of markets. Fractals are recurring patterns in price action that are self-similar across different time scales, providing a nuanced and dynamic understanding of market structure.
However, as the ICT methodology has grown in popularity, there has been a drift away from this fractal-based perspective. Instead, many traders have started to focus more on pivot points as their primary tool for understanding market structure.
Pivot points provide static levels of potential support and resistance. While they can be useful in some contexts, relying heavily on them could provide a skewed perspective of market structure. They offer a static, backward-looking view that may not accurately reflect real-time changes in market sentiment or the dynamic nature of markets.
This shift from a fractal-based perspective to a pivot point perspective has significant implications. It can lead traders to misinterpret market structure and potentially make incorrect trading decisions.
To highlight this issue, you've developed a Donchian Structure indicator that mirrors the use of pivot points. The Donchian Channels are formed by the highest high and the lowest low over a certain period, providing another representation of potential market extremes. The fact that the Donchian Structure indicator produces the same results as pivot points underscores the inherent limitations of relying too heavily on these tools.
While the Donchian Structure indicator or pivot points can be useful tools, they should not replace the original, fractal-based perspective of the ICT methodology. These tools can provide a broad overview of market structure but may not capture the intricate dynamics and real-time changes that a fractal-based approach can offer.
It's essential for traders to understand these differences and to apply these tools correctly within the broader context of the ICT methodology and the Smart Money Concept Structure. A well-rounded approach that incorporates fractals, along with other tools and forms of analysis, is likely to provide a more accurate and comprehensive understanding of market structure.
█ Smart Money Concept - Misunderstandings
The Smart Money Concept is a popular concept among traders, and it's based on the idea that the "smart money" - typically large institutional investors, market makers, and professional traders - have superior knowledge or information, and their actions can provide valuable insight for other traders.
One of the biggest misunderstandings with this concept is the belief that tracking smart money activity can guarantee profitable trading.
█ Here are a few common misconceptions:
Following Smart Money Equals Guaranteed Success: Many traders believe that if they can follow the smart money, they will be successful. However, tracking the activity of large institutional investors and other professionals isn't easy, as they use complex strategies, have access to information not available to the public, and often intentionally hide their moves to prevent others from detecting their strategies.
Instantaneous Reaction and Results: Another misconception is that market movements will reflect smart money actions immediately. However, large institutions often slowly accumulate or distribute positions over time to avoid moving the market drastically. As a result, their actions might not produce an immediate noticeable effect on the market.
Smart Money Always Wins: It's not accurate to assume that smart money always makes the right decisions. Even the most experienced institutional investors and professional traders make mistakes, misjudge market conditions, or are affected by unpredictable events.
Smart Money Activity is Transparent: Understanding what constitutes smart money activity can be quite challenging. There are many indicators and metrics that traders use to try and track smart money, such as the COT (Commitments of Traders) reports, Level II market data, block trades, etc. However, these can be difficult to interpret correctly and are often misleading.
Assuming Uniformity Among Smart Money: 'Smart Money' is not a monolithic entity. Different institutional investors and professional traders have different strategies, risk tolerances, and investment horizons. What might be a good trade for a long-term institutional investor might not be a good trade for a short-term professional trader, and vice versa.
█ Market Structure
The Smart Money Concept Structure deals with the interpretation of price action that forms the market structure, focusing on understanding key shifts or changes in the market that may indicate where 'smart money' (large institutional investors and professional traders) might be moving in the market.
█ Three common concepts in this regard are Change of Character (CHoCH), and Shift in Market Structure (SMS), Break of Structure (BMS/BoS).
Change of Character (CHoCH): This refers to a noticeable change in the behavior of price movement, which could suggest that a shift in the market might be about to occur. This might be signaled by a sudden increase in volatility, a break of a trendline, or a change in volume, among other things.
Shift in Market Structure (SMS): This is when the overall structure of the market changes, suggesting a potential new trend. It usually involves a sequence of lower highs and lower lows for a downtrend, or higher highs and higher lows for an uptrend.
Break of Structure (BMS/BoS): This is when a previously defined trend or pattern in the price structure is broken, which may suggest a trend continuation.
A key component of this approach is the use of fractals, which are repeating patterns in price action that can give insights into potential market reversals. They appear at all scales of a price chart, reflecting the self-similar nature of markets.
█ Market Structure - Misunderstandings
One of the biggest misunderstandings about the ICT approach is the over-reliance or incorrect application of pivot points. Pivot points are a popular tool among traders due to their simplicity and easy-to-understand nature. However, when it comes to the Smart Money Concept and trying to follow the steps of professional traders or large institutions, relying heavily on pivot points can create misconceptions and lead to confusion. Here's why:
Delayed and Static Information: Pivot points are inherently backward-looking because they're calculated based on the previous period's data. As such, they may not reflect real-time market dynamics or sudden changes in market sentiment. Furthermore, they present a static view of market structure, delineating pre-defined levels of support and resistance. This static nature can be misleading because markets are fundamentally dynamic and constantly changing due to countless variables.
Inadequate Representation of Market Complexity: Markets are influenced by a myriad of factors, including economic indicators, geopolitical events, institutional actions, and market sentiment, among others. Relying on pivot points alone for reading market structure oversimplifies this complexity and can lead to a myopic understanding of market dynamics.
False Signals and Misinterpretations: Pivot points can often give false signals, especially in volatile markets. Prices might react to these levels temporarily but then continue in the original direction, leading to potential misinterpretation of market structure and sentiment. Also, a trader might wrongly perceive a break of a pivot point as a significant market event, when in fact, it could be due to random price fluctuations or temporary volatility.
Over-simplification: Viewing market structure only through the lens of pivot points simplifies the market to static levels of support and resistance, which can lead to misinterpretation of market dynamics. For instance, a trader might view a break of a pivot point as a definite sign of a trend, when it could just be a temporary price spike.
Ignoring the Fractal Nature of Markets: In the context of the Smart Money Concept Structure, understanding the fractal nature of markets is crucial. Fractals are self-similar patterns that repeat at all scales and provide a more dynamic and nuanced understanding of market structure. They can help traders identify shifts in market sentiment or direction in real-time, providing more relevant and timely information compared to pivot points.
The key takeaway here is not that pivot points should be entirely avoided or that they're useless. They can provide valuable insights and serve as a useful tool in a trader's toolbox when used correctly. However, they should not be the sole or primary method for understanding the market structure, especially in the context of the Smart Money Concept Structure.
█ Fractals
Instead, traders should aim for a comprehensive understanding of markets that incorporates a range of tools and concepts, including but not limited to fractals, order flow, volume analysis, fundamental analysis, and, yes, even pivot points. Fractals offer a more dynamic and nuanced view of the market. They reflect the recursive nature of markets and can provide valuable insights into potential market reversals. Because they appear at all scales of a price chart, they can provide a more holistic and real-time understanding of market structure.
In contrast, the Smart Money Concept Structure, focusing on fractals and comprehensive market analysis, aims to capture a more holistic and real-time view of the market. Fractals, being self-similar patterns that repeat at different scales, offer a dynamic understanding of market structure. As a result, they can help to identify shifts in market sentiment or direction as they happen, providing a more detailed and timely perspective.
Furthermore, a comprehensive market analysis would consider a broader set of factors, including order flow, volume analysis, and fundamental analysis, which could provide additional insights into 'smart money' actions.
█ Donchian Structure
Donchian Channels are a type of indicator used in technical analysis to identify potential price breakouts and trends, and they may also serve as a tool for understanding market structure. The channels are formed by taking the highest high and the lowest low over a certain number of periods, creating an envelope of price action.
Donchian Channels (or pivot points) can be useful tools for providing a general view of market structure, and they may not capture the intricate dynamics associated with the Smart Money Concept Structure. A more nuanced approach, centered on real-time fractals and a comprehensive analysis of various market factors, offers a more accurate understanding of 'smart money' actions and market structure.
█ Here is why Donchian Structure may be misleading:
Lack of Nuance: Donchian Channels, like pivot points, provide a simplified view of market structure. They don't take into account the nuanced behaviors of price action or the complex dynamics between buyers and sellers that can be critical in the Smart Money Concept Structure.
Limited Insights into 'Smart Money' Actions: While Donchian Channels can highlight potential breakout points and trends, they don't necessarily provide insights into the actions of 'smart money'. These large institutional traders often use sophisticated strategies that can't be easily inferred from price action alone.
█ Indicator Overview
We have built this Donchian Structure indicator to show that it returns the same results as using pivot points. The Donchian Structure indicator can be a useful tool for market analysis. However, it should not be seen as a direct replacement or equivalent to the original Smart Money concept, nor should any indicator based on pivot points. The indicator highlights the importance of understanding what kind of trading tools we use and how they can affect our decisions.
The Donchian Structure Indicator displays CHoCH, SMS, BoS/BMS, as well as premium and discount areas. This indicator plots everything in real-time and allows for easy backtesting on any market and timeframe. A unique candle coloring has been added to make it more engaging and visually appealing when identifying new trading setups and strategies. This candle coloring is "leading," meaning it can signal a structural change before it actually happens, giving traders ample time to plan their next trade accordingly.
█ How to use
The indicator is great for traders who want to simplify their view on the market structure and easily backtest Smart Money Concept Strategies. The added candle coloring function serves as a heads-up for structure change or can be used as trend confirmation. This new candle coloring feature can generate many new Smart Money Concepts strategies.
█ Features
Market Structure
The market structure is based on the Donchian channel, to which we have added what we call 'Structure Response'. This addition makes the indicator more useful, especially in trending markets. The core concept involves traders buying at a discount and selling or shorting at a premium, depending on the order flow. Structure response enables traders to determine the order flow more clearly. Consequently, more trading opportunities will appear in trending markets.
Structure Candles
Structure Candles highlight the current order flow and are significantly more responsive to structural changes. They can provide traders with a heads-up before a break in structure occurs
-----------------
Disclaimer
The information contained in my Scripts/Indicators/Ideas/Algos/Systems does not constitute financial advice or a solicitation to buy or sell any securities of any type. I will not accept liability for any loss or damage, including without limitation any loss of profit, which may arise directly or indirectly from the use of or reliance on such information.
All investments involve risk, and the past performance of a security, industry, sector, market, financial product, trading strategy, backtest, or individual's trading does not guarantee future results or returns. Investors are fully responsible for any investment decisions they make. Such decisions should be based solely on an evaluation of their financial circumstances, investment objectives, risk tolerance, and liquidity needs.
My Scripts/Indicators/Ideas/Algos/Systems are only for educational purposes!

RSI, SRSI, MACD and DMI cross - Open source codeHello,
I'm a passionate trader who has spent years studying technical analysis and exploring different trading strategies. Through my research, I've come to realize that certain indicators are essential tools for conducting accurate market analysis and identifying profitable trading opportunities. In particular, I've found that the RSI, SRSI, MACD cross, and Di cross indicators are crucial for my trading success.
Detailed explanation:
The RSI is a momentum indicator that measures the strength of price movements. It is calculated by comparing the average of gains and losses over a certain period of time. In this indicator, the RSI is calculated based on the close price with a length of 14 periods.
The Stochastic RSI is a combination of the Stochastic Oscillator and the RSI. It is used to identify overbought and oversold conditions of the market. In this indicator, the Stochastic RSI is calculated based on the RSI with a length of 14 periods.
The MACD is a trend-following momentum indicator that shows the relationship between two moving averages of prices. It consists of two lines, the MACD line and the signal line, which are used to generate buy and sell signals. In this indicator, the MACD is calculated based on the close price with fast and slow lengths of 12 and 26 periods, respectively, and a signal length of 9 periods.
The DMI is a trend-following indicator that measures the strength of directional movement in the market. It consists of three lines, the Positive Directional Indicator (+DI), the Negative Directional Indicator (-DI), and the Average Directional Index (ADX), which are used to generate buy and sell signals. In this indicator, the DMI is calculated with a length of 14 periods and an ADX smoothing of 14 periods.
The indicator generates buy signals when certain conditions are met for each of these indicators.
1) For the RSI, a buy signal is generated when the RSI is below or equal to 35 and the Stochastic RSI %K is below or equal to 15, or when the RSI is below or equal to 28 the Stochastic RSI %K is below or equal to 15 or when the RSI is below or equal to 25 and the Stochastic RSI %K is below or equal to 10 or when the RSI is below or equal to 28.
2) For the MACD, a buy signal is generated when the MACD line is below 0, there is a change in the histogram from negative to positive, the MACD line and histogram are negative in the previous period, and the current histogram value is greater than 0.
3) For the DMI, a buy signal is generated when the Positive Directional Indicator (+DI) crosses above the Negative Directional Indicator (-DI), and the -DI is less than the +DI.
The indicator generates sell signals when certain conditions are met for each of these indicators:
1) For the RSI, a sell signal is generated when the RSI is above or equal to 75 and the Stochastic RSI %K is above or equal to 85, or when the RSI is above or equal to 80 and the Stochastic RSI %K is above or equal to 85, or when the RSI is above or equal to 85 and the Stochastic RSI %K is above or equal to 90 or when the RSI is above or equal to 82.
2)For the MACD, a sell signal is generated when the MACD line is above 0, there is a change in the histogram from positive to negative, the MACD line and histogram are positive in the previous period, and the current histogram value is less than the previous histogram value. On the other hand, a buy signal is generated when the MACD line is below 0, there is a change in the histogram from negative to positive, the MACD line and histogram are negative in the previous period, and the current histogram value is greater than the previous histogram value.
3)For the DMI a bearish signal is generated when plusDI crosses above minusDI, indicating that bulls are losing strength and bears are taking control.
The indicator uses a combination of these four indicators to generate potential buy and sell signals. The buy signals are generated when RSI and SRSI values are in oversold conditions, while sell signals are generated when RSI and SRSI values are in overbought conditions. The indicator also uses MACD crossovers and DMI crossovers to generate additional buy and sell signals.
When a signal is strong?
The use of multiple signals within a specific timeframe can increase the accuracy and reliability of the signals generated by this indicator. It is recommended to look for at least two signals within a range of 5-8 candles in order to increase the probability of a successful trade.
Why it's original?
1) There is no indicator in the library that combine all of these indicators and give you a 360 view
2)The combination of the RSI, Stochastic RSI, MACD, and DMI indicators in a single script it's unique and not available in the libray.
3)The specific parameters and conditions used to calculate the signals may be unique and not found in other scripts or libraries.
4)The use of plotshape() to plot the signals as shapes on the chart may be unique compared to other scripts that simply plot lines or bars to indicate signals.
5)The use of alertcondition() to trigger alerts based on the signals may be unique compared to other scripts that do not have custom alert functionality.
Keep attention!
It is important to note that no trading indicator or strategy is foolproof, and there is always a risk of losses in trading. While this indicator may provide useful information for making conclusions, it should not be used as the sole basis for making trading decisions. Traders should always use proper risk management techniques and consider multiple factors when making trading decisions.
Support me:)
If you find this new indicator helpful in your trading analysis, I would greatly appreciate your support! Please consider giving it a like, leaving feedback, or sharing it with your trading network. Your engagement will not only help me improve this tool but will also help other traders discover it and benefit from its features. Thank you for your support!

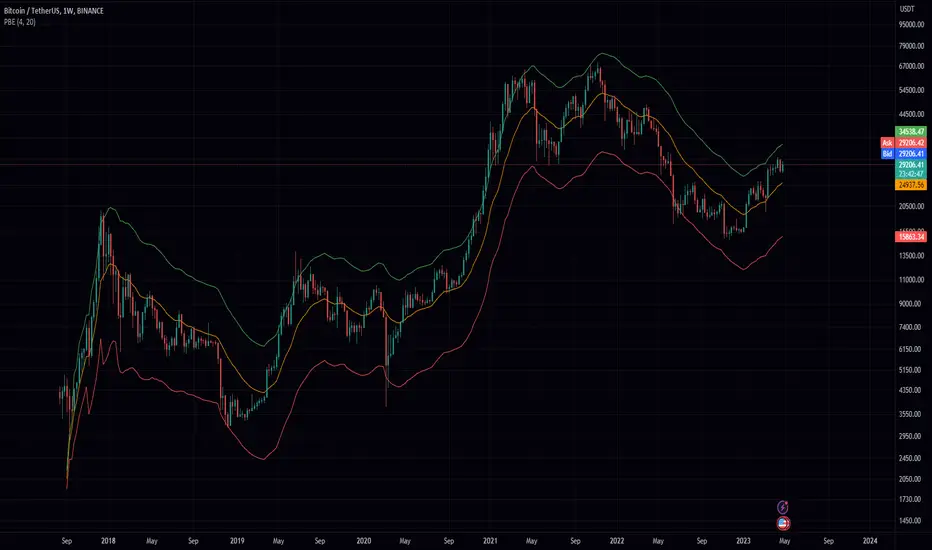
Probability Envelopes (PBE)Introduction
In the world of trading, technical analysis is vital for making informed decisions about the future direction of an asset's price. One such tool is the use of indicators, mathematical calculations that can help traders predict market trends. This article delves into an innovative indicator called the Probability Envelopes Indicator, which offers valuable insights into the potential price levels an asset may reach based on historical data. This in-depth look explores the statistical foundations of the indicator, highlighting its key components and benefits.
Section 1: Calculating Price Movements with Log Returns and Percentages
The Probability Envelopes Indicator provides the option to use either log returns or percentage changes when calculating price movements. Each method has its advantages:
Log Returns: These are calculated as the natural logarithm of the ratio of the current price to the previous price. Log returns are considered more stable and less sensitive to extreme price fluctuations.
Percentage Changes: These are calculated as the percentage difference between the current price and the previous price. They are simpler to interpret and easier to understand for most traders.
Section 2: Understanding Mean, Variance, and Standard Deviation
The Probability Envelopes Indicator utilizes various statistical measures to analyze historical price movements:
Mean: This is the average of a set of numbers. In the context of this indicator, it represents the average price movement for bullish (green) and bearish (red) scenarios.
Variance: This measure represents the dispersion of data points in a dataset. A higher variance indicates a greater spread of data points from the mean. Variance is calculated as the average of the squared differences from the mean.
Standard Deviation: This is the square root of the variance. It is a measure of the amount of variation or dispersion in a dataset. In the context of this indicator, standard deviations are used to calculate the width of the bands around the expected mean.
Section 3: Analyzing Historical Price Movements and Probabilities
The Probability Envelopes Indicator examines historical price movements and calculates probabilities based on their frequency:
The indicator first identifies and categorizes price movements into bullish (green) and bearish (red) scenarios.
It then calculates the probability of each price movement occurring by dividing the frequency of the movement by the total number of occurrences in each category (bullish or bearish).
The expected green and red movements are calculated by multiplying the probabilities by their respective price movements and summing the results.
The total expected movement, or weighted average, is calculated by combining the expected green and red movements and dividing by the total number of occurrences.
Section 4: Constructing the Probability Envelopes
The Probability Envelopes Indicator utilizes the calculated statistics to construct its bands:
The expected mean is calculated using the total expected movement and applied to the current open price.
An exponential moving average (EMA) is used to smooth the expected mean, with the smoothing length determining the degree of responsiveness.
The upper and lower bands are calculated by adding and subtracting the mean green and red movements, respectively, along with their standard deviations multiplied by a user-defined multiplier.
Section 5: Benefits of the Probability Envelopes Indicator
The Probability Envelopes Indicator offers numerous advantages to traders:
Enhanced Decision-Making: By providing probability-based estimations of future price levels, the indicator can help traders make more informed decisions and potentially improve their trading strategies.
Versatility: The indicator is applicable to various financial instruments, such as stocks, forex, commodities, and cryptocurrencies, making it a valuable tool for traders in different markets.
Customization: The indicator's parameters, including the use of log returns, multiplier values, and smoothing length, can be adjusted according to the user's preferences and trading style. This flexibility allows traders to fine-tune the Probability Envelopes Indicator to better suit their needs and goals.
Risk Management: The Probability Envelopes Indicator can be used as a component of a risk management strategy by providing insight into potential price movements. By identifying potential areas of support and resistance, traders can set stop-loss and take-profit levels more effectively.
Visualization: The graphical representation of the indicator, with its clear upper and lower bands, makes it easy for traders to quickly assess the market and potential price levels.
Section 6: Integrating the Probability Envelopes Indicator into Your Trading Strategy
When incorporating the Probability Envelopes Indicator into your trading strategy, consider the following tips:
Confirmation Signals: Use the indicator in conjunction with other technical analysis tools, such as trend lines, moving averages, or oscillators, to confirm the strength and direction of the market trend.
Timeframes: Experiment with different timeframes to find the optimal settings for your trading strategy. Keep in mind that shorter timeframes may generate more frequent signals but may also increase the likelihood of false signals.
Risk Management: Always establish a proper risk management strategy that includes setting stop-loss and take-profit levels, as well as managing your position sizes.
Backtesting: Test the Probability Envelopes Indicator on historical data to evaluate its effectiveness and fine-tune its parameters to optimize your trading strategy.
Section 7: Cons and Limitations of the Probability Envelopes Indicator
While the Probability Envelopes Indicator offers several advantages to traders, it is essential to be aware of its potential cons and limitations. Understanding these can help you make better-informed decisions when incorporating the indicator into your trading strategy.
Lagging Nature: The Probability Envelopes Indicator is primarily based on historical data and price movements. As a result, it may be less responsive to real-time changes in market conditions, and the predicted price levels may not always accurately reflect the market's current state. This lagging nature can lead to late entry and exit signals.
False Signals: As with any technical analysis tool, the Probability Envelopes Indicator can generate false signals. These occur when the indicator suggests a potential price movement, but the market does not follow through. It is crucial to use other technical analysis tools to confirm the signals and minimize the impact of false signals on your trading decisions.
Complex Statistical Concepts: The Probability Envelopes Indicator relies on complex statistical concepts and calculations, which may be challenging to grasp for some traders, particularly beginners. This complexity can lead to misunderstandings and misuse of the indicator if not adequately understood.
Overemphasis on Past Data: While historical data can be informative, relying too heavily on past performance to predict future movements can be limiting. Market conditions can change rapidly, and relying solely on past data may not provide an accurate representation of the current market environment.
No Guarantees: The Probability Envelopes Indicator, like all technical analysis tools, cannot guarantee success. It is essential to approach trading with realistic expectations and understand that no indicator or strategy can provide foolproof results.
To overcome these limitations, it is crucial to combine the Probability Envelopes Indicator with other technical analysis tools and utilize a comprehensive risk management strategy. By doing so, you can better understand the market and increase your chances of success in the ever-changing financial markets.
Section 8: Probability Envelopes Indicator vs. Bollinger Bands
Bollinger Bands and the Probability Envelopes Indicator are both technical analysis tools designed to identify potential support and resistance levels, as well as potential trend reversals. However, they differ in their underlying concepts, calculations, and applications. This section will provide a deep dive into the differences between these two indicators and how they can complement each other in a trading strategy.
Underlying Concepts and Calculations:
Bollinger Bands:
Bollinger Bands are based on a simple moving average (SMA) of the price data, with upper and lower bands plotted at a specified number of standard deviations away from the SMA.
The distance between the bands widens during periods of increased price volatility and narrows during periods of low volatility, indicating potential trend reversals or breakouts.
The standard settings for Bollinger Bands typically involve a 20-period SMA and a 2 standard deviation distance for the upper and lower bands.
Probability Envelopes Indicator:
The Probability Envelopes Indicator calculates the expected price movements based on historical data and probabilities, utilizing mean and standard deviation calculations for both upward and downward price movements.
It generates upper and lower bands based on the calculated expected mean movement and the standard deviation of historical price changes, multiplied by a user-defined multiplier.
The Probability Envelopes Indicator also allows users to choose between using log returns or percentage changes for the calculations, adding flexibility to the indicator.
Key Differences:
Calculation Method: Bollinger Bands are based on a simple moving average and standard deviations, while the Probability Envelopes Indicator uses statistical probability calculations derived from historical price changes.
Flexibility: The Probability Envelopes Indicator allows users to choose between log returns or percentage changes and adjust the multiplier, offering more customization options compared to Bollinger Bands.
Risk Management: Bollinger Bands primarily focus on volatility, while the Probability Envelopes Indicator incorporates probability calculations to provide additional insights into potential price movements, which can be helpful for risk management purposes.
Complementary Use:
Using both Bollinger Bands and the Probability Envelopes Indicator in your trading strategy can offer valuable insights into market conditions and potential price levels.
Bollinger Bands can provide insights into market volatility and potential breakouts or trend reversals based on the widening or narrowing of the bands.
The Probability Envelopes Indicator can offer additional information on the expected price movements based on historical data and probabilities, which can be helpful in anticipating potential support and resistance levels.
Combining these two indicators can help traders to better understand market dynamics and increase their chances of identifying profitable trading opportunities.
In conclusion, while both Bollinger Bands and the Probability Envelopes Indicator aim to identify potential support and resistance levels, they differ significantly in their underlying concepts, calculations, and applications. By understanding these differences and incorporating both tools into your trading strategy, you can gain a more comprehensive understanding of the market and make more informed trading decisions.
In conclusion, the Probability Envelopes Indicator is a powerful and versatile technical analysis tool that offers unique insights into expected price movements based on historical data and probability calculations. It provides traders with the ability to identify potential support and resistance levels, as well as potential trend reversals. When compared to Bollinger Bands, the Probability Envelopes Indicator offers more customization options and incorporates probability-based calculations for a different perspective on market dynamics.
Although the Probability Envelopes Indicator has its limitations and potential cons, such as the reliance on historical data and the assumption that past performance is indicative of future results, it remains a valuable addition to any trader's toolkit. By using the Probability Envelopes Indicator in conjunction with other technical analysis tools, such as Bollinger Bands, traders can gain a more comprehensive understanding of the market and make more informed trading decisions.
Ultimately, the success of any trading strategy relies on the ability to interpret and apply multiple indicators effectively. The Probability Envelopes Indicator serves as a unique and valuable tool in this regard, providing traders with a deeper understanding of the market and its potential price movements. By utilizing this indicator in combination with other tools and techniques, traders can increase their chances of success and optimize their trading strategies.
Goertzel Browser [Loxx]As the financial markets become increasingly complex and data-driven, traders and analysts must leverage powerful tools to gain insights and make informed decisions. One such tool is the Goertzel Browser indicator, a sophisticated technical analysis indicator that helps identify cyclical patterns in financial data. This powerful tool is capable of detecting cyclical patterns in financial data, helping traders to make better predictions and optimize their trading strategies. With its unique combination of mathematical algorithms and advanced charting capabilities, this indicator has the potential to revolutionize the way we approach financial modeling and trading.
█ Brief Overview of the Goertzel Browser
The Goertzel Browser is a sophisticated technical analysis tool that utilizes the Goertzel algorithm to analyze and visualize cyclical components within a financial time series. By identifying these cycles and their characteristics, the indicator aims to provide valuable insights into the market's underlying price movements, which could potentially be used for making informed trading decisions.
The primary purpose of this indicator is to:
1. Detect and analyze the dominant cycles present in the price data.
2. Reconstruct and visualize the composite wave based on the detected cycles.
3. Project the composite wave into the future, providing a potential roadmap for upcoming price movements.
To achieve this, the indicator performs several tasks:
1. Detrending the price data: The indicator preprocesses the price data using various detrending techniques, such as Hodrick-Prescott filters, zero-lag moving averages, and linear regression, to remove the underlying trend and focus on the cyclical components.
2. Applying the Goertzel algorithm: The indicator applies the Goertzel algorithm to the detrended price data, identifying the dominant cycles and their characteristics, such as amplitude, phase, and cycle strength.
3. Constructing the composite wave: The indicator reconstructs the composite wave by combining the detected cycles, either by using a user-defined list of cycles or by selecting the top N cycles based on their amplitude or cycle strength.
4. Visualizing the composite wave: The indicator plots the composite wave, using solid lines for the past and dotted lines for the future projections. The color of the lines indicates whether the wave is increasing or decreasing.
5. Displaying cycle information: The indicator provides a table that displays detailed information about the detected cycles, including their rank, period, Bartel's test results, amplitude, and phase.
This indicator is a powerful tool that employs the Goertzel algorithm to analyze and visualize the cyclical components within a financial time series. By providing insights into the underlying price movements and their potential future trajectory, the indicator aims to assist traders in making more informed decisions.
█ What is the Goertzel Algorithm?
The Goertzel algorithm, named after Gerald Goertzel, is a digital signal processing technique that is used to efficiently compute individual terms of the Discrete Fourier Transform (DFT). It was first introduced in 1958, and since then, it has found various applications in the fields of engineering, mathematics, and physics.
The Goertzel algorithm is primarily used to detect specific frequency components within a digital signal, making it particularly useful in applications where only a few frequency components are of interest. The algorithm is computationally efficient, as it requires fewer calculations than the Fast Fourier Transform (FFT) when detecting a small number of frequency components. This efficiency makes the Goertzel algorithm a popular choice in applications such as:
1. Telecommunications: The Goertzel algorithm is used for decoding Dual-Tone Multi-Frequency (DTMF) signals, which are the tones generated when pressing buttons on a telephone keypad. By identifying specific frequency components, the algorithm can accurately determine which button has been pressed.
2. Audio processing: The algorithm can be used to detect specific pitches or harmonics in an audio signal, making it useful in applications like pitch detection and tuning musical instruments.
3. Vibration analysis: In the field of mechanical engineering, the Goertzel algorithm can be applied to analyze vibrations in rotating machinery, helping to identify faulty components or signs of wear.
4. Power system analysis: The algorithm can be used to measure harmonic content in power systems, allowing engineers to assess power quality and detect potential issues.
The Goertzel algorithm is used in these applications because it offers several advantages over other methods, such as the FFT:
1. Computational efficiency: The Goertzel algorithm requires fewer calculations when detecting a small number of frequency components, making it more computationally efficient than the FFT in these cases.
2. Real-time analysis: The algorithm can be implemented in a streaming fashion, allowing for real-time analysis of signals, which is crucial in applications like telecommunications and audio processing.
3. Memory efficiency: The Goertzel algorithm requires less memory than the FFT, as it only computes the frequency components of interest.
4. Precision: The algorithm is less susceptible to numerical errors compared to the FFT, ensuring more accurate results in applications where precision is essential.
The Goertzel algorithm is an efficient digital signal processing technique that is primarily used to detect specific frequency components within a signal. Its computational efficiency, real-time capabilities, and precision make it an attractive choice for various applications, including telecommunications, audio processing, vibration analysis, and power system analysis. The algorithm has been widely adopted since its introduction in 1958 and continues to be an essential tool in the fields of engineering, mathematics, and physics.
█ Goertzel Algorithm in Quantitative Finance: In-Depth Analysis and Applications
The Goertzel algorithm, initially designed for signal processing in telecommunications, has gained significant traction in the financial industry due to its efficient frequency detection capabilities. In quantitative finance, the Goertzel algorithm has been utilized for uncovering hidden market cycles, developing data-driven trading strategies, and optimizing risk management. This section delves deeper into the applications of the Goertzel algorithm in finance, particularly within the context of quantitative trading and analysis.
Unveiling Hidden Market Cycles:
Market cycles are prevalent in financial markets and arise from various factors, such as economic conditions, investor psychology, and market participant behavior. The Goertzel algorithm's ability to detect and isolate specific frequencies in price data helps trader analysts identify hidden market cycles that may otherwise go unnoticed. By examining the amplitude, phase, and periodicity of each cycle, traders can better understand the underlying market structure and dynamics, enabling them to develop more informed and effective trading strategies.
Developing Quantitative Trading Strategies:
The Goertzel algorithm's versatility allows traders to incorporate its insights into a wide range of trading strategies. By identifying the dominant market cycles in a financial instrument's price data, traders can create data-driven strategies that capitalize on the cyclical nature of markets.
For instance, a trader may develop a mean-reversion strategy that takes advantage of the identified cycles. By establishing positions when the price deviates from the predicted cycle, the trader can profit from the subsequent reversion to the cycle's mean. Similarly, a momentum-based strategy could be designed to exploit the persistence of a dominant cycle by entering positions that align with the cycle's direction.
Enhancing Risk Management:
The Goertzel algorithm plays a vital role in risk management for quantitative strategies. By analyzing the cyclical components of a financial instrument's price data, traders can gain insights into the potential risks associated with their trading strategies.
By monitoring the amplitude and phase of dominant cycles, a trader can detect changes in market dynamics that may pose risks to their positions. For example, a sudden increase in amplitude may indicate heightened volatility, prompting the trader to adjust position sizing or employ hedging techniques to protect their portfolio. Additionally, changes in phase alignment could signal a potential shift in market sentiment, necessitating adjustments to the trading strategy.
Expanding Quantitative Toolkits:
Traders can augment the Goertzel algorithm's insights by combining it with other quantitative techniques, creating a more comprehensive and sophisticated analysis framework. For example, machine learning algorithms, such as neural networks or support vector machines, could be trained on features extracted from the Goertzel algorithm to predict future price movements more accurately.
Furthermore, the Goertzel algorithm can be integrated with other technical analysis tools, such as moving averages or oscillators, to enhance their effectiveness. By applying these tools to the identified cycles, traders can generate more robust and reliable trading signals.
The Goertzel algorithm offers invaluable benefits to quantitative finance practitioners by uncovering hidden market cycles, aiding in the development of data-driven trading strategies, and improving risk management. By leveraging the insights provided by the Goertzel algorithm and integrating it with other quantitative techniques, traders can gain a deeper understanding of market dynamics and devise more effective trading strategies.
█ Indicator Inputs
src: This is the source data for the analysis, typically the closing price of the financial instrument.
detrendornot: This input determines the method used for detrending the source data. Detrending is the process of removing the underlying trend from the data to focus on the cyclical components.
The available options are:
hpsmthdt: Detrend using Hodrick-Prescott filter centered moving average.
zlagsmthdt: Detrend using zero-lag moving average centered moving average.
logZlagRegression: Detrend using logarithmic zero-lag linear regression.
hpsmth: Detrend using Hodrick-Prescott filter.
zlagsmth: Detrend using zero-lag moving average.
DT_HPper1 and DT_HPper2: These inputs define the period range for the Hodrick-Prescott filter centered moving average when detrendornot is set to hpsmthdt.
DT_ZLper1 and DT_ZLper2: These inputs define the period range for the zero-lag moving average centered moving average when detrendornot is set to zlagsmthdt.
DT_RegZLsmoothPer: This input defines the period for the zero-lag moving average used in logarithmic zero-lag linear regression when detrendornot is set to logZlagRegression.
HPsmoothPer: This input defines the period for the Hodrick-Prescott filter when detrendornot is set to hpsmth.
ZLMAsmoothPer: This input defines the period for the zero-lag moving average when detrendornot is set to zlagsmth.
MaxPer: This input sets the maximum period for the Goertzel algorithm to search for cycles.
squaredAmp: This boolean input determines whether the amplitude should be squared in the Goertzel algorithm.
useAddition: This boolean input determines whether the Goertzel algorithm should use addition for combining the cycles.
useCosine: This boolean input determines whether the Goertzel algorithm should use cosine waves instead of sine waves.
UseCycleStrength: This boolean input determines whether the Goertzel algorithm should compute the cycle strength, which is a normalized measure of the cycle's amplitude.
WindowSizePast and WindowSizeFuture: These inputs define the window size for past and future projections of the composite wave.
FilterBartels: This boolean input determines whether Bartel's test should be applied to filter out non-significant cycles.
BartNoCycles: This input sets the number of cycles to be used in Bartel's test.
BartSmoothPer: This input sets the period for the moving average used in Bartel's test.
BartSigLimit: This input sets the significance limit for Bartel's test, below which cycles are considered insignificant.
SortBartels: This boolean input determines whether the cycles should be sorted by their Bartel's test results.
UseCycleList: This boolean input determines whether a user-defined list of cycles should be used for constructing the composite wave. If set to false, the top N cycles will be used.
Cycle1, Cycle2, Cycle3, Cycle4, and Cycle5: These inputs define the user-defined list of cycles when 'UseCycleList' is set to true. If using a user-defined list, each of these inputs represents the period of a specific cycle to include in the composite wave.
StartAtCycle: This input determines the starting index for selecting the top N cycles when UseCycleList is set to false. This allows you to skip a certain number of cycles from the top before selecting the desired number of cycles.
UseTopCycles: This input sets the number of top cycles to use for constructing the composite wave when UseCycleList is set to false. The cycles are ranked based on their amplitudes or cycle strengths, depending on the UseCycleStrength input.
SubtractNoise: This boolean input determines whether to subtract the noise (remaining cycles) from the composite wave. If set to true, the composite wave will only include the top N cycles specified by UseTopCycles.
█ Exploring Auxiliary Functions
The following functions demonstrate advanced techniques for analyzing financial markets, including zero-lag moving averages, Bartels probability, detrending, and Hodrick-Prescott filtering. This section examines each function in detail, explaining their purpose, methodology, and applications in finance. We will examine how each function contributes to the overall performance and effectiveness of the indicator and how they work together to create a powerful analytical tool.
Zero-Lag Moving Average:
The zero-lag moving average function is designed to minimize the lag typically associated with moving averages. This is achieved through a two-step weighted linear regression process that emphasizes more recent data points. The function calculates a linearly weighted moving average (LWMA) on the input data and then applies another LWMA on the result. By doing this, the function creates a moving average that closely follows the price action, reducing the lag and improving the responsiveness of the indicator.
The zero-lag moving average function is used in the indicator to provide a responsive, low-lag smoothing of the input data. This function helps reduce the noise and fluctuations in the data, making it easier to identify and analyze underlying trends and patterns. By minimizing the lag associated with traditional moving averages, this function allows the indicator to react more quickly to changes in market conditions, providing timely signals and improving the overall effectiveness of the indicator.
Bartels Probability:
The Bartels probability function calculates the probability of a given cycle being significant in a time series. It uses a mathematical test called the Bartels test to assess the significance of cycles detected in the data. The function calculates coefficients for each detected cycle and computes an average amplitude and an expected amplitude. By comparing these values, the Bartels probability is derived, indicating the likelihood of a cycle's significance. This information can help in identifying and analyzing dominant cycles in financial markets.
The Bartels probability function is incorporated into the indicator to assess the significance of detected cycles in the input data. By calculating the Bartels probability for each cycle, the indicator can prioritize the most significant cycles and focus on the market dynamics that are most relevant to the current trading environment. This function enhances the indicator's ability to identify dominant market cycles, improving its predictive power and aiding in the development of effective trading strategies.
Detrend Logarithmic Zero-Lag Regression:
The detrend logarithmic zero-lag regression function is used for detrending data while minimizing lag. It combines a zero-lag moving average with a linear regression detrending method. The function first calculates the zero-lag moving average of the logarithm of input data and then applies a linear regression to remove the trend. By detrending the data, the function isolates the cyclical components, making it easier to analyze and interpret the underlying market dynamics.
The detrend logarithmic zero-lag regression function is used in the indicator to isolate the cyclical components of the input data. By detrending the data, the function enables the indicator to focus on the cyclical movements in the market, making it easier to analyze and interpret market dynamics. This function is essential for identifying cyclical patterns and understanding the interactions between different market cycles, which can inform trading decisions and enhance overall market understanding.
Bartels Cycle Significance Test:
The Bartels cycle significance test is a function that combines the Bartels probability function and the detrend logarithmic zero-lag regression function to assess the significance of detected cycles. The function calculates the Bartels probability for each cycle and stores the results in an array. By analyzing the probability values, traders and analysts can identify the most significant cycles in the data, which can be used to develop trading strategies and improve market understanding.
The Bartels cycle significance test function is integrated into the indicator to provide a comprehensive analysis of the significance of detected cycles. By combining the Bartels probability function and the detrend logarithmic zero-lag regression function, this test evaluates the significance of each cycle and stores the results in an array. The indicator can then use this information to prioritize the most significant cycles and focus on the most relevant market dynamics. This function enhances the indicator's ability to identify and analyze dominant market cycles, providing valuable insights for trading and market analysis.
Hodrick-Prescott Filter:
The Hodrick-Prescott filter is a popular technique used to separate the trend and cyclical components of a time series. The function applies a smoothing parameter to the input data and calculates a smoothed series using a two-sided filter. This smoothed series represents the trend component, which can be subtracted from the original data to obtain the cyclical component. The Hodrick-Prescott filter is commonly used in economics and finance to analyze economic data and financial market trends.
The Hodrick-Prescott filter is incorporated into the indicator to separate the trend and cyclical components of the input data. By applying the filter to the data, the indicator can isolate the trend component, which can be used to analyze long-term market trends and inform trading decisions. Additionally, the cyclical component can be used to identify shorter-term market dynamics and provide insights into potential trading opportunities. The inclusion of the Hodrick-Prescott filter adds another layer of analysis to the indicator, making it more versatile and comprehensive.
Detrending Options: Detrend Centered Moving Average:
The detrend centered moving average function provides different detrending methods, including the Hodrick-Prescott filter and the zero-lag moving average, based on the selected detrending method. The function calculates two sets of smoothed values using the chosen method and subtracts one set from the other to obtain a detrended series. By offering multiple detrending options, this function allows traders and analysts to select the most appropriate method for their specific needs and preferences.
The detrend centered moving average function is integrated into the indicator to provide users with multiple detrending options, including the Hodrick-Prescott filter and the zero-lag moving average. By offering multiple detrending methods, the indicator allows users to customize the analysis to their specific needs and preferences, enhancing the indicator's overall utility and adaptability. This function ensures that the indicator can cater to a wide range of trading styles and objectives, making it a valuable tool for a diverse group of market participants.
The auxiliary functions functions discussed in this section demonstrate the power and versatility of mathematical techniques in analyzing financial markets. By understanding and implementing these functions, traders and analysts can gain valuable insights into market dynamics, improve their trading strategies, and make more informed decisions. The combination of zero-lag moving averages, Bartels probability, detrending methods, and the Hodrick-Prescott filter provides a comprehensive toolkit for analyzing and interpreting financial data. The integration of advanced functions in a financial indicator creates a powerful and versatile analytical tool that can provide valuable insights into financial markets. By combining the zero-lag moving average,
█ In-Depth Analysis of the Goertzel Browser Code
The Goertzel Browser code is an implementation of the Goertzel Algorithm, an efficient technique to perform spectral analysis on a signal. The code is designed to detect and analyze dominant cycles within a given financial market data set. This section will provide an extremely detailed explanation of the code, its structure, functions, and intended purpose.
Function signature and input parameters:
The Goertzel Browser function accepts numerous input parameters for customization, including source data (src), the current bar (forBar), sample size (samplesize), period (per), squared amplitude flag (squaredAmp), addition flag (useAddition), cosine flag (useCosine), cycle strength flag (UseCycleStrength), past and future window sizes (WindowSizePast, WindowSizeFuture), Bartels filter flag (FilterBartels), Bartels-related parameters (BartNoCycles, BartSmoothPer, BartSigLimit), sorting flag (SortBartels), and output buffers (goeWorkPast, goeWorkFuture, cyclebuffer, amplitudebuffer, phasebuffer, cycleBartelsBuffer).
Initializing variables and arrays:
The code initializes several float arrays (goeWork1, goeWork2, goeWork3, goeWork4) with the same length as twice the period (2 * per). These arrays store intermediate results during the execution of the algorithm.
Preprocessing input data:
The input data (src) undergoes preprocessing to remove linear trends. This step enhances the algorithm's ability to focus on cyclical components in the data. The linear trend is calculated by finding the slope between the first and last values of the input data within the sample.
Iterative calculation of Goertzel coefficients:
The core of the Goertzel Browser algorithm lies in the iterative calculation of Goertzel coefficients for each frequency bin. These coefficients represent the spectral content of the input data at different frequencies. The code iterates through the range of frequencies, calculating the Goertzel coefficients using a nested loop structure.
Cycle strength computation:
The code calculates the cycle strength based on the Goertzel coefficients. This is an optional step, controlled by the UseCycleStrength flag. The cycle strength provides information on the relative influence of each cycle on the data per bar, considering both amplitude and cycle length. The algorithm computes the cycle strength either by squaring the amplitude (controlled by squaredAmp flag) or using the actual amplitude values.
Phase calculation:
The Goertzel Browser code computes the phase of each cycle, which represents the position of the cycle within the input data. The phase is calculated using the arctangent function (math.atan) based on the ratio of the imaginary and real components of the Goertzel coefficients.
Peak detection and cycle extraction:
The algorithm performs peak detection on the computed amplitudes or cycle strengths to identify dominant cycles. It stores the detected cycles in the cyclebuffer array, along with their corresponding amplitudes and phases in the amplitudebuffer and phasebuffer arrays, respectively.
Sorting cycles by amplitude or cycle strength:
The code sorts the detected cycles based on their amplitude or cycle strength in descending order. This allows the algorithm to prioritize cycles with the most significant impact on the input data.
Bartels cycle significance test:
If the FilterBartels flag is set, the code performs a Bartels cycle significance test on the detected cycles. This test determines the statistical significance of each cycle and filters out the insignificant cycles. The significant cycles are stored in the cycleBartelsBuffer array. If the SortBartels flag is set, the code sorts the significant cycles based on their Bartels significance values.
Waveform calculation:
The Goertzel Browser code calculates the waveform of the significant cycles for both past and future time windows. The past and future windows are defined by the WindowSizePast and WindowSizeFuture parameters, respectively. The algorithm uses either cosine or sine functions (controlled by the useCosine flag) to calculate the waveforms for each cycle. The useAddition flag determines whether the waveforms should be added or subtracted.
Storing waveforms in matrices:
The calculated waveforms for each cycle are stored in two matrices - goeWorkPast and goeWorkFuture. These matrices hold the waveforms for the past and future time windows, respectively. Each row in the matrices represents a time window position, and each column corresponds to a cycle.
Returning the number of cycles:
The Goertzel Browser function returns the total number of detected cycles (number_of_cycles) after processing the input data. This information can be used to further analyze the results or to visualize the detected cycles.
The Goertzel Browser code is a comprehensive implementation of the Goertzel Algorithm, specifically designed for detecting and analyzing dominant cycles within financial market data. The code offers a high level of customization, allowing users to fine-tune the algorithm based on their specific needs. The Goertzel Browser's combination of preprocessing, iterative calculations, cycle extraction, sorting, significance testing, and waveform calculation makes it a powerful tool for understanding cyclical components in financial data.
█ Generating and Visualizing Composite Waveform
The indicator calculates and visualizes the composite waveform for both past and future time windows based on the detected cycles. Here's a detailed explanation of this process:
Updating WindowSizePast and WindowSizeFuture:
The WindowSizePast and WindowSizeFuture are updated to ensure they are at least twice the MaxPer (maximum period).
Initializing matrices and arrays:
Two matrices, goeWorkPast and goeWorkFuture, are initialized to store the Goertzel results for past and future time windows. Multiple arrays are also initialized to store cycle, amplitude, phase, and Bartels information.
Preparing the source data (srcVal) array:
The source data is copied into an array, srcVal, and detrended using one of the selected methods (hpsmthdt, zlagsmthdt, logZlagRegression, hpsmth, or zlagsmth).
Goertzel function call:
The Goertzel function is called to analyze the detrended source data and extract cycle information. The output, number_of_cycles, contains the number of detected cycles.
Initializing arrays for past and future waveforms:
Three arrays, epgoertzel, goertzel, and goertzelFuture, are initialized to store the endpoint Goertzel, non-endpoint Goertzel, and future Goertzel projections, respectively.
Calculating composite waveform for past bars (goertzel array):
The past composite waveform is calculated by summing the selected cycles (either from the user-defined cycle list or the top cycles) and optionally subtracting the noise component.
Calculating composite waveform for future bars (goertzelFuture array):
The future composite waveform is calculated in a similar way as the past composite waveform.
Drawing past composite waveform (pvlines):
The past composite waveform is drawn on the chart using solid lines. The color of the lines is determined by the direction of the waveform (green for upward, red for downward).
Drawing future composite waveform (fvlines):
The future composite waveform is drawn on the chart using dotted lines. The color of the lines is determined by the direction of the waveform (fuchsia for upward, yellow for downward).
Displaying cycle information in a table (table3):
A table is created to display the cycle information, including the rank, period, Bartel value, amplitude (or cycle strength), and phase of each detected cycle.
Filling the table with cycle information:
The indicator iterates through the detected cycles and retrieves the relevant information (period, amplitude, phase, and Bartel value) from the corresponding arrays. It then fills the table with this information, displaying the values up to six decimal places.
To summarize, this indicator generates a composite waveform based on the detected cycles in the financial data. It calculates the composite waveforms for both past and future time windows and visualizes them on the chart using colored lines. Additionally, it displays detailed cycle information in a table, including the rank, period, Bartel value, amplitude (or cycle strength), and phase of each detected cycle.
█ Enhancing the Goertzel Algorithm-Based Script for Financial Modeling and Trading
The Goertzel algorithm-based script for detecting dominant cycles in financial data is a powerful tool for financial modeling and trading. It provides valuable insights into the past behavior of these cycles and potential future impact. However, as with any algorithm, there is always room for improvement. This section discusses potential enhancements to the existing script to make it even more robust and versatile for financial modeling, general trading, advanced trading, and high-frequency finance trading.
Enhancements for Financial Modeling
Data preprocessing: One way to improve the script's performance for financial modeling is to introduce more advanced data preprocessing techniques. This could include removing outliers, handling missing data, and normalizing the data to ensure consistent and accurate results.
Additional detrending and smoothing methods: Incorporating more sophisticated detrending and smoothing techniques, such as wavelet transform or empirical mode decomposition, can help improve the script's ability to accurately identify cycles and trends in the data.
Machine learning integration: Integrating machine learning techniques, such as artificial neural networks or support vector machines, can help enhance the script's predictive capabilities, leading to more accurate financial models.
Enhancements for General and Advanced Trading
Customizable indicator integration: Allowing users to integrate their own technical indicators can help improve the script's effectiveness for both general and advanced trading. By enabling the combination of the dominant cycle information with other technical analysis tools, traders can develop more comprehensive trading strategies.
Risk management and position sizing: Incorporating risk management and position sizing functionality into the script can help traders better manage their trades and control potential losses. This can be achieved by calculating the optimal position size based on the user's risk tolerance and account size.
Multi-timeframe analysis: Enhancing the script to perform multi-timeframe analysis can provide traders with a more holistic view of market trends and cycles. By identifying dominant cycles on different timeframes, traders can gain insights into the potential confluence of cycles and make better-informed trading decisions.
Enhancements for High-Frequency Finance Trading
Algorithm optimization: To ensure the script's suitability for high-frequency finance trading, optimizing the algorithm for faster execution is crucial. This can be achieved by employing efficient data structures and refining the calculation methods to minimize computational complexity.
Real-time data streaming: Integrating real-time data streaming capabilities into the script can help high-frequency traders react to market changes more quickly. By continuously updating the cycle information based on real-time market data, traders can adapt their strategies accordingly and capitalize on short-term market fluctuations.
Order execution and trade management: To fully leverage the script's capabilities for high-frequency trading, implementing functionality for automated order execution and trade management is essential. This can include features such as stop-loss and take-profit orders, trailing stops, and automated trade exit strategies.
While the existing Goertzel algorithm-based script is a valuable tool for detecting dominant cycles in financial data, there are several potential enhancements that can make it even more powerful for financial modeling, general trading, advanced trading, and high-frequency finance trading. By incorporating these improvements, the script can become a more versatile and effective tool for traders and financial analysts alike.
█ Understanding the Limitations of the Goertzel Algorithm
While the Goertzel algorithm-based script for detecting dominant cycles in financial data provides valuable insights, it is important to be aware of its limitations and drawbacks. Some of the key drawbacks of this indicator are:
Lagging nature:
As with many other technical indicators, the Goertzel algorithm-based script can suffer from lagging effects, meaning that it may not immediately react to real-time market changes. This lag can lead to late entries and exits, potentially resulting in reduced profitability or increased losses.
Parameter sensitivity:
The performance of the script can be sensitive to the chosen parameters, such as the detrending methods, smoothing techniques, and cycle detection settings. Improper parameter selection may lead to inaccurate cycle detection or increased false signals, which can negatively impact trading performance.
Complexity:
The Goertzel algorithm itself is relatively complex, making it difficult for novice traders or those unfamiliar with the concept of cycle analysis to fully understand and effectively utilize the script. This complexity can also make it challenging to optimize the script for specific trading styles or market conditions.
Overfitting risk:
As with any data-driven approach, there is a risk of overfitting when using the Goertzel algorithm-based script. Overfitting occurs when a model becomes too specific to the historical data it was trained on, leading to poor performance on new, unseen data. This can result in misleading signals and reduced trading performance.
No guarantee of future performance: While the script can provide insights into past cycles and potential future trends, it is important to remember that past performance does not guarantee future results. Market conditions can change, and relying solely on the script's predictions without considering other factors may lead to poor trading decisions.
Limited applicability: The Goertzel algorithm-based script may not be suitable for all markets, trading styles, or timeframes. Its effectiveness in detecting cycles may be limited in certain market conditions, such as during periods of extreme volatility or low liquidity.
While the Goertzel algorithm-based script offers valuable insights into dominant cycles in financial data, it is essential to consider its drawbacks and limitations when incorporating it into a trading strategy. Traders should always use the script in conjunction with other technical and fundamental analysis tools, as well as proper risk management, to make well-informed trading decisions.
█ Interpreting Results
The Goertzel Browser indicator can be interpreted by analyzing the plotted lines and the table presented alongside them. The indicator plots two lines: past and future composite waves. The past composite wave represents the composite wave of the past price data, and the future composite wave represents the projected composite wave for the next period.
The past composite wave line displays a solid line, with green indicating a bullish trend and red indicating a bearish trend. On the other hand, the future composite wave line is a dotted line with fuchsia indicating a bullish trend and yellow indicating a bearish trend.
The table presented alongside the indicator shows the top cycles with their corresponding rank, period, Bartels, amplitude or cycle strength, and phase. The amplitude is a measure of the strength of the cycle, while the phase is the position of the cycle within the data series.
Interpreting the Goertzel Browser indicator involves identifying the trend of the past and future composite wave lines and matching them with the corresponding bullish or bearish color. Additionally, traders can identify the top cycles with the highest amplitude or cycle strength and utilize them in conjunction with other technical indicators and fundamental analysis for trading decisions.
This indicator is considered a repainting indicator because the value of the indicator is calculated based on the past price data. As new price data becomes available, the indicator's value is recalculated, potentially causing the indicator's past values to change. This can create a false impression of the indicator's performance, as it may appear to have provided a profitable trading signal in the past when, in fact, that signal did not exist at the time.
The Goertzel indicator is also non-endpointed, meaning that it is not calculated up to the current bar or candle. Instead, it uses a fixed amount of historical data to calculate its values, which can make it difficult to use for real-time trading decisions. For example, if the indicator uses 100 bars of historical data to make its calculations, it cannot provide a signal until the current bar has closed and become part of the historical data. This can result in missed trading opportunities or delayed signals.
█ Conclusion
The Goertzel Browser indicator is a powerful tool for identifying and analyzing cyclical patterns in financial markets. Its ability to detect multiple cycles of varying frequencies and strengths make it a valuable addition to any trader's technical analysis toolkit. However, it is important to keep in mind that the Goertzel Browser indicator should be used in conjunction with other technical analysis tools and fundamental analysis to achieve the best results. With continued refinement and development, the Goertzel Browser indicator has the potential to become a highly effective tool for financial modeling, general trading, advanced trading, and high-frequency finance trading. Its accuracy and versatility make it a promising candidate for further research and development.
█ Footnotes
What is the Bartels Test for Cycle Significance?
The Bartels Cycle Significance Test is a statistical method that determines whether the peaks and troughs of a time series are statistically significant. The test is named after its inventor, George Bartels, who developed it in the mid-20th century.
The Bartels test is designed to analyze the cyclical components of a time series, which can help traders and analysts identify trends and cycles in financial markets. The test calculates a Bartels statistic, which measures the degree of non-randomness or autocorrelation in the time series.
The Bartels statistic is calculated by first splitting the time series into two halves and calculating the range of the peaks and troughs in each half. The test then compares these ranges using a t-test, which measures the significance of the difference between the two ranges.
If the Bartels statistic is greater than a critical value, it indicates that the peaks and troughs in the time series are non-random and that there is a significant cyclical component to the data. Conversely, if the Bartels statistic is less than the critical value, it suggests that the peaks and troughs are random and that there is no significant cyclical component.
The Bartels Cycle Significance Test is particularly useful in financial analysis because it can help traders and analysts identify significant cycles in asset prices, which can in turn inform investment decisions. However, it is important to note that the test is not perfect and can produce false signals in certain situations, particularly in noisy or volatile markets. Therefore, it is always recommended to use the test in conjunction with other technical and fundamental indicators to confirm trends and cycles.
Deep-dive into the Hodrick-Prescott Fitler
The Hodrick-Prescott (HP) filter is a statistical tool used in economics and finance to separate a time series into two components: a trend component and a cyclical component. It is a powerful tool for identifying long-term trends in economic and financial data and is widely used by economists, central banks, and financial institutions around the world.
The HP filter was first introduced in the 1990s by economists Robert Hodrick and Edward Prescott. It is a simple, two-parameter filter that separates a time series into a trend component and a cyclical component. The trend component represents the long-term behavior of the data, while the cyclical component captures the shorter-term fluctuations around the trend.
The HP filter works by minimizing the following objective function:
Minimize: (Sum of Squared Deviations) + λ (Sum of Squared Second Differences)
Where:
The first term represents the deviation of the data from the trend.
The second term represents the smoothness of the trend.
λ is a smoothing parameter that determines the degree of smoothness of the trend.
The smoothing parameter λ is typically set to a value between 100 and 1600, depending on the frequency of the data. Higher values of λ lead to a smoother trend, while lower values lead to a more volatile trend.
The HP filter has several advantages over other smoothing techniques. It is a non-parametric method, meaning that it does not make any assumptions about the underlying distribution of the data. It also allows for easy comparison of trends across different time series and can be used with data of any frequency.
However, the HP filter also has some limitations. It assumes that the trend is a smooth function, which may not be the case in some situations. It can also be sensitive to changes in the smoothing parameter λ, which may result in different trends for the same data. Additionally, the filter may produce unrealistic trends for very short time series.
Despite these limitations, the HP filter remains a valuable tool for analyzing economic and financial data. It is widely used by central banks and financial institutions to monitor long-term trends in the economy, and it can be used to identify turning points in the business cycle. The filter can also be used to analyze asset prices, exchange rates, and other financial variables.
The Hodrick-Prescott filter is a powerful tool for analyzing economic and financial data. It separates a time series into a trend component and a cyclical component, allowing for easy identification of long-term trends and turning points in the business cycle. While it has some limitations, it remains a valuable tool for economists, central banks, and financial institutions around the world.

JS-TechTrading: Supertrend-Strategy_Basic versionAre you looking for a reliable and profitable algorithmic trading strategy for TradingView? If so, you might be interested in our Supertrend basic strategy, which is based on three powerful indicators: Supertrend (ATR), RSI and EMA.
Supertrend is a trend-following indicator that helps you identify the direction and strength of the market. It also gives you clear signals for entry and exit points based on price movements.
RSI is a momentum indicator that measures the speed and change of price movements. It helps you filter out false signals and avoid overbought or oversold conditions.
EMA is a moving average indicator that smooths out price fluctuations and shows you the long-term trend of the market. It helps you confirm the validity of your trades and avoid trading against the trend.
Our Supertrend basic strategy combines these three indicators to give you a simple yet effective way to trade any market. Here's how it works:
- For long trades, you enter when the price is above Supertrend and pulls back below it (the low of the candle crosses Supertrend) and then rebounds above it (the high of the next candle goes above the pullback candle). You exit when the price closes below Supertrend or when you reach your target profit or stop loss.
- For short trades, you enter when the price is below Supertrend and pulls back above it (the high of the candle crosses Supertrend) and then drops below it (the low of the next candle goes below the pullback candle). You exit when the price closes above Supertrend or when you reach your target profit or stop loss.
- You can also use RSI and EMA filters to improve your results. For long trades, you only enter if RSI is above 50 and price is above 200 EMA. For short trades, you only enter if RSI is below 50 and price is below 200 EMA.
- You can set your stop loss and target profit as a percentage of your entry price or based on other criteria. You can also adjust the parameters of each indicator according to your preferences and risk tolerance.
Our Supertrend basic strategy is easy to use and has been tested on various markets and time frames. It can help you capture consistent profits while minimizing your losses.

Height of Candle BodyUnderstanding the Height of Candlestick Body
Candlestick charts are a popular method of displaying price data in financial markets. They provide a visual representation of price movements and are used by traders to make informed decisions about buying and selling assets. Understanding the height of a candlestick body is an important aspect of technical analysis and can help traders identify trends and make profitable trades.
The height of a candlestick body is the distance between the opening and closing price of an asset over a given time period. When the closing price is higher than the opening price, the candlestick body is typically colored green or white and is considered bullish. Conversely, when the closing price is lower than the opening price, the candlestick body is typically colored red or black and is considered bearish.
The height of the candlestick body is important because it can provide valuable information about market sentiment. If the candlestick body is relatively small, it suggests that there is indecision in the market and that buyers and sellers are evenly matched. Conversely, if the candlestick body is relatively large, it suggests that there is a significant amount of buying or selling pressure in the market.
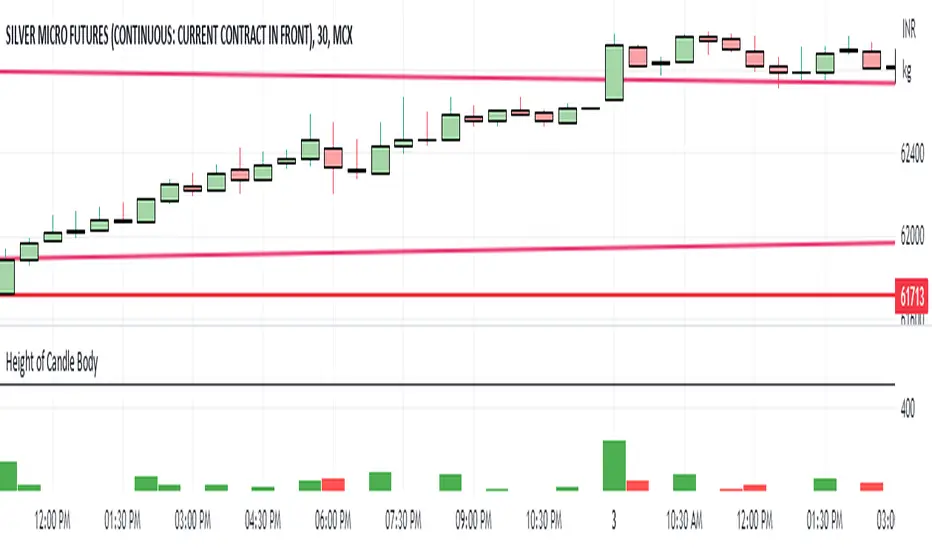
Refracted EMA for trendThis script is an evolution of "Refracted EMA" by fract, that you can find here:
The differences are in the design and intended uses of its early and pretty reliable signals.
This is a trend indicator, with signals and alerts, usable on any timeframe.
Note: 3 color themes are included: Light, dark, and my personal dark one. Feel free to change them in the code, and to remove the ones you don't need.
HOW TO USE IT?
When it gives a signal (arrow), a horizontal line starts, and expands until there's a signal in the opposite direction.
As long as the price moves away from this line, then the move should logically be profitable
If the price ranges, or turns back in direction of the line, then it might be time to reconsider.
The background colors offer a complement of information:
- When the price moves away from the line, the bgcolor is normal.
- When there has been 2 candles in the opposite direction, then the bgcolor turns a little darker. It might be an early sign of range or reversal.
- When the current price breaks through the signal's closing price, the bgcolor turns gray or black (depending on the theme and colors you chose), signaling a significative divergence with the signal, and a possible reversal. It is common though, for the first candle after the signal to go in the opposite direction. It might be a good idea to wait at least 2 candles after the signal.
You can switch the alerts on, by right clicking the chart and clicking "add alert". Alerts happen only after the close of the candle. They display the timeframe they were added on.
TRICKS
- If up and down arrows alternate quickly, then the market is undecided, and it might not be a good idea to trade. Or maybe on other timeframes.
- Trading against the indicator's direction is probably not a good idea, unless there is a very VERY good reason for this (like buying the dip of an up trend, for ex).
- Looking at different timeframes quickly reveals the bigger picture of the price movements. For ex, if the 4h, 1h, 30 min are bullish, but the 5 min bearish, then there might be a long opportunity. But if the 5 min is bearish, and the 10 min turns bearish, and the 30 min turns bearish too, then there might be a reversal on its way.
- The line can be used as a reference to decide where to place your stop loss. It is rare that the price crosses this line, but it can absolutely happen. So use this idea with caution, manage and protect your positions wisely.
- You can, and probably should, use the alerts on different timeframes at the same time, to constantly update your understanding of the trend.
DO NOT BASE YOUR TRADING DECISIONS ON 1 SINGLE INDICATOR'S SIGNALS.
Always confirm your ideas by other means, like price action and indicators of a different nature.

Double Supertrend Entry with ADX Filter and ATR Exits/EntriesThe Double Supertrend Entry with ADX Filter and ATR Exits/Entries indicator is a custom trading strategy designed to help traders identify potential buy and sell signals in trending markets. This indicator combines the strengths of multiple technical analysis tools, enhancing the effectiveness of the overall strategy.
Key features:
Two Supertrend Indicators - The indicator includes two Supertrend indicators with customizable parameters. These trend-following indicators calculate upper and lower trendlines based on the ATR and price. Buy signals are generated when the price crosses above both trendlines, and sell signals are generated when the price crosses below both trendlines.
ADX Filter - The Average Directional Index (ADX) is used to filter out weak trends and only generate buy/sell signals when the market exhibits a strong trend. The ADX measures the strength of the trend, and a customizable threshold level ensures that trades are only entered during strong trends.
ATR-based Exits and Entries - The indicator uses the Average True Range (ATR) to set profit target and stop-loss levels. ATR is a measure of market volatility, and these levels help traders determine when to exit a trade to secure profit or minimize loss.
Performance Statistics Table - A table is displayed on the chart, recording and showing the total number of winning trades, losing trades, percentage of profitable trades, average profit, and average loss. This information helps traders evaluate the performance of the strategy over time.
The Double Supertrend Entry with ADX Filter and ATR Exits/Entries indicator is a powerful trend-following strategy that can assist traders in making more informed decisions in the financial markets. By combining multiple technical analysis tools and providing performance statistics, this indicator helps traders improve their trading strategy and evaluate its success.

On-Chart QQE of RSI on Variety MA [Loxx]On-Chart QQE of RSI on Variety MA (Quantitative Qualitative Estimation) is usually calculated using RSI. This version is uses an RSI of a Moving Average instead. The results are completely different than the original QQE. Also, this version is drawn directly on chart. There are four types of signals.
What is QQE?
Quantitative Qualitative Estimation (QQE) is a technical analysis indicator used to identify trends and trading opportunities in financial markets. It is based on a combination of two popular technical analysis indicators - the Relative Strength Index (RSI) and Moving Averages (MA).
The QQE indicator uses a smoothed RSI to determine the trend direction, and a moving average of the smoothed RSI to identify potential trend changes. The indicator then plots a series of bands above and below the moving average to indicate overbought and oversold conditions in the market.
The QQE indicator is designed to provide traders with a reliable signal that confirms the strength of a trend or indicates a possible trend reversal. It is particularly useful for traders who are looking to trade in markets that are trending strongly, but also want to identify when a trend is losing momentum or reversing.
Traders can use QQE in a number of different ways, including as a confirmation tool for other indicators or as a standalone indicator. For example, when used in conjunction with other technical analysis tools like support and resistance levels, the QQE indicator can help traders identify key entry and exit points for their trades.
One of the main advantages of the QQE indicator is that it is designed to be more reliable than other indicators that can generate false signals. By smoothing out the price action, the QQE indicator can provide traders with more accurate and reliable signals, which can help them make more profitable trading decisions.
In conclusion, QQE is a popular technical analysis indicator that traders use to identify trends and trading opportunities in financial markets. It combines the RSI and moving average indicators and is designed to provide traders with reliable signals that confirm the strength of a trend or indicate a possible trend reversal.
What is RSI?
RSI stands for Relative Strength Index . It is a technical indicator used to measure the strength or weakness of a financial instrument's price action.
The RSI is calculated based on the price movement of an asset over a specified period of time, typically 14 days, and is expressed on a scale of 0 to 100. The RSI is considered overbought when it is above 70 and oversold when it is below 30.
Traders and investors use the RSI to identify potential buy and sell signals. When the RSI indicates that an asset is oversold, it may be considered a buying opportunity, while an overbought RSI may signal that it is time to sell or take profits.
It's important to note that the RSI should not be used in isolation and should be used in conjunction with other technical and fundamental analysis tools to make informed trading decisions.
This indicator makes use of the following libraries:
Loxx's Moving Averages
Loxx's Expanded Source Types
Extras
Alerts
Signals
Signal Types
Change on Levels
Change on Slope
Change on Zero
Change on Original

Impulse Momentum MACD - Slow and FastImpulse Momentum MACD - Slow and Fast
The Momentum indicator is a technical indicator that measures the speed and strength of the price movement of a financial asset. This indicator is used to identify the underlying strength of a trend and predict potential changes in price direction, when the indicator crosses the zero line, it can signal a change of direction in the price trend.
On the other hand, the MACD is an indicator used to identify the trend and strength of the market and shows the difference between two exponential moving averages ( EMA ) of different periods. The MACD is commonly used to determine the direction of an asset's price trend.
COPOSITION AND USE OF THE INDICATOR
This script is an implementation of the Impulse Momentum MACD indicator with two variations: slow and fast. It uses a combination of the Momentum indicator and the Moving Average Convergence/Divergence (MACD) indicator to identify trend reversals and momentum changes in an asset's price.
The combination of both indicators can help traders identify market entry and exit opportunities. The Impulse Momentum MACD is a Modified MACD, it is formed by filtering the values in a range of Modifiable Moving Averages by calculating their high and low ranges,This indicator has two parts: a slow part and a fast part. The slow part uses input values for the lengths of the moving averages and the length of the signal for the MACD indicator. The fast part uses different input values for the lengths of the moving averages. Also, each part has its own set of line colors and histogram colors for easy visualization.
The script also includes inputs to choose the type of moving average to use (SMA, EMA, etc.), the lookback period, the colors for the histogram lines and bars, and a zero trend line (also known as a horizontal trend line). ).
* Highest performing custom settings for the zero trend line. For Operations of:
- One Minute: Trend Line Time Frame = Five Minutes.
- Three Minutes: Trend Line Time Frame = Fifteen Minutes.
- Five Minutes: Trend Line Time Frame = Thirty Minutes.
- Fifteen Minutes: Trend Line Time Frame = Sixty Minutes.
Rules For Trading
🔹 Bullish:
* The Zero Horizontal Trend Line should be in Green Color.
* The Slow Histogram Bar should be in Green Color.
* The Fast Histogram Bar must be in Blue or Black Color or No Bar Appears.
* The Momentum Line or Momentum Area must be in Green Color.
crosses:
- When the Impulse Momentum MACD Slow line crosses the Impulse Momentum MACD Slow signal line upwards.
- When the Impulse Momentum MACD Fast line crosses the Impulse Momentum MACD Fast signal line upwards.
- Note 1: A Position is Opened when the condition of any of the aforementioned crossovers is met.
- Note 2: If the two aforementioned crossings anticipate the condition of the Zero Horizontal Tendency Line because it is in Red; A position is only opened immediately when the Zero Horizontal Trend line turns Green.
🔹 Bearish:
* The Zero Horizontal Trend Line should be in Red Color.
* The Slow Histogram Bar should be in Red Color.
* The Fast Histogram Bar must be in Blue or Black Color or No Bar Appears.
* The Momentum Line or Momentum Area must be in Red Color.
crosses:
- When the Impulse Momentum MACD Slow line crosses the Impulse Momentum MACD Slow signal line downwards.
- When the Impulse Momentum MACD Fast line crosses the Impulse Momentum MACD Fast signal line downwards.
- Note 1: A Position is Opened when the condition of any of the aforementioned crossovers is met.
- Note 2: If the two aforementioned crossings anticipate the condition of the Zero Horizontal Tendency Line because it is Green, an immediate position is only opened when the Zero Horizontal Tendency line turns Red.
This script can be used in different markets such as forex, indices and cryptocurrencies for analysis and trading. However, it is important to note that no trading strategy is guaranteed to be profitable, and traders should always conduct their own research and risk management.
The Flash-Strategy (Momentum-RSI, EMA-crossover, ATR)The Flash-Strategy (Momentum-RSI, EMA-crossover, ATR)
Are you tired of manually analyzing charts and trying to find profitable trading opportunities? Look no further! Our algorithmic trading strategy, "Flash," is here to simplify your trading process and maximize your profits.
Flash is an advanced trading algorithm that combines three powerful indicators to generate highly selective and accurate trading signals. The Momentum-RSI, Super-Trend Analysis and EMA-Strategy indicators are used to identify the strength and direction of the underlying trend.
The Momentum-RSI signals the strength of the trend and only generates trading signals in confirmed upward or downward trends. The Super-Trend Analysis confirms the trend direction and generates signals when the price breaks through the super-trend line. The EMA-Strategy is used as a qualifier for the generation of trading signals, where buy signals are generated when the EMA crosses relevant trend lines.
Flash is highly selective, as it only generates trading signals when all three indicators align. This ensures that only the highest probability trades are taken, resulting in maximum profits.
Our trading strategy also comes with two profit management options. Option 1 uses the so-called supertrend-indicator which uses the dynamic ATR as a key input, while option 2 applies pre-defined, fixed SL and TP levels.
The settings for each indicator can be customized, allowing you to adjust the length, limit value, factor, and source value to suit your preferences. You can also set the time period in which you want to run the backtest and how many dollar trades you want to open in each position for fully automated trading.
Choose your preferred trade direction and stop-loss/take-profit settings, and let Flash do the rest. Say goodbye to manual chart analysis and hello to consistent profits with Flash. Try it now!
General Comments
This Flash Strategy has been developed in cooperation between Baby_whale_to_moon and JS-TechTrading. Cudos to Baby_whale_to_moon for doing a great job in transforming sophisticated trading ideas into pine scripts.
Detailed Description
The “Flash” script considers the following indicators for the generation of trading signals:
1. Momentum-RSI
2. ‘Super-Trend’-Analysis
3. EMA-Strategy
1. Momentum-RSI
• This indicator signals the strength of the underlying upward- or downward-trend.
• The signal range of this indicator is from 0 to 100. Values > 60 indicate a confirmed upward- or downward-trend.
• The strategy will only generate trading signals in case the stock (or any other financial security) is in a confirmed upward- (long entry signals) or downward-trend (short entry signals).
• This indicator provides information with regards to the strength of the underlying trend and it does not give any insight with regard to the direction of the trend. Therefore, this strategy also considers other indicators which provide technical confirmation with regards to the direction of the underlying trend.
Graph 1 shows this concept:
• The Momentum-RSI indicator gives lower readings during consolidation phases and no trading signals are generated during these periods.
Example (graph 2):
2. Super-Trend Analysis
• The red line in the graph below represents the so-called super-trend-line. Trading signals are only generated in case the price action breaks through this super-trend-line indicating a new confirmed upward-trend (or downward-trend, respectively).
• If that happens, the super trend-line changes its color from red to green, giving confirmation that the trend changed from bearish to bullish and long-entries can be considered.
• The vice-versa approach can be considered for short entries.
Graph 3 explains this concept:
3. Exponential Moving Average / EMA-Strategy
The functionality of this EMA-element of the strategy has been programmed as follows:
• The exponential moving average and two other trend lines are being used as qualifiers for the generation of trading-signals.
• Buy-signals for long-entries are only considered in case the EMA (yellow line in the graph below) crosses the red line.
• Sell-signals for short-entries are only considered in case the EMA (yellow line in the graph below) crosses the green line.
An example is shown in graph 4 below:
We use this indicator to determine the new trend direction that may occur by using the data of the price's past movement.
4. Bringing it all together
This section describes in detail, how this strategy combines the Momentum-RSI, the super-trend analysis and the EMA-strategy.
The strategy only generates trading-signals in case all of the following conditions and qualifiers are being met:
1. Momentum-RSI is higher than the set value of this strategy. The standard and recommended value is 60 (graph 5):
2. The super-trend analysis needs to indicate a confirmed upward-trend (for long-entry signals) or a confirmed downward-trend (for short-entry signals), respectively.
3. The EMA-strategy needs to indicate that the stock or financial security is in a confirmed upward-trend (long-entries) or downward-trend (short-entries), respectively.
The strategy will only generate trading signals if all three qualifiers are being met. This makes this strategy highly selective and is the key secret for its success.
Example for Long-Entry (graph 6):
When these conditions are met, our Long position is opened.
Example for Short-Entry (graph 7):
Trade Management Options (graph 8)
Option 1
In this dynamic version, the so-called supertrend-indicator is being used for the trade exit management. This supertrend-indicator is a sophisticated and optimized methodology which uses the dynamic ATR as one of its key input parameters.
The following settings of the supertrend-indicator can be changed and optimized (graph 9):
The dynamic SL/TP-lines of the supertrend-indicator are shown in the charts. The ATR-length and the supertrend-factor result in a multiplier value which can be used to fine-tune and optimize this strategy based on the financial security, timeframe and overall market environment.
Option 2 (graph 10):
Option 2 applies pre-defined, fixed SL and TP levels which will appear as straight horizontal lines in the chart.
Settings options (graph 11):
The following settings can be changed for the three elements of this strategy:
1. (Length Mom-Rsi): Length of our Mom-RSI indicator.
2. Mom-RSI Limit Val: the higher this number, the more momentum of the underlying trend is required before the strategy will start creating trading signals.
3. The length and factor values of the super trend indicator can be adjusted:ATR Length SuperTrend and Factor Super Trend
4. You can set the source value used by the ema trend indicator to determine the ema line: Source Ema Ind
5. You can set the EMA length and the percentage value to follow the price: Length Ema Ind and Percent Ema Ind
6. The backtesting period can be adjusted: Start and End time of BackTest
7. Dollar cost per position: this is relevant for 100% fully automated trading.
8. Trade direction can be adjusted: LONG, SHORT or BOTH
9. As we explained above, we can determine our stop-loss and take-profit levels dynamically or statically. (Version 1 or Version 2 )
Display options on the charts graph 12):
1. Show horizontal lines for the Stop-Loss and Take-profit levels on the charts.
2. Display relevant Trend Lines, including color setting options for the supertrend functionality. In the example below, green lines indicate a confirmed uptrend, red lines indicate a confirmed downtrend.
Other comments
• This indicator has been optimized to be applied for 1 hour-charts. However, the underlying principles of this strategy are supply and demand in the financial markets and the strategy can be applied to all timeframes. Daytraders can use the 1min- or 5min charts, swing-traders can use the daily charts.
• This strategy has been designed to identify the most promising, highest probability entries and trades for each stock or other financial security.
• The combination of the qualifiers results in a highly selective strategy which only considers the most promising swing-trading entries. As a result, you will normally only find a low number of trades for each stock or other financial security per year in case you apply this strategy for the daily charts. Shorter timeframes will result in a higher number of trades / year.
• Consequently, traders need to apply this strategy for a full watchlist rather than just one financial security.

Advanced VWAP_Pullback Strategy_Trend-Template QualifierGeneral Description and Unique Features of this Script
Introducing the Advanced VWAP Momentum-Pullback Strategy (long-only) that offers several unique features:
1. Our script/strategy utilizes Mark Minervini's Trend-Template as a qualifier for identifying stocks and other financial securities in confirmed uptrends. Mark Minervini, a 2x US Investment Champion, developed the Trend-Template, which covers eight different and independent characteristics that can be adjusted and optimized in this trend-following strategy to ensure the best results. The strategy will only trigger buy-signals in case the optimized qualifiers are being met.
2. Our strategy is based on the supply/demand balance in the market, making it timeless and effective across all timeframes. Whether you are day trading using 1- or 5-min charts or swing-trading using daily charts, this strategy can be applied and works very well.
3. We have also integrated technical indicators such as the RSI and the MA / VWAP crossover into this strategy to identify low-risk pullback entries in the context of confirmed uptrends. By doing so, the risk profile of this strategy and drawdowns are being reduced to an absolute minimum.
Minervini’s Trend-Template and the ‘Stage-Analysis’ of the Markets
This strategy is a so-called 'long-only' strategy. This means that we only take long positions, short positions are not considered.
The best market environment for such strategies are periods of stable upward trends in the so-called stage 2 - uptrend.
In stable upward trends, we increase our market exposure and risk.
In sideways markets and downward trends or bear markets, we reduce our exposure very quickly or go 100% to cash and wait for the markets to recover and improve. This allows us to avoid major losses and drawdowns.
This simple rule gives us a significant advantage over most undisciplined traders and amateurs!
'The Trend is your Friend'. This is a very old but true quote.
What's behind it???
• 98% of stocks made their biggest gains in a Phase 2 upward trend.
• If a stock is in a stable uptrend, this is evidence that larger institutions are buying the stock sustainably.
• By focusing on stocks that are in a stable uptrend, the chances of profit are significantly increased.
• In a stable uptrend, investors know exactly what to expect from further price developments. This makes it possible to locate low-risk entry points.
The goal is not to buy at the lowest price – the goal is to buy at the right price!
Each stock goes through the same maturity cycle – it starts at stage 1 and ends at stage 4
Stage 1 – Neglect Phase – Consolidation
Stage 2 – Progressive Phase – Accumulation
Stage 3 – Topping Phase – Distribution
Stage 4 – Downtrend – Capitulation
This strategy focuses on identifying stocks in confirmed stage 2 uptrends. This in itself gives us an advantage over long-term investors and less professional traders.
By focusing on stocks in a stage 2 uptrend, we avoid losses in downtrends (stage 4) or less profitable consolidation phases (stages 1 and 3). We are fully invested and put our money to work for us, and we are fully invested when stocks are in their stage 2 uptrends.
But how can we use technical chart analysis to find stocks that are in a stable stage 2 uptrend?
Mark Minervini has developed the so-called 'trend template' for this purpose. This is an essential part of our JS-TechTrading pullback strategy. For our watchlists, only those individual values that meet the tough requirements of Minervini's trend template are eligible.
The Trend Template
• 200d MA increasing over a period of at least 1 month, better 4-5 months or longer
• 150d MA above 200d MA
• 50d MA above 150d MA and 200d MA
• Course above 50d MA, 150d MA and 200d MA
• Ideally, the 50d MA is increasing over at least 1 month
• Price at least 25% above the 52w low
• Price within 25% of 52w high
• High relative strength according to IBD.
NOTE: In this basic version of the script, the Trend-Template has to be used as a separate indicator on TradingView (Public Trend-Template indicators are available in TradingView – community scripts). It is recommended to only execute buy signals in case the stock or financial security is in a stage 2 uptrend, which means that the criteria of the trend-template are fulfilled.
This strategy can be applied to all timeframes from 5 min to daily.
The VWAP Momentum-Pullback Strategy
For the JS-TechTrading VWAP Momentum-Pullback Strategy, only stocks and other financial instruments that meet the selected criteria of Mark Minervini's trend template are recommended for algorithmic trading with this startegy.
A further prerequisite for generating a buy signals is that the individual value is in a short-term oversold state (RSI).
When the selling pressure is over and the continuation of the uptrend can be confirmed by the MA / VWAP crossover after reaching a price low, a buy signal is issued by this strategy.
Stop-loss limits and profit targets can be set variably. You also have the option to make use of the trailing stop exit strategy.
Relative Strength Index (RSI)
The Relative Strength Index (RSI) is a technical indicator developed by Welles Wilder in 1978. The RSI is used to perform a market value analysis and identify the strength of a trend as well as overbought and oversold conditions. The indicator is calculated on a scale from 0 to 100 and shows how much an asset has risen or fallen relative to its own price in recent periods.
The RSI is calculated as the ratio of average profits to average losses over a certain period of time. A high value of the RSI indicates an overbought situation, while a low value indicates an oversold situation. Typically, a value > 70 is considered an overbought threshold and a value < 30 is considered an oversold threshold. A value above 70 signals that a single value may be overvalued and a decrease in price is likely , while a value below 30 signals that a single value may be undervalued and an increase in price is likely.
For example, let's say you're watching a stock XYZ. After a prolonged falling movement, the RSI value of this stock has fallen to 26. This means that the stock is oversold and that it is time for a potential recovery. Therefore, a trader might decide to buy this stock in the hope that it will rise again soon.
The MA / VWAP Crossover Trading Strategy
This strategy combines two popular technical indicators: the Moving Average (MA) and the Volume Weighted Average Price (VWAP). The MA VWAP crossover strategy is used to identify potential trend reversals and entry/exit points in the market.
The VWAP is calculated by taking the average price of an asset for a given period, weighted by the volume traded at each price level. The MA, on the other hand, is calculated by taking the average price of an asset over a specified number of periods. When the MA crosses above the VWAP, it suggests that buying pressure is increasing, and it may be a good time to enter a long position. When the MA crosses below the VWAP, it suggests that selling pressure is increasing, and it may be a good time to exit a long position or enter a short position.
Traders typically use the MA VWAP crossover strategy in conjunction with other technical indicators and fundamental analysis to make more informed trading decisions. As with any trading strategy, it is important to carefully consider the risks and potential rewards before making any trades.
This strategy is applicable to all timeframes and the relevant parameters for the underlying indicators (RSI and MA/VWAP) can be adjusted and optimized as needed.
Backtesting
Backtesting gives outstanding results on all timeframes and drawdowns can be reduced to a minimum level. In this example, the hourly chart for MCFT has been used.
Settings for backtesting are:
- Period from Jan 2020 until March 2023
- Starting capital 100k USD
- Position size = 25% of equity
- 0.01% commission = USD 2.50.- per Trade
- Slippage = 2 ticks
Other comments
- This strategy has been designed to identify the most promising, highest probability entries and trades for each stock or other financial security.
- The combination of the Trend-Template and the RSI qualifiers results in a highly selective strategy which only considers the most promising swing-trading entries. As a result, you will normally only find a low number of trades for each stock or other financial security per year in case you apply this strategy for the daily charts. Shorter timeframes will result in a higher number of trades / year.
- Consequently, traders need to apply this strategy for a full watchlist rather than just one financial security.

RS - Relative Strength ScoreRelative strength (RS) is a measure of a stock's price performance relative to the overall market. It is calculated by dividing the stock's price change over a specified period by the market's price change over the same period. A stock with a high RS has outperformed the market, while a stock with a low RS has underperformed. (Stock can any asset that can be compared to a reference index like as Bitcoin, Altcoins etc ...)
Here are some advantages:
- Provides a measure of a stock's performance relative to a benchmark index or sector, allowing for a more accurate comparison of performance.
- Helps identify stocks with strong price momentum that are likely to continue outperforming the market in the short to medium term.
- Allows investors to identify the strongest performers within a particular sector or industry.
- Provides a quantitative and objective measure of a stock's performance, which can help reduce bias in investment decisions.
- Can be used in conjunction with other technical indicators and chart analysis to identify potentially profitable trades.
- Helps investors make more informed decisions by providing a more comprehensive picture of a stock's performance.
How to use it:
- The indicator can be used in daily and weekly timeframes.
- Check, if the default reference index is suited for your asset (Settings) The default is the combination of S&P500+Nasdaq+Dow Jones. For Crypto, it could be TOTAL (ticker for total stock market), for German stocks it could be DAX.
- Decide (settings), if you want to see the RS based on annual calculation (IBD style) or based only for the last quarter
Color coding:
- Red: Stock is performing worse than index (RS < 0)
- Yellow: Stock get momentum, starting to perform better than index (RS > 0)
- Green: Stock is outperforming the index
- Blue: Stock is a shooting star compared to index
- When RS turns positive and stays there, it could be an indication for an outbreak (maybe into a stage 2)
No financial advise. For education purposes only.
[JL] Control Your Emotions ReminderThe " Control Your Emotions Reminder" script is a valuable tool for traders, helping them to monitor and manage their emotions during trading. By showcasing a list of typical emotions on the chart, this script aims to increase awareness of the emotional traps that can adversely affect trading outcomes. Traders can utilize this reminder to stay focused and maintain discipline while making trading decisions.
Features:
Presents a checklist of 10 prevalent emotions that traders should address, including fear, greed, anxiety, frustration, overconfidence, euphoria, regret, envy, impatience, and boredom.
Enables users to customize the notification, label position, color, and distance from the current bar.
Designed to enhance trading performance by fostering emotional awareness and discipline.
While trading, it is crucial to manage your emotions to make well-informed and rational decisions. The following emotions are important to control during trading:
Fear: Fear may lead to premature trade exits or prevent entry into potentially profitable trades.
Greed: Greed can result in overtrading, holding positions for too long, or taking excessive risks.
Anxiety: Anxiety can cause impulsive decision-making, impacting your ability to analyze and execute trades effectively.
Frustration: Frustration may result in revenge trading or making impulsive decisions to recover losses rapidly.
Overconfidence: Overconfidence can lead to excessive risk-taking or failure to follow your trading plan.
Euphoria: Euphoria may cause you to overlook risks, resulting in potential losses when market conditions shift.
Regret: Regret can prompt emotional decision-making, such as pursuing missed opportunities or clinging to losing positions.
Envy: Envy may encourage you to mimic other traders without conducting your own analysis, leading to potentially unsound decisions.
Impatience: Impatience can result in hasty decision-making, entering trades too early, or exiting prematurely.
Boredom: Boredom can cause overtrading, entering trades without adequate analysis, or disregarding your trading plan.
Feel free to modify the text as needed.
How to use:
Add the script to your chart.
Adjust the label position, color, and distance from the current bar as desired.
Use the displayed checklist as a reminder to manage your emotions during trading.
By utilizing the " Control Your Emotions Reminder" script, traders can enhance their trading performance by becoming more aware of their emotions and maintaining discipline in their decision-making process. This can contribute to improved risk management, adherence to trading plans, and more informed trading decisions overall.

JS-TechTrading: VWAP Momentum_Pullback StrategyGeneral Description and Unique Features of this Script
Introducing the VWAP Momentum-Pullback Strategy (long-only) that offers several unique features:
1. Our script/strategy utilizes Mark Minervini's Trend-Template as a qualifier for identifying stocks and other financial securities in confirmed uptrends.
NOTE: In this basic version of the script, the Trend-Template has to be used as a separate indicator on TradingView (Public Trend-Template indicators are available on TradingView – community scripts). It is recommended to only execute buy signals in case the stock or financial security is in a stage 2 uptrend, which means that the criteria of the trend-template are fulfilled.
2. Our strategy is based on the supply/demand balance in the market, making it timeless and effective across all timeframes. Whether you are day trading using 1- or 5-min charts or swing-trading using daily charts, this strategy can be applied and works very well.
3. We have also integrated technical indicators such as the RSI and the MA / VWAP crossover into this strategy to identify low-risk pullback entries in the context of confirmed uptrends. By doing so, the risk profile of this strategy and drawdowns are being reduced to an absolute minimum.
Minervini’s Trend-Template and the ‘Stage-Analysis’ of the Markets
This strategy is a so-called 'long-only' strategy. This means that we only take long positions, short positions are not considered.
The best market environment for such strategies are periods of stable upward trends in the so-called stage 2 - uptrend.
In stable upward trends, we increase our market exposure and risk.
In sideways markets and downward trends or bear markets, we reduce our exposure very quickly or go 100% to cash and wait for the markets to recover and improve. This allows us to avoid major losses and drawdowns.
This simple rule gives us a significant advantage over most undisciplined traders and amateurs!
'The Trend is your Friend'. This is a very old but true quote.
What's behind it???
• 98% of stocks made their biggest gains in a Phase 2 upward trend.
• If a stock is in a stable uptrend, this is evidence that larger institutions are buying the stock sustainably.
• By focusing on stocks that are in a stable uptrend, the chances of profit are significantly increased.
• In a stable uptrend, investors know exactly what to expect from further price developments. This makes it possible to locate low-risk entry points.
The goal is not to buy at the lowest price – the goal is to buy at the right price!
Each stock goes through the same maturity cycle – it starts at stage 1 and ends at stage 4
Stage 1 – Neglect Phase – Consolidation
Stage 2 – Progressive Phase – Accumulation
Stage 3 – Topping Phase – Distribution
Stage 4 – Downtrend – Capitulation
This strategy focuses on identifying stocks in confirmed stage 2 uptrends. This in itself gives us an advantage over long-term investors and less professional traders.
By focusing on stocks in a stage 2 uptrend, we avoid losses in downtrends (stage 4) or less profitable consolidation phases (stages 1 and 3). We are fully invested and put our money to work for us, and we are fully invested when stocks are in their stage 2 uptrends.
But how can we use technical chart analysis to find stocks that are in a stable stage 2 uptrend?
Mark Minervini has developed the so-called 'trend template' for this purpose. This is an essential part of our JS-TechTrading pullback strategy. For our watchlists, only those individual values that meet the tough requirements of Minervini's trend template are eligible.
The Trend Template
• 200d MA increasing over a period of at least 1 month, better 4-5 months or longer
• 150d MA above 200d MA
• 50d MA above 150d MA and 200d MA
• Course above 50d MA, 150d MA and 200d MA
• Ideally, the 50d MA is increasing over at least 1 month
• Price at least 25% above the 52w low
• Price within 25% of 52w high
• High relative strength according to IBD.
NOTE: In this basic version of the script, the Trend-Template has to be used as a separate indicator on TradingView (Public Trend-Template indicators are available in TradingView – community scripts). It is recommended to only execute buy signals in case the stock or financial security is in a stage 2 uptrend, which means that the criteria of the trend-template are fulfilled.
This strategy can be applied to all timeframes from 5 min to daily.
The VWAP Momentum-Pullback Strateg y
For the JS-TechTrading VWAP Momentum-Pullback Strategy, only stocks and other financial instruments that meet the selected criteria of Mark Minervini's trend template are recommended for algorithmic trading with this startegy.
A further prerequisite for generating a buy signals is that the individual value is in a short-term oversold state (RSI).
When the selling pressure is over and the continuation of the uptrend can be confirmed by the MA / VWAP crossover after reaching a price low, a buy signal is issued by this strategy.
Stop-loss limits and profit targets can be set variably.
Relative Strength Index (RSI)
The Relative Strength Index (RSI) is a technical indicator developed by Welles Wilder in 1978. The RSI is used to perform a market value analysis and identify the strength of a trend as well as overbought and oversold conditions. The indicator is calculated on a scale from 0 to 100 and shows how much an asset has risen or fallen relative to its own price in recent periods.
The RSI is calculated as the ratio of average profits to average losses over a certain period of time. A high value of the RSI indicates an overbought situation, while a low value indicates an oversold situation. Typically, a value > 70 is considered an overbought threshold and a value < 30 is considered an oversold threshold. A value above 70 signals that a single value may be overvalued and a decrease in price is likely , while a value below 30 signals that a single value may be undervalued and an increase in price is likely.
For example, let's say you're watching a stock XYZ. After a prolonged falling movement, the RSI value of this stock has fallen to 26. This means that the stock is oversold and that it is time for a potential recovery. Therefore, a trader might decide to buy this stock in the hope that it will rise again soon.
The MA / VWAP Crossover Trading Strategy
This strategy combines two popular technical indicators: the Moving Average (MA) and the Volume Weighted Average Price (VWAP). The MA VWAP crossover strategy is used to identify potential trend reversals and entry/exit points in the market.
The VWAP is calculated by taking the average price of an asset for a given period, weighted by the volume traded at each price level. The MA, on the other hand, is calculated by taking the average price of an asset over a specified number of periods. When the MA crosses above the VWAP, it suggests that buying pressure is increasing, and it may be a good time to enter a long position. When the MA crosses below the VWAP, it suggests that selling pressure is increasing, and it may be a good time to exit a long position or enter a short position.
Traders typically use the MA VWAP crossover strategy in conjunction with other technical indicators and fundamental analysis to make more informed trading decisions. As with any trading strategy, it is important to carefully consider the risks and potential rewards before making any trades.
This strategy is applicable to all timeframes and the relevant parameters for the underlying indicators (RSI and MA/VWAP) can be adjusted and optimized as needed.
Backtesting
Backtesting gives outstanding results on all timeframes and drawdowns can be reduced to a minimum level. In this example, the hourly chart for MCFT has been used.
Settings for backtesting are:
- Period from April 2020 until April 2021 (1 yr)
- Starting capital 100k USD
- Position size = 25% of equity
- 0.01% commission = USD 2.50.- per Trade
- Slippage = 2 ticks
Other comments
• This strategy has been designed to identify the most promising, highest probability entries and trades for each stock or other financial security.
• The RSI qualifier is highly selective and filters out the most promising swing-trading entries. As a result, you will normally only find a low number of trades for each stock or other financial security per year in case you apply this strategy for the daily charts. Shorter timeframes will result in a higher number of trades / year.
• As a result, traders need to apply this strategy for a full watchlist rather than just one financial security.

Soheil PKO's 5 min Hitman Scalp - 3MA + Laguerre RSI + ADX [Pt]Someone sent me this strategy found on YouTube. It is Soheil PKO's "The Best and Most Profitable Scalping Strategy" Best way to find out is to code it =)
This strategy uses Moving Average Ribbon, Laguerre RSI, and ADX. This script only displays the MA ribbon, you will need to add Laguerre RSI and ADX separately.
Long Entry Criteria:
- 16 EMA > 48 EMA > 200 SMA
- Laguerre RSI > 80
- ADX > 20
Long Exit Criterion:
- 16 EMA < 48 EMA
Short Entry Criteria:
- 16 EMA < 48 EMA < 200 SMA
- Laguerre RSI < 20
- ADX > 20
Short Exit Criterion:
- 16 EMA > 48 EMA
As mentioned in the video, risk management is very important, especially for scalping strategies. Therefore, I've added option for setting Stop Loss and Price Target in the options for you guys to play with.
All parameters are configurable.
Enjoy~~

Multiple Standard MomentumMultiple Standard Momentum
The momentum indicator is a technical indicator that measures the speed and strength of the price movement of a financial asset. This indicator is used to identify the underlying strength of a trend and predict potential changes in price direction.
The calculation of the momentum indicator is based on the difference between the current price and the price of a previous period. The result is displayed on a chart, which can be positive or negative, depending on whether the current price is higher or lower than the price of the previous period. The indicator can be used on any time frame, but is generally used on short-term charts.
To use the momentum indicator , you look for two types of signals:
🔹 Crossover Signal – When the indicator crosses the zero line, it can signal a change of direction in the price trend.
🔹 Divergence – When the asset price moves in one direction and the indicator moves in the opposite direction, a divergence can be identified. This divergence may indicate a possible trend reversal.
COMPOSITION AND MODE OF USE OF THE INDICATOR
🔹 This indicator displays multiple Momentum levels on a single chart, allowing you to view multiple Momentum lines. Each level is represented on the chart where it can be hidden or shown as desired for better market analysis.
🔹 In addition, a zero trend line (also known as a horizontal trend line) has been added. The zero trend line is a horizontal line that indicates the point at which the current price equals the opening price, which allows users to draw a custom zero trend line on the chart using different colors and time periods of calculation.
* Highest performing custom setup for the Zero Trend Line. For Operations of:
- One Minute: Trend Line Time Frame = Five Minutes.
- Three Minutes: Trend Line Time Frame = Fifteen Minutes.
- Five Minutes: Trend Line Time Frame = Thirty Minutes.
- Fifteen Minutes: Trend Line Time Frame = Sixty Minutes.
Rules For Trading
🔹 Bullish:
* The Zero Trend Line must be in Green Color.
* When the Momentum Line Crosses the Zero Line from Bottom to Top.
🔹 Bearish:
* The Zero Trend Line must be in Red Color.
* When the Momentum Line Crosses the Zero Line from Top to Bottom.
In addition, parameters were defined to activate or deactivate the graphic signal taking into account the previous requirement (Bullish and Bearish):
🔹 Long or Buy = ▲
🔹 Short or Sell = ▼
This script can be used in different markets such as forex, indices, and cryptocurrencies for analysis and trading. However, it is important to note that no trading strategy is guaranteed to be profitable, and traders should always conduct their own research and risk management.