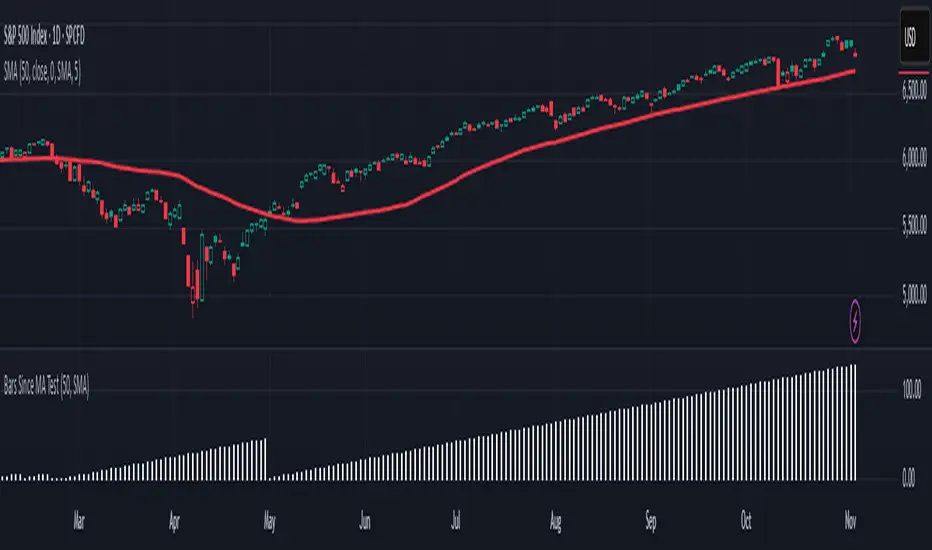
Is it Time for a Pullback? Check Bars Since MA TestAn old market adage declares that “prices never move in a straight line.” Dips occur even in bullish markets. But how can traders know when prices may be due for a pullback?
Today’s script tries to answer that question by asking how many bars have passed since a stock, index or other symbol has tested a given moving average. Long periods of time without touching a line such as the 50-day simple moving average, for example, could prompt traders to be more patient.
Bars Since MA Test counts how many bars have passed since prices touched or crossed the MA in question. The resulting value is plotted in a simple histogram. Users can set the MA length and type. By default, it uses the 50-day simple moving average (SMA).
The chart above applies Bars Since MA Test to the S&P 500. It shows that the index has gone 129 bars without testing its 50-day SMA. That’s the longest since a 146-bar stretch between July 2006 and February 2007.
Other longer runs include January-August 1995 (156 bars), November 1960-June 1961 (144 bars) and April-November 1958 (158 bars).
Given the small number of comparable readings, could traders suspect the current advance is getting long in the tooth?
TradeStation has, for decades, advanced the trading industry, providing access to stocks, options and futures. If you're born to trade, we could be for you. See our Overview for more.
Past performance, whether actual or indicated by historical tests of strategies, is no guarantee of future performance or success. There is a possibility that you may sustain a loss equal to or greater than your entire investment regardless of which asset class you trade (equities, options or futures); therefore, you should not invest or risk money that you cannot afford to lose. Online trading is not suitable for all investors. View the document titled Characteristics and Risks of Standardized Options at www.TradeStation.com . Before trading any asset class, customers must read the relevant risk disclosure statements on www.TradeStation.com . System access and trade placement and execution may be delayed or fail due to market volatility and volume, quote delays, system and software errors, Internet traffic, outages and other factors.
Securities and futures trading is offered to self-directed customers by TradeStation Securities, Inc., a broker-dealer registered with the Securities and Exchange Commission and a futures commission merchant licensed with the Commodity Futures Trading Commission). TradeStation Securities is a member of the Financial Industry Regulatory Authority, the National Futures Association, and a number of exchanges.
TradeStation Securities, Inc. and TradeStation Technologies, Inc. are each wholly owned subsidiaries of TradeStation Group, Inc., both operating, and providing products and services, under the TradeStation brand and trademark. When applying for, or purchasing, accounts, subscriptions, products and services, it is important that you know which company you will be dealing with. Visit www.TradeStation.com for further important information explaining what this means.
Cerca negli script per "pullback"
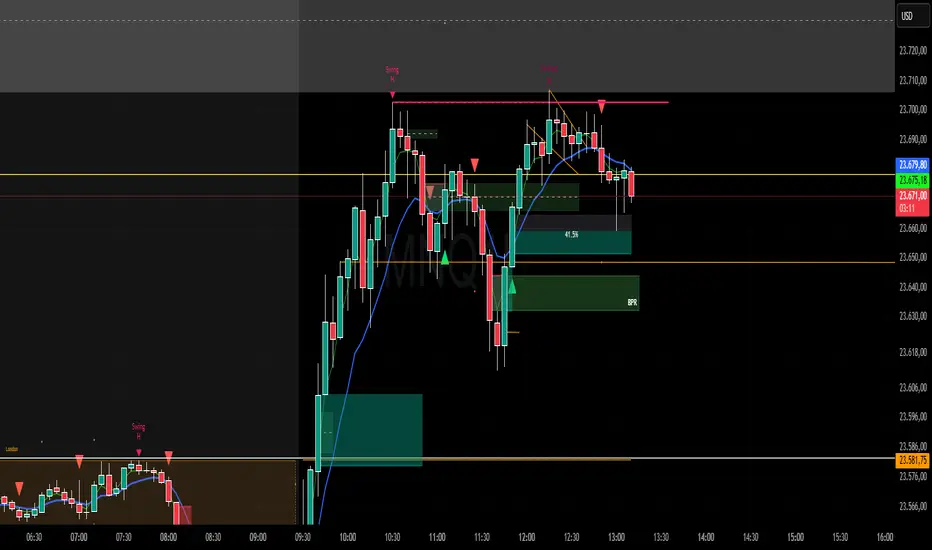
Sweep + Estructura + Pullback (Long & Short)Sweep + Estructura + Pullback (Long & Short)
EFECTIVO EN 5 MIN
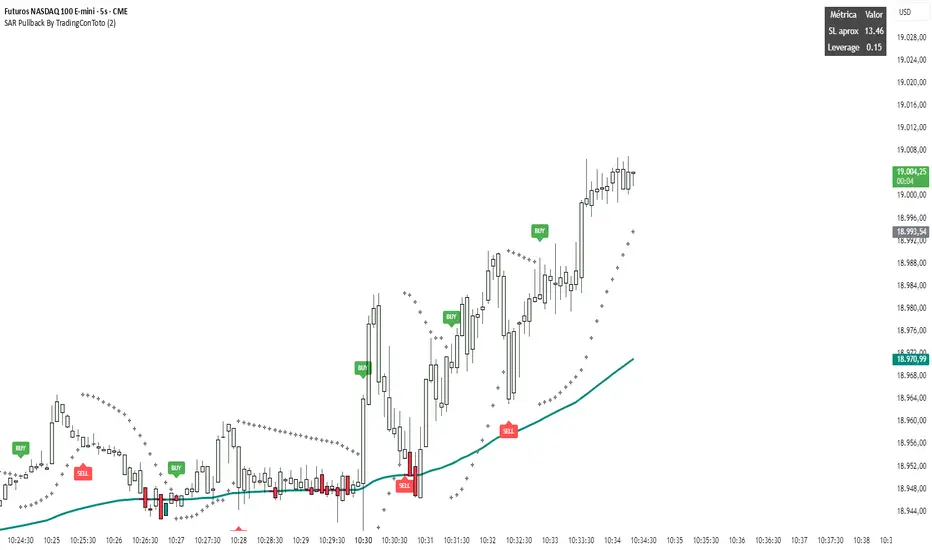
SAR Pullback By TradingConTotoName & Version
SAR Pullback UX Improved (Pine Script v5)
Core Logic
Calculates two EMAs (fast and slow) to identify overall trend direction.
Uses the Parabolic SAR to detect “flip” points (when SAR crosses price), marking micro-trend reversals.
Micro-Trend Extremes
Tracks the highest high after a bullish flip (SAR below price) and the lowest low after a bearish flip (SAR above price).
These extremes feed into the stop-loss approximation.
Approximate Stop-Loss (“SL aprox”)
If SAR is below price (bullish), SL ≔ (micro-trend high − current SAR).
If SAR is above price (bearish), SL ≔ (current SAR − micro-trend low).
Leverage Calculation
User-defined “UR in USD” input.
Computes leverage as UR ÷ SL, giving you an estimate of position sizing potential.
On-Chart Signals
BUY label at each bullish flip, with SL and leverage printed.
SELL label at each bearish flip, likewise showing SL and leverage.
Customizable UI
Inputs to toggle display of SL, leverage, or both.
Choose your UR value, panel background/text colors, and BUY/SELL label colors.
Panel position fixed at top-right by default, showing a 2×3 table:
Header row (“Metric” / “Value”)
“SL aprox” row
“Leverage” row
Visuals
Plots the slow EMA colored by trend.
Draws SAR as crosses.
Bar colors shade green/red according to bullish/bearish conditions.
Semi-transparent, styled panel for quick glance of key metrics.
This indicator combines trend filtering, automated stop-loss sizing, and leverage guidance into a single, fully-configurable Pine Script tool—giving you clear on-chart signals plus a neat metrics panel for streamlined decision-making.
Supply and Demand Daily [LuxAlgo]The Supply and Demand Daily indicator displays daily supply and demand areas on the user's chart. These areas are constructed using the market data within a previous daily interval.
This script makes use of the same logic as our previous Supply and Demand Visible Range indicator .
🔶 USAGE
The supply/demand areas & levels displayed by the indicator aim to provide potential support/resistance levels for users. Supply areas highlight where buyers are willing to exit the market and sell the asset, thus providing resistance and potentially causing prices to reverse or bounce back downwards, while demand areas highlights where buyers were willing to purchase the asset, thus providing support and potentially causing prices to reverse or bounce back upwards.
Historical areas allow the user to study the evolution of supply/demand from one day to another. Wider areas highlight prices avoiding reverting to this area, while thinner areas highlight prices returning more frequently to them.
Trends can be determined by looking at the price position relative to the previous day's supply/demand areas. Price breaking down from the demand zone is indicative of a downtrend, while price breaking above the supply zone is indicative of an uptrend.
Pullback/throwback scenarios can also be common using this indicator.
🔶 SETTINGS
Threshold %: Percentage of the total visible range volume used as a threshold to set supply/demand areas. Higher values return wider areas.
Resolution: Determines the number of bins used to find each area. Higher values will return more precise results.
Intra-bar TF: Timeframe used to obtain intra-bar data.
🔶 RELATED SCRIPTS

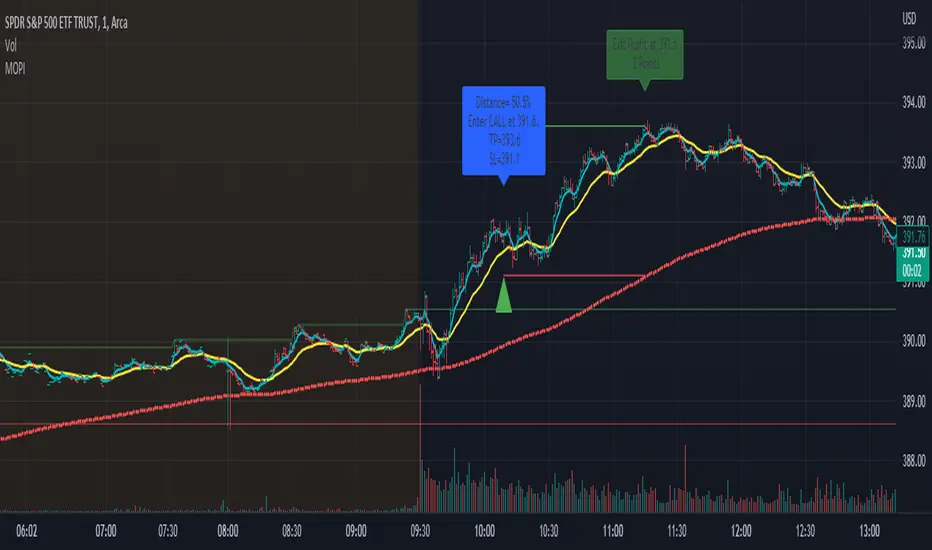
Morning Option Pullback IndicatorI designed this indicator to help me identify Option CALL and PUT signals for the QQQ and SPY on the 1 min chart.
Summary of how it works
1. It identifies the Pre-Market channel High and Low and draws green and red lines for the day at these levels.
2. Waits for a morning or afternoon sessions breakout/breakdown of price out of that channel.
3. The buy a CALL or PUT signal is when price pulls back to the EMA Medium line after breaking out of the channel.
4. Settings allow adjusting of when the signal happens
5. EMA Short (5) and EMA Medium (20) must stay apart for a selectable number of bars
6. For a CALL signal, the Price and EMA Medium (20) must be above the Pre Market High line when price pulls back to EMA Medium (20) line
7. There is a selectable adjustment to allow the signal to trigger when the price comes within a close enough range of the EMA Medium and PM High lines
8. There is a TICK.US filter that you can use to only signal a CALL when the TICK.US 10 min chart shows the average of the EMA5 and EMA20 is over 100
9. It has Buy and Sell signal Alerts and user adjustable Stop Loss and Profit Taker settings.
10. EMA Settings are adjustable and can show up to 3 EMA's on the chart. I personally like the EMA5 and 20. Others may use something similar like 9 and 21. It's user selectable.
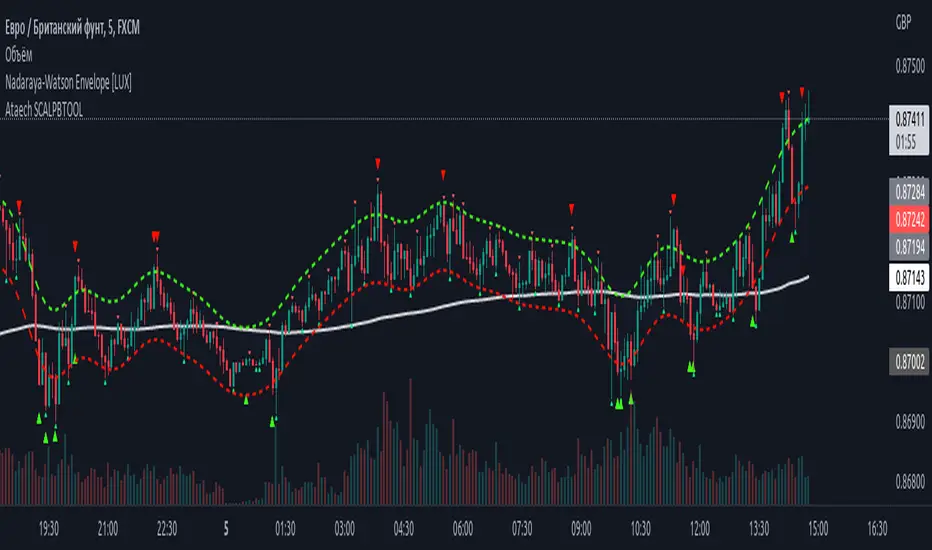
100400 Scalping PullBack Tool R1.1100400 Scalping PullBack Tool R1.1
The following tool smooths the price data using the Nadaraya-Watson estimator, a simple Kernel regression method. We make use of the Gaussian kernel as a weighting function.
2 Ema Pullback StrategyHi everyone!
CAUTION... This is only an indicator. Do not rely 100% on it.
I made this indicator hoping to help everyone with this specific Pull Back Scalping Strategy.
RULES:
Time Chart of 5minuts
LONG Condition - "EMA Red Line" below the "EMA Blue Line" and wait for a green long signal.
SHORT Condition - "EMA Red Line" below the "EMA Blue Line" and wait for a red short signal
Feel free to add any adjustments or give feedback so we can improve.
The strategy idea and guidelines came from "The Master" Juan Luis.
Autor: © Germangroa

2 EMA PullbackHi everyone!
CAUTION... This is only an indicator. Do not rely 100% on it.
I made this indicator hoping to help everyone with this specific Pull Back Scalping Strategy.
RULES:
Time Chart of 5minuts
Long Condition - "EMA Red Line" below the "EMA Blue Line" and wait for a green long signal.
Short Condition - "EMA Red Line" below the "EMA Blue Line" and wait for a red short signal
Feel free to add any adjustments or give feedback so we can improve.
The strategy idea and guidelines came from the "Master Juan Luis"
Autor: © Germangroa
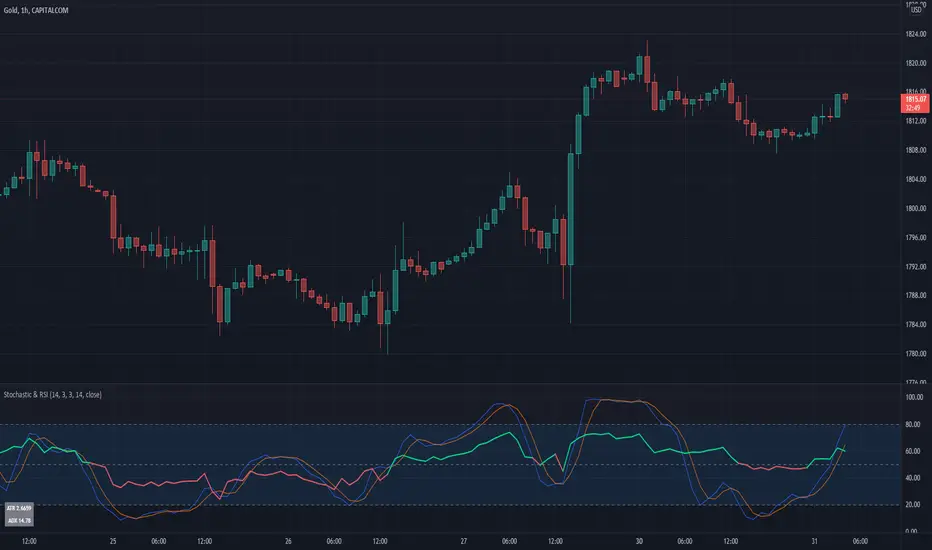
Stochastic & RSIThis script is a simple extension of the Built-In Stochastic RSI that also plots the RSI and prints the values of ATR and ADX of the last bar of the current timeframe to a small table in the corner.
The script can be used to define the entry for a trade when the stochastics crossed and RSI is below or above 0.50 (for going long or short).
OANDA:BTCUSD
I like to use the Stochastics and RSI indicators for pullback strategies, and with this inidcator you dont have to add both indicators to your setup. The ATR can be used to define the value of your stop-loss and the ADX (e.g. > 25) give you a hint for the strength of the current trend.
Entry master RSI pullbackSimply using a single RSI and placing a signal after it crosses the 50 level after being overbought or oversold in the same direction.

Excellent ADXThe Average Directional movement indeX (ADX) is an indicator that helps you determine the trend direction, pivot points, and much more else! But it looks not so easy as other famous indicators. It seems strange or even terrible, but don't be afraid. Let's understand how it works and get its power into your analysis tactics.
In the beginning, imagine a drunk man goes through a ladder: step by step. Up, up, down, up, down, down, up...
How can we understand which direction he goes? Exactly! We can count the number of steps in each direction. In the above example, in the upward – 4, in the downward – 3. So, it looks like he goes in an upward direction.
The ADX indicator counts the same steps, but for price. The size of each step equals 1 ATR for "DI Length" candles. On the indicator chart, we have the green and red lines. The green line represents a number of steps upward. The red line shows one downward. When the red line upper green, then the price goes below, then the trend is directed down. Later the green line comes above the red one, and then the trend changes the direction to upward. Wow? After that, you can easy detect the trend direction on the market!
But it is still not the end. On the chart, we also have the fat blue line. This is the ADX line, and it represents the power of the trend. It is calculated from a distance between the green and red curves. The ADX line value grows if the distance is increased. If the movement is really powerful, then a number of steps into a direction much more prominent than one in an opposed direction. Then the blue line grows faster. But if the growth has stopped and the blue line turns back or already had changed self-direction, then it is a signal that the trend has ended too. It's an excellent sign to close the position (but not always). Easy? Not quite. Thresholds help you there. The indicator has two additional parameters: upper and lower thresholds to evaluate the trend-over signal strength. An u-turn of the ADX line above the upper threshold sends a strong signal. If one occurs between both thresholds, it is a bit weak signal. But if the blue line goes below the lower threshold, it looks like there is no trend, and the price goes side. We can also say that the price goes side when the ADX value gradually falls down.
The Excellent ADX indicator helps you catch pivot/pullback signals based on green, red, and blue lines. Each such signal is highlighted as a green (buy) or red (sell) dot on the plot. The size of the dot represents the strength of the signal. You can also check the position of green and red lines from each other to determine the trend direction and the place where it has been changed. The Excellent ADX indicator helps you there too. It highlights the trend direction by the background-color, so you'll never miss it! The Excellent ADX good compliance with the Price Channel indicator built for the same length. You can use them together to be on a trend wave always!

EMA Pullback StudyA colored EMA (period can be chosen via inputs).
A signal is generated on the first price touch of the EMA following the price floating above or below it for several bars.
- If EMA is green and a green up arrow appears (price touch), look for buys.
- If EMA is red and a red down arrow appears look for sells.
Can be used with a longer period MA to confirm overall direction, MTF, chop zone, etc.
May wish to enter on the signal, or wait for price to turn back in direction of the trend.
Still in development!

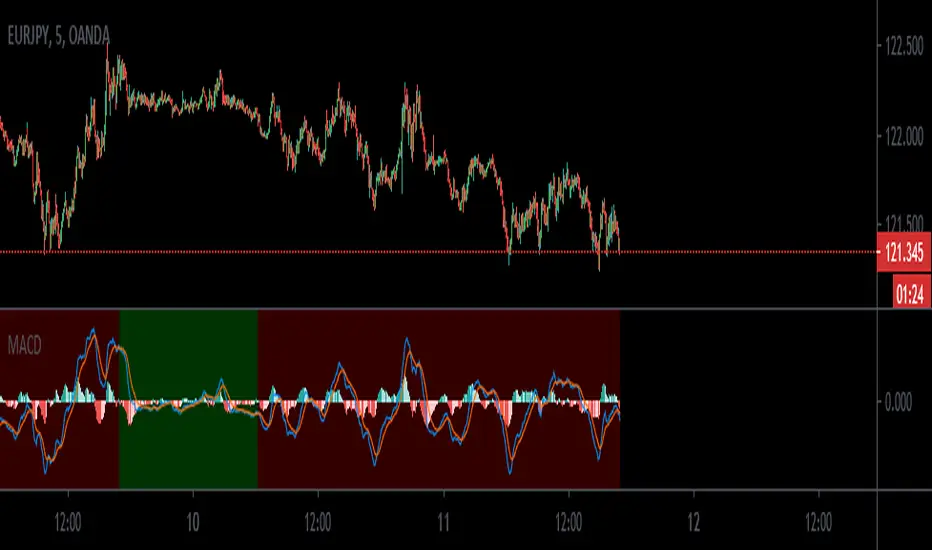
MACD_trendtraderThis is my modified macd indicator. It uses moving averages to determine the trend of the market. It is best used on lower time frames such as 5min and 15min. I found it useful especially with Forex pairs and also traditional markets.
This indicator will help you get in at a pullback in a trending market.
RED background tells you the trend is down. A possible entry happens when you get a sell signal from the macd oscillator above the 0 line.
GREEN background tells you the trend is up. A possible entry happens when you get a buy signal from the macd oscillator below the 0 line.
a couple of examples:
Leave your feedback in the comments. Enjoy:)
Mean Deviation IndexThe Mean Deviation Index (MDX) is used to see how much price is deviating from the mean. This indicator takes both volatility and mean deviation in consideration.
It uses the standard deviation of the ATR to filter an EMA, and uses this as the mean. It then only plots > or < 0 if price is more than one x ATR away from the mean. If index is positive, the background turns green, meaning price is more than 1 x ATR above the mean. If the index is negative, the background turns red, meaning price is more than 1 x ATR below the mean. This setting can be changed by changing the setting "ATR Multiplier", but the default is 1 x ATR.
There are two main ways to use this index.
1. Use it aggressively to find trends (by combining it with other indicators) by entereding each time the background changes color to green for longs or red for shorts.
2. Use it spot breakouts, waiting for a pullback, and then entering on the next move in the same direction. In this context for a short, you wait for the background color to turn green, then wait for the index to pull back, and then enter once it starts moving up again.

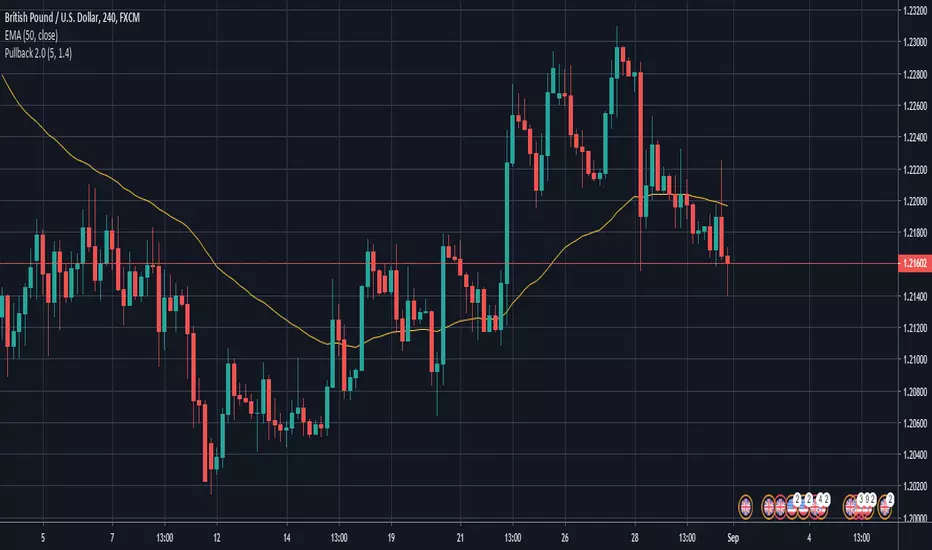
The Trading Channel (EAP Course) - Pullback Indicator 1.0I've recently subscribed to TTC's EAP course and created this script to help me.
This is a script to assist with backtesting the strategy outlined in the course. It follows the 5 basic rules of entry.
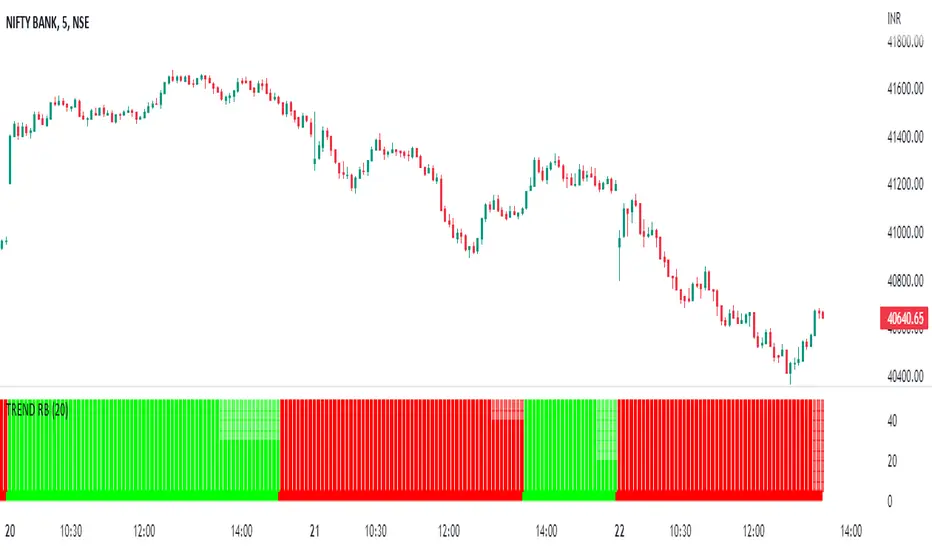
TREND RBReduce Fake Signals, and identify the trend and use as double confirmation
How Does it work ?
- it calculates main trend direction by using the length that is user-defined. so you can change it as you wish
- then it calculates trend direction for each 9 lower lengths. if you set the length = 20 then the lengths are 19, 18,...11
- and it checks if the trend directions that came from lower lengths is same or not with main trend direction.
- it changes the trend color of the ribbon.
Pullback StrategyBTCUSD -- 5 min
BUY POSITION
1 : Fast ema is above medium ema and medium ema is above slow ema
2 : The price drops below the fast ema but not the slow ema
3 : The price rises above the fast ema
SELL POSITION
1 : Fast ema is below medium ema and medium ema is below slow ema
2 : the Price rises above fast ema but not slow ema
3 : The price drops back below the fast ema

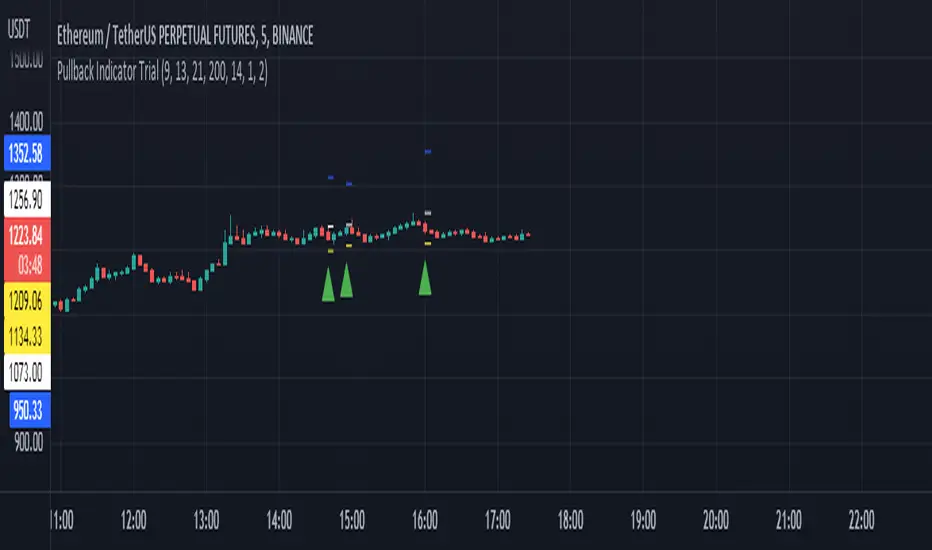
Pullback Indicator Trial- Credits to ZenAndTheArtOfTrading
- Contains 3 EMA's: 8, 13, 21
- Plots Entry Price, Stop Price, and Target Price (Recommend using Stop Market or Stop Limit Orders)
- If Buy Entry Price is not hit and a new Buy signal appears, you can create multiple orders or ignore the new one or cancel the previous and take the new signal. As for Sell signals, do the opposite.
- If Buy Entry Price is not hit and a Sell signal appears, decide to take trade at your own discretion and vice versa(sell side).
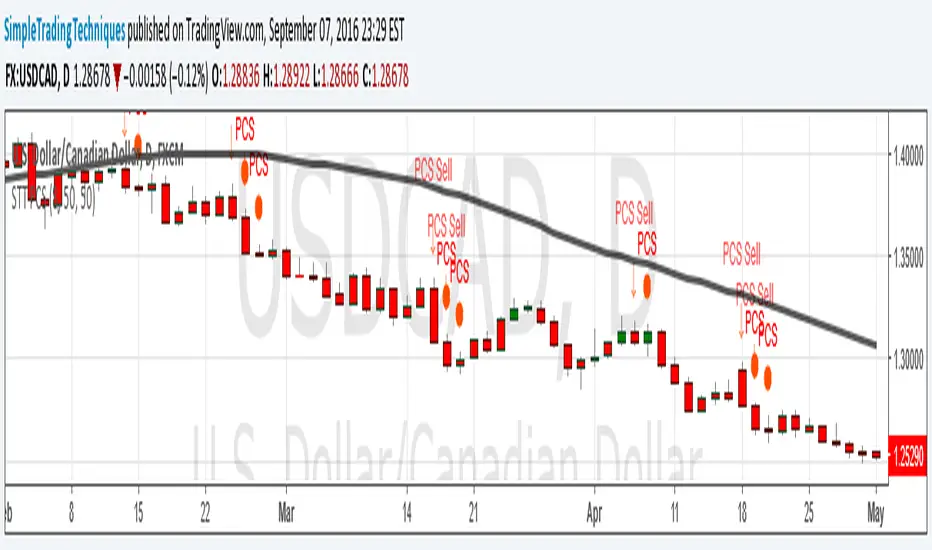
PULLBACK CANDLESTICK STRATEGY BY SIMPLE TRADING TECHNIQUESArrow represent trade setup
Circle represent triggering of the trade
--------------------------------------------------------------------
1. Where to place stop loss?
2. Where to exit the trade?
3. How to protect gains in your trade?
4. How to apply money management rule?
5. How to trade gap opening?
Strategy_GOLD TERTIUMThis indicator is a visual tool for TradingView designed to help you read trend structure using EMAs and highlight potential long and short entries on the MGC 1‑minute chart, while filtering pullbacks and avoiding trades when the 200 EMA is flat.
It calculates five EMAs (32, 50, 110, 200, 250) and plots them in different colors so you can clearly see the moving‑average stack and overall direction. The main trend is defined by the 200 EMA: bullish when price and the fast EMAs (32 and 50) are above it with a positive slope, and bearish when they are below it with a negative slope; if the 200 EMA is almost flat, signals are blocked to reduce trading in choppy markets.
Entry logic looks for a pullback into the 32–50 EMA zone on the previous candle, then requires a trend‑aligned candle to trigger a signal: long when the trend is up, the previous bar retested the EMA zone, and the current bar closes above EMA 32 with a bullish body; short when the trend is down, there was a valid retest, the current bar closes below EMA 32 with a bearish body and EMA 32 is below EMA 50. On the chart, you will see colored EMAs plus green “L” triangles under bars for potential long entries and red “S” triangles above bars for potential short entries, which are meant as visual cues rather than automatic trade instructions
anteayer
Notas de prensa
This indicator is a visual tool for TradingView that helps you trade trend pullbacks on the MGC 1‑minute chart using a stack of EMAs and strict entry filters.
It plots five EMAs (32, 50, 110, 200, 250) in different colors so you can easily see short‑, medium‑, and long‑term direction on the chart. The main trend is defined by the 200 EMA: bullish when price, EMA 32, and EMA 50 are all above the 200 EMA with a positive slope, and bearish when they are below it with a negative slope; if the 200 EMA is almost flat, signals are blocked to avoid trading in ranging conditions.
For entries, the indicator looks for a pullback to the EMA 32–50 zone on the previous candle and then requires a trend‑aligned candle to fire a signal. Long signals only appear if the overall trend is up, the previous bar retested the EMA 32–50 zone, EMA 32 is above EMA 50, the distance between those two EMAs is at least 10 pips, and the current candle closes above EMA 32 with a bullish body. Short signals only appear if the trend is down, there was a valid retest, EMA 32 is below EMA 50 with at least 10 pips separation, and the current candle closes below EMA 32 with a bearish body.
On the chart, you see the colored EMAs plus green “L” triangles under bars for potential long entries and red “S” triangles above bars for potential short entries. These markers are meant as visual cues to highlight spots where your rules are met, not as automatic trade execution, so they are normally combined with your own session, structure, and risk management criteria.

EMA Exhaustion + ContinuationA fast, mechanical scalping system that detects EMA exhaustion, filters with RSI, and manages exits plus continuations.
This indicator is designed for ultra‑short timeframe scalping, where speed and clarity matter more than anything else. It combines three core elements into one mechanical workflow:
- EMA Spread Exhaustion
The system measures the distance between fast and slow EMAs relative to ATR. When the spread reaches extreme levels and then begins to contract, it signals exhaustion — the point where momentum is likely to stall or reverse. This gives traders a structural way to identify setups without relying on subjective “feel.”
- RSI Filter (Accelerated for Scalping)
A shortened RSI (default length 7) is normalized by ATR to match the tempo of 15‑second scalps. This filter ensures that entries only trigger when momentum aligns with the exhaustion signal, reducing false positives and keeping trades in sync with volatility.
- Entry, Exit, and Continuation Logic
- Entries:
- Long entry triggers when spread retreats, EMA‑3 crosses price, and RSI confirms bearish exhaustion (RSI < 0).
- Short entry triggers under the opposite conditions (spread retreat, EMA‑3 cross, RSI > 0).
- Icons: Blue arrow up for longs, Red arrow down for shorts.
- Exits:
- Long exits occur when price closes below the 7 EMA smoothed by SMA‑2 while all EMAs are still sloping upward.
- Icon: Yellow cross above the candle.
- Continuations:
- Long continuation triggers when price dips below EMA‑9 and then reclaims above it.
- Short continuation triggers when price closes above EMA‑9 and then reclaims below it.
- Icons: Green triangle up for long continuation, Purple triangle down for short continuation.
----------------------------------------------------------------------------------------
- Apply the indicator to your chart. I use 15 second chart
- Watch for blue/red arrows — these are your primary entry signals.
- Respect yellow crosses — they mark mechanical exit points.
- Use green/purple triangles to re‑engage continuation trades after shallow pullbacks. I only take the first continuation signal above/below the 20 EMA.
- Keep the RSI filter active to avoid chasing false setups.
- Combine with your risk management rules (position sizing, stop placement) for full system integrity.

Sizing GuideThis indicator helps you defining your max sizing, depending on the max $$$ amount you're willing to risk against a specific exponential moving average (or VWAP, default is the 13ema).
You can define your max risk amount and your max allowed sizing. The indicator would suggest the best sizing in order to risk only up to the amount you are comfortable with on a potential trade.
Moreover, the column bar would turn yellow/red if the divergence is above a certain threshold (default are yellow > 1.50% and red > 2.75%, green otherwise).

Linear Trajectory & Volume StructureThe Linear Trajectory & Volume Structure indicator is a comprehensive trend-following system designed to identify market direction, volatility-adjusted channels, and high-probability entry points. Unlike standard Moving Averages, this tool utilizes Linear Regression logic to calculate the "best fit" trajectory of price, encased within volatility bands (ATR) to filter out market noise.
It integrates three core analytical components into a single interface:
Trend Engine: A Linear Regression Curve to determine the mean trajectory.
Volume Verification: Filters signals to ensure price movement is backed by market participation.
Market Structure: Identifies previous high-volume supply and demand zones for support and resistance analysis.
2. Core Components and Logic
The Trajectory Engine
The backbone of the system is a Linear Regression calculation. This statistical method fits a straight line through recent price data points to determine the current slope and direction.
The Baseline: Represents the "fair value" or mean trajectory of the asset.
The Cloud: Calculated using Average True Range (ATR). It expands during high volatility and contracts during consolidation.
Trend Definition:
Bullish: Price breaks above the Upper Deviation Band.
Bearish: Price breaks below the Lower Deviation Band.
Neutral/Chop: Price remains inside the cloud.
Smart Volume Filter
The indicator includes a toggleable volume filter. When enabled, the script calculates a Simple Moving Average (SMA) of the volume.
High Volume: Current volume is greater than the Volume SMA.
Signal Validation: Reversal signals and structure zones are only generated if High Volume is present, reducing the likelihood of trading false breakouts on low liquidity.
Volume Structure (Smart Liquidity)
The script automatically plots Support (Demand) and Resistance (Supply) boxes based on pivot points.
Creation: A box is drawn only if a pivot high or low is formed with High Volume (if the volume filter is active).
Mitigation: The boxes extend to the right. If price breaks through a zone, the box turns gray to indicate the level has been breached.
3. Signal Guide
Trend Reversals (Buy/Sell Labels)
These are the primary signals indicating a potential change in the macro trend.
BUY Signal: Appears when price closes above the upper volatility band after previously being in a downtrend.
SELL Signal: Appears when price closes below the lower volatility band after previously being in an uptrend.
Pullbacks (Small Circles)
These are continuation signals, useful for adding to positions or entering an existing trend.
Long Pullback: The trend is Bullish, but price dips momentarily below the baseline (into the "discount" area) and closes back above it.
Short Pullback: The trend is Bearish, but price rallies momentarily above the baseline (into the "premium" area) and closes back below it.
4. Configuration and Settings
Trend Engine Settings
Trajectory Length: The lookback period for the Linear Regression. This is the most critical setting for tuning sensitivity.
Channel Multiplier: Controls the width of the cloud.
1.0: Aggressive. Results in narrower bands and earlier signals, but more false positives.
1.5: Balanced (Default).
2.0+: Conservative. Creates a wide channel, filtering out significant noise but delaying entry signals.
Signal Logic
Show Trend Reversals: Toggles the main Buy/Sell labels.
Show Pullbacks: Toggles the re-entry circle signals.
Smart Volume Filter: If checked, signals require above-average volume. Unchecking this yields more signals but removes the volume confirmation requirement.
Volume Structure
Show Smart Liquidity: Toggles the Support/Resistance boxes.
Structure Lookback: Defines how many bars constitute a pivot. Higher numbers identify only major market structures.
Max Active Zones: Limits the number of boxes on the chart to prevent clutter.
5. Timeframe Optimization Guide
To maximize the effectiveness of the Linear Trajectory, you must adjust the Trajectory Length input based on your trading style and timeframe.
Scalping (1-Minute to 5-Minute Charts)
Recommended Length: 20 to 30
Multiplier: 1.2 to 1.5
Logic: Fast-moving markets require a shorter lookback to react quickly to micro-trend changes.
Day Trading (15-Minute to 1-Hour Charts)
Recommended Length: 55 (Default)
Multiplier: 1.5
Logic: A balance between responsiveness and noise filtering. The default setting of 55 is standard for identifying intraday sessions.
Swing Trading (4-Hour to Daily Charts)
Recommended Length: 89 to 100
Multiplier: 1.8 to 2.0
Logic: Swing trading requires filtering out intraday noise. A longer length ensures you stay in the trade during minor retracements.
6. Dashboard (HUD) Interpretation
The Head-Up Display (HUD) provides a summary of the current market state without needing to analyze the chart visually.
Bias: Displays the current trend direction (BULLISH or BEARISH).
Momentum:
ACCELERATING: Price is moving away from the baseline (strong trend).
WEAKENING: Price is compressing toward the baseline (potential consolidation or reversal).
Volume: Indicates if the current candle's volume is HIGH or LOW relative to the average.
Disclaimer
*Trading cryptocurrencies, stocks, forex, and other financial instruments involves a high level of risk and may not be suitable for all investors. This indicator is a technical analysis tool provided for educational and informational purposes only. It does not constitute financial advice, investment recommendations, or a guarantee of profit. Past performance of any trading system or methodology is not necessarily indicative of future results.
