Options Scalper v2 - SPY/QQQHere's a comprehensive description of the Options Scalper v2 strategy:
---
## Options Scalper v2 - SPY/QQQ
### Overview
A multi-indicator confluence-based scalping strategy designed for trading SPY and QQQ options on short timeframes (1-5 minute charts). The strategy uses a scoring system to generate high-probability CALL and PUT signals by requiring alignment across multiple technical indicators before triggering entries.
---
### Core Logic
The strategy operates on a **scoring system (0-9 points)** where both bullish (CALL) and bearish (PUT) conditions are evaluated independently. A signal only fires when:
1. A recent EMA crossover occurred (within the last 3 bars)
2. The direction's score meets the minimum threshold (default: 4 points)
3. The signal's score is higher than the opposite direction
4. Enough bars have passed since the last signal (cooldown period)
5. Price action occurs during valid trading sessions
---
### Indicators Used
| Indicator | Purpose | CALL Condition | PUT Condition |
|-----------|---------|----------------|---------------|
| **9/21 EMA Cross** | Primary trigger | Fast EMA crosses above slow | Fast EMA crosses below slow |
| **200 EMA** | Trend filter | Price above 200 EMA | Price below 200 EMA |
| **RSI (14)** | Momentum filter | RSI between 45-65 | RSI between 35-55 |
| **VWAP** | Institutional level | Price above VWAP | Price below VWAP |
| **MACD (12,26,9)** | Momentum confirmation | MACD line > Signal line | MACD line < Signal line |
| **Stochastic (14,3)** | Overbought/Oversold | Oversold or K > D | Overbought or K < D |
| **Volume** | Participation confirmation | Spike on green candle | Spike on red candle |
| **Price Structure** | Breakout detection | Higher high formed | Lower low formed |
---
### Scoring Breakdown
**CALL Score (Max 9 points):**
- Recent EMA cross up: +2 pts
- EMA alignment (fast > slow): +1 pt
- RSI in bullish range: +1 pt
- Above VWAP: +1 pt
- MACD bullish: +1 pt
- Volume spike on green candle: +1 pt
- Stochastic setup: +1 pt
- Above 200 EMA: +1 pt
- Breaking higher high: +1 pt
**PUT Score (Max 9 points):**
- Recent EMA cross down: +2 pts
- EMA alignment (fast < slow): +1 pt
- RSI in bearish range: +1 pt
- Below VWAP: +1 pt
- MACD bearish: +1 pt
- Volume spike on red candle: +1 pt
- Stochastic setup: +1 pt
- Below 200 EMA: +1 pt
- Breaking lower low: +1 pt
---
### Risk Management
The strategy uses **ATR-based dynamic stops and targets**:
| Parameter | Default | Description |
|-----------|---------|-------------|
| Stop Loss | 1.5x ATR | Distance below entry for longs, above for shorts |
| Take Profit | 2.0x ATR | Creates a 1:1.33 risk-reward ratio |
Positions are also closed on:
- Opposite direction signal (flip trade)
- Take profit or stop loss hit
---
### Session Filtering
Trades are restricted to high-liquidity periods by default:
- **Morning Session:** 9:30 AM - 11:00 AM EST
- **Afternoon Session:** 2:30 PM - 3:55 PM EST
This avoids choppy midday price action and captures the highest volume periods.
---
### Input Parameters
| Parameter | Default | Description |
|-----------|---------|-------------|
| Fast EMA | 9 | Fast moving average period |
| Slow EMA | 21 | Slow moving average period |
| Trend EMA | 200 | Long-term trend filter |
| RSI Length | 14 | RSI calculation period |
| RSI Overbought | 65 | Upper RSI threshold |
| RSI Oversold | 35 | Lower RSI threshold |
| Volume Multiplier | 1.2x | Volume spike detection threshold |
| Min Signal Strength | 4 | Minimum score required to trigger |
| Crossover Lookback | 3 | Bars to consider crossover "recent" |
| Min Bars Between Signals | 5 | Cooldown period between signals |
---
### Visual Elements
**Chart Plots:**
- Green line: 9 EMA (fast)
- Red line: 21 EMA (slow)
- Gray line: 200 EMA (trend)
- Purple dots: VWAP
**Signal Markers:**
- Green triangle up + "CALL" label: Buy call signal
- Red triangle down + "PUT" label: Buy put signal
- Small circles: EMA crossover reference points
**Info Table (Top Right):**
- Real-time CALL and PUT scores
- RSI, MACD, Stochastic values
- VWAP and 200 EMA position
- Recent crossover status
- Current signal state
---
### Alerts
| Alert Name | Trigger |
|------------|---------|
| CALL Entry | Standard call signal fires |
| PUT Entry | Standard put signal fires |
| Strong CALL | Call signal with score ≥ 6 |
| Strong PUT | Put signal with score ≥ 6 |
---
### Recommended Usage
| Setting | 0DTE Scalping | Intraday Swings |
|---------|---------------|-----------------|
| Timeframe | 1-2 min | 5 min |
| Min Signal Strength | 5-6 | 4 |
| ATR Stop Mult | 1.0 | 1.5 |
| ATR TP Mult | 1.5 | 2.0 |
| Option Delta | 0.40-0.50 | 0.30-0.40 |
---
### Key Improvements Over v1
1. **Requires actual crossover** - Eliminates false signals from simple trend continuation
2. **Balanced scoring** - Both directions evaluated equally, highest score wins
3. **Signal cooldown** - Prevents overtrading with minimum bar spacing
4. **Multi-indicator confluence** - 8 factors must align for signal generation
5. **Volume-candle alignment** - Volume spikes only count when matching candle direction
---
### Disclaimer
This strategy is for educational purposes. Backtest thoroughly before live trading. Options trading involves significant risk of loss. Past performance does not guarantee future results.
Cerca negli script per "scalping"

Vinz Win BTC – STRATEGY AUTO 1m🚀 VinzWin BTC Strategy – BTC Scalping AUTO 1 min
The VinzWin strategy is based on a simple and highly effective price action pattern:
✅ 2 red candles followed by 1 green candle
✅ Doji filter set to 0
✅ Trading exclusively on BTC
✅ Session from 12:00 to 12:00 (24/7)
✅ Fixed Risk/Reward at 1:2
✅ Stop Loss set in fixed € amount
✅ Automatic risk management based on the Stop Loss
On every trade:
The Stop Loss is defined in fixed euros,
The Take Profit is always set at twice the risk,
The lot size is automatically adjusted to market conditions,
ensuring clean, stable, and fully controlled risk management.
📊 Multi-year backtests are available and show truly outstanding results, with strong consistency and an excellent profit/loss ratio.
👉 A simple, mechanical strategy with no over-optimization, perfectly suited for BTC scalping with fully controlled capital management in euros.

MACD Liquidity Tracker Strategy [Quant Trading]MACD Liquidity Tracker Strategy
Overview
The MACD Liquidity Tracker Strategy is an enhanced trading system that transforms the traditional MACD indicator into a comprehensive momentum-based strategy with advanced visual signals and risk management. This strategy builds upon the original MACD Liquidity Tracker System indicator by TheNeWSystemLqtyTrckr , converting it into a fully automated trading strategy with improved parameters and additional features.
What Makes This Strategy Original
This strategy significantly enhances the basic MACD approach by introducing:
Four distinct system types for different market conditions and trading styles
Advanced color-coded histogram visualization with four dynamic colors showing momentum strength and direction
Integrated trend filtering using 9 different moving average types
Comprehensive risk management with customizable stop-loss and take-profit levels
Multiple alert systems for entry signals, exits, and trend conditions
Flexible signal display options with customizable entry markers
How It Works
Core MACD Calculation
The strategy uses a fully customizable MACD configuration with traditional default parameters:
Fast MA : 12 periods (customizable, minimum 1, no maximum limit)
Slow MA : 26 periods (customizable, minimum 1, no maximum limit)
Signal Line : 9 periods (customizable, now properly implemented and used)
Cryptocurrency Optimization : The strategy's flexible parameter system allows for significant optimization across different crypto assets. Traditional MACD settings (12/26/9) often generate excessive noise and false signals in volatile crypto markets. By using slower, more smoothed parameters, traders can capture meaningful momentum shifts while filtering out market noise.
Example - DOGE Optimization (45/80/290 settings) :
• Performance : Optimized parameters yielding exceptional backtesting results with 29,800% PnL
• Why it works : DOGE's high volatility and social sentiment-driven price action benefits from heavily smoothed indicators
• Timeframes : Particularly effective on 30-minute and 4-hour charts for swing trading
• Logic : The very slow parameters filter out noise and capture only the most significant trend changes
Other Optimizable Cryptocurrencies : This parameter flexibility makes the strategy highly effective for major altcoins including SUI, SEI, LINK, Solana (SOL) , and many others. Each crypto asset can benefit from custom parameter tuning based on its unique volatility profile and trading characteristics.
Four Trading System Types
1. Normal System (Default)
Long signals : When MACD line is above the signal line
Short signals : When MACD line is below the signal line
Best for : Swing trading and capturing longer-term trends in stable markets
Logic : Traditional MACD crossover approach using the signal line
2. Fast System
Long signals : Bright Blue OR Dark Magenta (transparent) histogram colors
Short signals : Dark Blue (transparent) OR Bright Magenta histogram colors
Best for : Scalping and high-volatility markets (crypto, forex)
Logic : Leverages early momentum shifts based on histogram color changes
3. Safe System
Long signals : Only Bright Blue histogram color (strongest bullish momentum)
Short signals : All other colors (Dark Blue, Bright Magenta, Dark Magenta)
Best for : Risk-averse traders and choppy markets
Logic : Prioritizes only the strongest bullish signals while treating everything else as bearish
4. Crossover System
Long signals : MACD line crosses above signal line
Short signals : MACD line crosses below signal line
Best for : Precise timing entries with traditional MACD methodology
Logic : Pure crossover signals for more precise entry timing
Color-Coded Histogram Logic
The strategy uses four distinct colors to visualize momentum:
🔹 Bright Blue : MACD > 0 and rising (strong bullish momentum)
🔹 Dark Blue (Transparent) : MACD > 0 but falling (weakening bullish momentum)
🔹 Bright Magenta : MACD < 0 and falling (strong bearish momentum)
🔹 Dark Magenta (Transparent) : MACD < 0 but rising (weakening bearish momentum)
Trend Filter Integration
The strategy includes an advanced trend filter using 9 different moving average types:
SMA (Simple Moving Average)
EMA (Exponential Moving Average) - Default
WMA (Weighted Moving Average)
HMA (Hull Moving Average)
RMA (Running Moving Average)
LSMA (Least Squares Moving Average)
DEMA (Double Exponential Moving Average)
TEMA (Triple Exponential Moving Average)
VIDYA (Variable Index Dynamic Average)
Default Settings : 50-period EMA for trend identification
Visual Signal System
Entry Markers : Blue triangles (▲) below candles for long entries, Magenta triangles (▼) above candles for short entries
Candle Coloring : Price candles change color based on active signals (Blue = Long, Magenta = Short)
Signal Text : Optional "Long" or "Short" text inside entry triangles (toggleable)
Trend MA : Gray line plotted on main chart for trend reference
Parameter Optimization Examples
DOGE Trading Success (Optimized Parameters) :
Using 45/80/290 MACD settings with 50-period EMA trend filter has shown exceptional results on DOGE:
Performance : Backtesting results showing 29,800% PnL demonstrate the power of proper parameter optimization
Reasoning : DOGE's meme-driven volatility and social sentiment spikes create significant noise with traditional MACD settings
Solution : Very slow parameters (45/80/290) filter out social media-driven price spikes while capturing only major momentum shifts
Optimal Timeframes : 30-minute and 4-hour charts for swing trading opportunities
Result : Exceptionally clean signals with minimal false entries during DOGE's characteristic pump-and-dump cycles
Multi-Crypto Adaptability :
The same optimization principles apply to other major cryptocurrencies:
SUI : Benefits from smoothed parameters due to newer coin volatility patterns
SEI : Requires adjustment for its unique DeFi-related price movements
LINK : Oracle news events create price spikes that benefit from noise filtering
Solana (SOL) : Network congestion events and ecosystem developments need smoothed detection
General Rule : Higher volatility coins typically benefit from very slow MACD parameters (40-50 / 70-90 / 250-300 ranges)
Key Input Parameters
System Type : Choose between Fast, Normal, Safe, or Crossover (Default: Normal)
MACD Fast MA : 12 periods default (no maximum limit, consider 40-50 for crypto optimization)
MACD Slow MA : 26 periods default (no maximum limit, consider 70-90 for crypto optimization)
MACD Signal MA : 9 periods default (now properly utilized, consider 250-300 for crypto optimization)
Trend MA Type : EMA default (9 options available)
Trend MA Length : 50 periods default (no maximum limit)
Signal Display : Both, Long Only, Short Only, or None
Show Signal Text : True/False toggle for entry marker text
Trading Applications
Recommended Use Cases
Momentum Trading : Capitalize on strong directional moves using the color-coded system
Trend Following : Combine MACD signals with trend MA filter for higher probability trades
Scalping : Use "Fast" system type for quick entries in volatile markets
Swing Trading : Use "Normal" or "Safe" system types for longer-term positions
Cryptocurrency Trading : Optimize parameters for individual crypto assets (e.g., 45/80/290 for DOGE, custom settings for SUI, SEI, LINK, SOL)
Market Suitability
Volatile Markets : Forex, crypto, indices (recommend "Fast" system or smoothed parameters)
Stable Markets : Stocks, ETFs (recommend "Normal" or "Safe" system)
All Timeframes : Effective from 1-minute charts to daily charts
Crypto Optimization : Each major cryptocurrency (DOGE, SUI, SEI, LINK, SOL, etc.) can benefit from custom parameter tuning. Consider slower MACD parameters for noise reduction in volatile crypto markets
Alert System
The strategy provides comprehensive alerts for:
Entry Signals : Long and short entry triangle appearances
Exit Signals : Position exit notifications
Color Changes : Individual histogram color alerts
Trend Conditions : Price above/below trend MA alerts
Strategy Parameters
Default Settings
Initial Capital : $1,000
Position Size : 100% of equity
Commission : 0.1%
Slippage : 3 points
Date Range : January 1, 2018 to December 31, 2069
Risk Management (Optional)
Stop Loss : Disabled by default (customizable percentage-based)
Take Profit : Disabled by default (customizable percentage-based)
Short Trades : Disabled by default (can be enabled)
Important Notes and Limitations
Backtesting Considerations
Uses realistic commission (0.1%) and slippage (3 points)
Default position sizing uses 100% equity - adjust based on risk tolerance
Stop-loss and take-profit are disabled by default to show raw strategy performance
Strategy does not use lookahead bias or future data
Risk Warnings
Past performance does not guarantee future results
MACD-based strategies may produce false signals in ranging markets
Consider combining with additional confluences like support/resistance levels
Test thoroughly on demo accounts before live trading
Adjust position sizing based on your risk management requirements
Technical Limitations
Strategy does not work on non-standard chart types (Heikin Ashi, Renko, etc.)
Signals are based on close prices and may not reflect intraday price action
Multiple rapid signals in volatile conditions may result in overtrading
Credits and Attribution
This strategy is based on the original "MACD Liquidity Tracker System" indicator created by TheNeWSystemLqtyTrckr . This strategy version includes significant enhancements:
Complete strategy implementation with entry/exit logic
Addition of the "Crossover" system type
Proper implementation and utilization of the MACD signal line
Enhanced risk management features
Improved parameter flexibility with no artificial maximum limits
Additional alert systems for comprehensive trade management
The original indicator's core color logic and visual system have been preserved while expanding functionality for automated trading applications.

The Most Powerful TQQQ EMA Crossover Trend Trading StrategyTQQQ EMA Crossover Strategy Indicator
Meta Title: TQQQ EMA Crossover Strategy - Enhance Your Trading with Effective Signals
Meta Description: Discover the TQQQ EMA Crossover Strategy, designed to optimize trading decisions with fast and slow EMA crossovers. Learn how to effectively use this powerful indicator for better trading results.
Key Features
The TQQQ EMA Crossover Strategy is a powerful trading tool that utilizes Exponential Moving Averages (EMAs) to identify potential entry and exit points in the market. Key features of this indicator include:
**Fast and Slow EMAs:** The strategy incorporates two EMAs, allowing traders to capture short-term trends while filtering out market noise.
**Entry and Exit Signals:** Automated signals for entering and exiting trades based on EMA crossovers, enhancing decision-making efficiency.
**Customizable Parameters:** Users can adjust the lengths of the EMAs, as well as take profit and stop loss multipliers, tailoring the strategy to their trading style.
**Visual Indicators:** Clear visual plots of the EMAs and exit points on the chart for easy interpretation.
How It Works
The TQQQ EMA Crossover Strategy operates by calculating two EMAs: a fast EMA (default length of 20) and a slow EMA (default length of 50). The core concept is based on the crossover of these two moving averages:
- When the fast EMA crosses above the slow EMA, it generates a *buy signal*, indicating a potential upward trend.
- Conversely, when the fast EMA crosses below the slow EMA, it produces a *sell signal*, suggesting a potential downward trend.
This method allows traders to capitalize on momentum shifts in the market, providing timely signals for trade execution.
Trading Ideas and Insights
Traders can leverage the TQQQ EMA Crossover Strategy in various market conditions. Here are some insights:
**Scalping Opportunities:** The strategy is particularly effective for scalping in volatile markets, allowing traders to make quick profits on small price movements.
**Swing Trading:** Longer-term traders can use this strategy to identify significant trend reversals and capitalize on larger price swings.
**Risk Management:** By incorporating customizable stop loss and take profit levels, traders can manage their risk effectively while maximizing potential returns.
How Multiple Indicators Work Together
While this strategy primarily relies on EMAs, it can be enhanced by integrating additional indicators such as:
- **Relative Strength Index (RSI):** To confirm overbought or oversold conditions before entering trades.
- **Volume Indicators:** To validate breakout signals, ensuring that price movements are supported by sufficient trading volume.
Combining these indicators provides a more comprehensive view of market dynamics, increasing the reliability of trade signals generated by the EMA crossover.
Unique Aspects
What sets this indicator apart is its simplicity combined with effectiveness. The reliance on EMAs allows for smoother signals compared to traditional moving averages, reducing false signals often associated with choppy price action. Additionally, the ability to customize parameters ensures that traders can adapt the strategy to fit their unique trading styles and risk tolerance.
How to Use
To effectively utilize the TQQQ EMA Crossover Strategy:
1. **Add the Indicator:** Load the script onto your TradingView chart.
2. **Set Parameters:** Adjust the fast and slow EMA lengths according to your trading preferences.
3. **Monitor Signals:** Watch for crossover points; enter trades based on buy/sell signals generated by the indicator.
4. **Implement Risk Management:** Set your stop loss and take profit levels using the provided multipliers.
Regularly review your trading performance and adjust parameters as necessary to optimize results.
Customization
The TQQQ EMA Crossover Strategy allows for extensive customization:
- **EMA Lengths:** Change the default lengths of both fast and slow EMAs to suit different time frames or market conditions.
- **Take Profit/Stop Loss Multipliers:** Adjust these values to align with your risk management strategy. For instance, increasing the take profit multiplier may yield larger gains but could also increase exposure to market fluctuations.
This flexibility makes it suitable for various trading styles, from aggressive scalpers to conservative swing traders.
Conclusion
The TQQQ EMA Crossover Strategy is an effective tool for traders seeking an edge in their trading endeavors. By utilizing fast and slow EMAs, this indicator provides clear entry and exit signals while allowing for customization to fit individual trading strategies. Whether you are a scalper looking for quick profits or a swing trader aiming for larger moves, this indicator offers valuable insights into market trends.
Incorporate it into your TradingView toolkit today and elevate your trading performance!

SPY 1 Minute Day TraderWhen scalping options, users are looking for where breakouts are going to occur instead of sitting thru areas choppy price action that drain delta and cause them to lose value even if price is up trending. This script tries to identify when a trend reversal is expected based on one minute price action on the SPY. It alerts users to prepare for potential breakout when 5 out of the 6 key optimized parameters are discovered by showing a white L or S. Once all six trigger, it informs the user at the close of that candle with a golden triangle with Pivot Up or Pivot Down. As scalping options is something that is expected to be short in duration, a take profit and stop loss of 30 cents of price actions is established. If five or more parameters occur after the pivot is initiated, then stop losses and take profits are adhered to; however, if there are less, then it waits to take profit or stop the trade, as likely it is just noise and it will finish trend with an additional breakout.
This script has been created to take into account how the following variables impact trend for SPY 1 Minute:
ema vs 13 ema : A cross establishes start of trend
MACD (Line, Signal & Slope) : If you have momentum
ADX : if you are trending
RSI : If the trend has strength
The above has been optimized to determine pivot points in the trend using key values for these 6 indicators
bounce up = ema5 > ema13 and macdLine < .5 and adx > 20 and macdSlope > 0 and signalLine > -.1 and rsiSignal > 40
bounce down = ema5 < ema13 and macdLine > -.5 and adx > 20 and signalLine < 0 and macdSlope < 0 and rsiSignal < 60
White L's indicate that 5 of 6 conditions are met due to impending uptrend w/ missing one in green below it
Yellow L's indicate that 6 of 6 conditions still are met
White S's indicate that 5 of 6 conditions are met due to impending downtrend w/ missing condition in red above it
Yellow S's indicate that 6 of 6 conditions still are met
After a downtrend or uptrend is established, once it closes it can't repeat for 10 minutes
Won't open any trades on last two minutes of any hours to avoid volatility
Will close any open trades going into last minute of hour to avoid large overnight random swings.

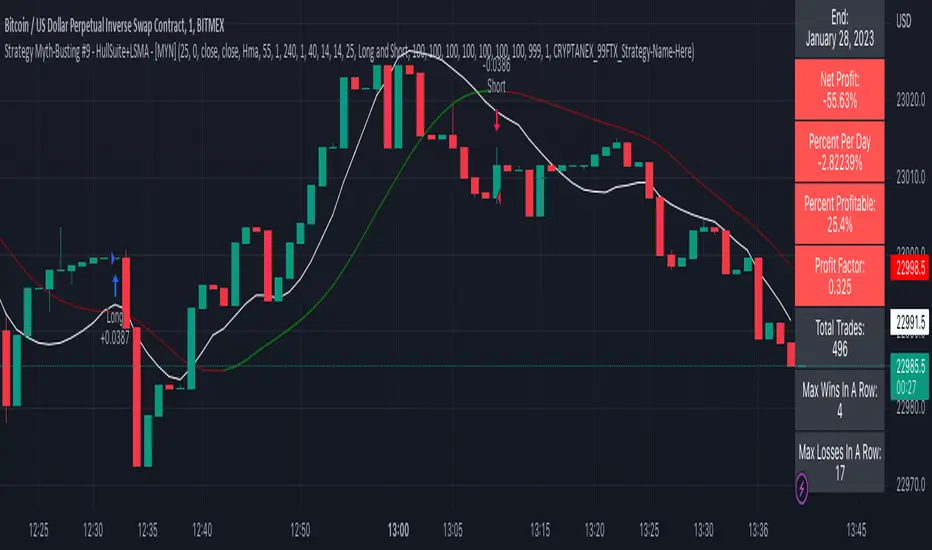
Strategy Myth-Busting #9 - HullSuite+LSMA - [MYN]This is part of a new series we are calling "Strategy Myth-Busting" where we take open public manual trading strategies and automate them. The goal is to not only validate the authenticity of the claims but to provide an automated version for traders who wish to trade autonomously.
Our 9th one is an automated version of the "I Tested The Best 1 Minute Scalping Strategy That Will Blow Your Mind 100 Times" strategy from "Profit Now" who claims to have achieved 36.7% profit scalping XRPUSDT on the 1 minute timeframe in only 15 days. As you can see from the backtest results below, I was unable to substantiate anything remotely close to that that claim on any timeframe or symbol. Myth 10000% busted.
This strategy uses a combination of 2 open-source public indicators: Hull Suite by InSilico and Least Squares Moving Average (LSMA)
The Hull Moving Average (HMA) is a faster version of the traditional moving average and is designed to reduce lag and improve the responsiveness of the average to price changes. In this strategy the HMA is used as a trend-following indicator, When the HMA is rising it is indicative of an upwards trend and when its falling its indicative of a downtrend.
The Least Squares Moving Average (LSMA) used in this strategy is similar to the HMA in that it is designed to reduce lag and improve the responsiveness of the average to price changes. In this strategy the LSMA is used to also not only identify trends but also confirm signals, it also is used to identify possible changes in the trend and market conditions.
When we use these together, the Hull Suite and LSMA indicators provide a complimentary confirmation of trend direction and trend swings. The Hull Suite helps to identify and confirm trends, while the LSMA aids to confirm signals and identify potential changes in market conditions.
The way this strategy is designed is when the Hull Suite HMA is trending up and the LSMA crosses above the HMA, we enter a long condition. When the Hull Suite is trending down and the LSMA crosses below the HMA we take a short position. Because of the low latency of these two indicators this strategy can be used on lower time frames down to 1 minute. On high volatility crypto on the lowest time frames, a 1:4 Risk Ratio should be used. A lower less risk ratio should be used on less volatile archetypes of securities.
If you know of or have a strategy you want to see myth-busted or just have an idea for one, please feel free to message me
Strategy Myth-Busting #8 - TrendSurfers+TrendOsc - [MYN]This is part of a new series we are calling "Strategy Myth-Busting" where we take open public manual trading strategies and automate them. The goal is to not only validate the authenticity of the claims but to provide an automated version for traders who wish to trade autonomously.
Our 8th one is an automated version of the " 653% Gain Magical 1 Minute Scalping Strategy Tested 100 Times | Become Consistently Huge Profit " strategy from " Fxaccurate US " who claims to have achieved 653% profit scalping GOLD on the 5 minute timeframe. As you can see from the backtest results below, I was unable to substantiate anything close to that that claim on any timeframe or symbol. Myth 10000% busted.
If you know of or have a strategy you want to see myth-busted or just have an idea for one, please feel free to message me.
This strategy uses a combination of 2 open-source public indicators:
Trend Surfers - Premium Breakout + Alerts by TrendSurfersSignals
Mawreez' Trend Oscillator Indicator by Mawreez
Trading Rules:
1 min - 15 min candles
Stop loss middle between high and low Risk 1:2
Long Condition
Trend Surfers Trailing stop line goes below (Crosses) lowest low
Bullish Candle (red)
Mawreeze Trend Oscilator Indicator is green
Short Condition
Trend Surfers Trailing stop line goes above (Crosses) highest high
Bearish Candle (red)
Mawreeze Trend Oscilator Indicator is red

RSI Improved strategySet a Horizontal Ray at the price that relates highest / lowest RSI .
It 's more clear to decide when to open long / short position manually.
It's a scalping strategy that works in 15min chart(basically works in most of timeframe , if you don't look it as a scalping strategy), when RSI hits Highest / Lowest value , the strategy will open a Long / Short position.
The Default Risk Reward Ratio was 1 (1600 points : 1600 points) you can adjust it in settings
You guys can look it as a RSI alert indicator
Think before you do , use it wisely. Thanks a lot!
There is a lot of useless words in Pine if you wanna look it please ignore it.

EMA SCALPEUR LONG V2THIS IS A TRY TO FIND THE BEST EMAS FOR SCALPING
YOU HAVE 4 EMAS, YOU CAN CHOOSE 2 FOR THE ENTER
This a try to find the best EMAs for scalping
you have 4 EMAs, 2 to find the best enter possible and 2 others to find the best way out possible
Customizable Non-Repainting HTF MACD MFI Scalper Bot Strategy v2Customizable Non-Repainting HTF MACD MFI Scalper Bot Strategy v2
This script was originally shared by Wunderbit as a free open source script for the community to work with. This is my second published iteration of this idea.
WHAT THIS SCRIPT DOES:
It is intended for use on an algorithmic bot trading platform but can be used for scalping and manual trading.
This strategy is based on the trend-following momentum indicator . It includes the Money Flow index as an additional point for entry.
This is a new and improved version geared for lower timeframes (15-5 minutes), but can be run on larger ones as well. I am testing it live as my high frequency trader.
HOW IT DOES IT:
It uses a combination of MACD and MFI indicators to create entry signals. Parameters for each indicator have been surfaced for user configurability.
Take profits are now trailing profits, and the stop loss is now fixed. Why? I found that the trailing stop loss with ATR in the previous version yields very good results for back tests but becomes very difficult to deploy live due to transaction fees. As you can see the average trade is a higher profit percentage than the previous version.
HOW IS MY VERSION ORIGINAL:
Now instead of using ATR stop loss, we have a fixed stop loss - counter intuitively to what some may believe this performs better in live trading scenarios since it gives the strategy room to move. I noticed that the ATR trailing stop was stopping out too fast and was eating away balance due to transaction fees.
The take profit on the other hand is now a trailing profit with a customizable deviation. This ensures that you can have a minimum profit you want to take in order to exit.
I have depracated the old ATR trailing stop as it became too confusing to have those as different options. I kept the old version for others that want to experiment with it. The source code still requires some cleanup, but its fully functional.
I added in a way to show RSI values and ATR values with a checkbox so that you can use the new an improved ATR Filter (and grab the right RSI values for the RSI filter). This will help to filter out times of very low volatility where we are unlikely to find a profitable trade. Use the "Show Data" checkbox to see what the values are on the indicator pane, then use those values to gauge what you want to filter out.
Both versions
Delayed Signals : The script has been refactored to use a time frame drop down. The higher time frame can be run on a faster chart (recommended on one minute chart for fastest signal confirmation and relay to algotrading platform.)
Repainting Issues : All indicators have been recoded to use the security function that checks to see if the current calculation is in realtime, if it is, then it uses the previous bar for calculation. If you are still experiencing repainting issues based on intended (or non intended use), please provide a report with screenshot and explanation so I can try to address.
Filtering : I have added to additional filters an ABOVE EMA Filter and a BELOW RSI Filter (both can be turned on and off)
Customizable Long and Close Messages : This allows someone to use the script for algorithmic trading without having to alter code. It also means you can use one indicator for all of your different alterts required for your bots.
HOW TO USE IT:
It is intended to be used in the 5-30 minute time frames, but you might be able to get a good configuration for higher time frames. I welcome feedback from other users on what they have found.
Find a pair with high volatility (example KUCOIN:ETH3LUSDT ) - I have found it works particularly well with 3L and 3S tokens for crypto. although it the limitation is that confrigurations I have found to work typically have low R/R ratio, but very high win rate and profit factor.
Ideally set one minute chart for bots, but you can use other charts for manual trading. The signal will be delayed by one bar but I have found configurations that still test well.
Select a time frame in configuration for your indicator calculations.
Select the strategy config for time frame (resolution). I like to use 5 and 15 minutes for scalping scenarios, but I am interested in hearing back from other community memebers.
Optimize your indicator without filters : customize your settings for MACD and MFI that are profitable with your chart and selected time frame calculation. Try different Take Profits (try about 2-5%) and stop loss (try about 5-8%). See if your back test is profitable and continue to optimize.
Use the Trend, RSI, ATR Filter to further refine your signals for entry. You will get less entries but you can increase your win ratio.
You can use the open and close messages for a platform integration, but I choose to set mine up on the destination platform and let the platform close it. With certain platforms you cannot be sure what your entry point actually was compared to Trading View due to slippage and timing, so I let the platform decide when it is actually profitable.
Limitations: this works rather well for short term, and does some good forward testing but back testing large data sets is a problem when switching from very small time frame to large time frame. For instance, finding a configuration that works on a one minute chart but then changing to a 1 hour chart means you lose some of your intra bar calclulations. There are some new features in pine script which might be able to address, this, but I have not had a chance to work on that issue.

Crypto EMA Trend Reversal StrategyThis is an EMA crossover strategy which involves 5 EMAs to trigger trades. The strategy has two take profit settings and uses a stop loss.
TP1 and SL are based on ATR and TP2 is an EMA crossover.
The strategy goes both long and short and the default settings work particularly well as a scalping strategy for ETHUSDT on the 5M time frame.
I have also created another version with tweaked settings for scalping LINKUSDT on the 5M with very similar results.
There is an option to add a volume condition parameter within the script on lines 26-28 which can be added to the end of lines 34-35 in the following format: and vol_cond
I personally don't currently use the volume condition parameter.

BB+AO STRATto be used with AO indicator, based on forex strat --
www.forexstrategiesresources.com
works on 1/3/5/15/30 candles, buy signals are best when the black 3 fast ema crosses up through the red mid band

BB+AO STRATto be used with AO, based on forex strat --
www.forexstrategiesresources.com
works on 1/3/5/15/30 candles

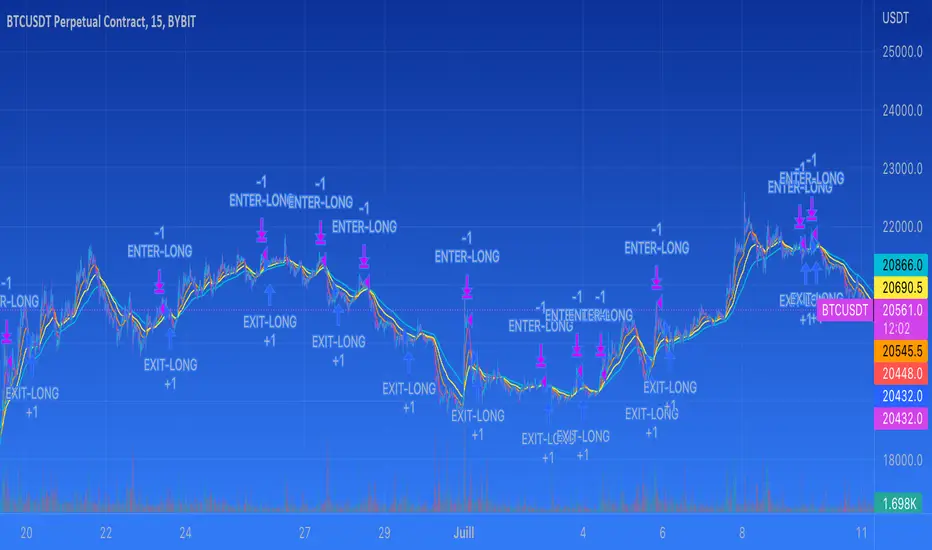
PMax - Asymmetric MultipliersDescription: This script is an enhanced version of the popular PMax (Profit Maximizer) indicator, originally developed by KivancOzbilgic. It has been converted into a full strategy with advanced customization options for backtesting and trend following.
Key Features & Modifications:
Asymmetric ATR Multipliers: Unlike the standard version, this script allows you to set different ATR multipliers for Upper (Short/Resistance) and Lower (Long/Support) bands.
Default Upper: 1.5 (Tighter trailing for Short positions)
Default Lower: 3.0 (Wider trailing for Long positions to avoid whipsaws)
Expanded MA Types: Added HULL (HMA) and VAR (Variable Index Dynamic Average) options.
VAR is highly recommended for filtering out noise in ranging markets.
HULL is ideal for scalping and faster reactions.
Built-in Risk Management: A fixed 5% Stop Loss mechanism is integrated into the strategy. It protects your capital by closing positions if the price moves 5% against you, even if the trend hasn't reversed yet.
Visibility Fix: Solved the issue where the PMax line would disappear or start at zero in the initial bars.
How to Use:
Use the VAR MA type for trend following in volatile markets.
Adjust the "Stop Loss Percent" input to fit your risk appetite.
The strategy employs an "Always In" logic (Long/Short) but respects the hard Stop Loss.
Credits: Original PMax logic by KivancOzbilgic.

Trend Following $BTC - Multi-Timeframe Structure + ReversTREND FOLLOWING STRATEGY - MULTI-TIMEFRAME STRUCTURE BREAKOUT SYSTEM
Strategy Overview
This is an enhanced Turtle Trading system designed for cryptocurrency spot trading. It combines Donchian Channel breakouts with multi-timeframe structure filtering and ATR-based dynamic risk management. The strategy trades both long and short positions using reverse signal exits to maximize trend capture.
Core Features
Multi-Timeframe Structure Filtering
The strategy uses Swing High/Low analysis to identify market structure trends. You can customize the structure timeframe (default: 3 minutes) to match your trading style. Only enters trades aligned with the identified trend direction, avoiding counter-trend positions that often lead to losses.
Reverse Signal Exit System
Instead of using fixed stop-losses or time-based exits, this strategy exits positions only when a reverse entry signal triggers. This approach maximizes trend profits and reduces premature exits during normal market retracements.
ATR Dynamic Pyramiding
Automatically adds positions when price moves 0.5 ATR in your favor. Supports up to 2 units maximum (adjustable). This pyramid scaling enhances profitability during strong trends while maintaining disciplined risk management.
Complete Risk Management
Fixed position sizing at 5000 USD per unit. Includes realistic commission fees of 0.06% (Binance spot rate). Initial capital set at 10,000 USD. All backtest parameters reflect real-world trading conditions.
Trading Logic
Entry Conditions
Long Entry: Close price breaks above the 20-period high AND structure trend is bullish (price breaks above Swing High)
Short Entry: Close price breaks below the 20-period low AND structure trend is bearish (price breaks below Swing Low)
Position Scaling
Long positions: Add when price rises 0.5 ATR or more
Short positions: Add when price falls 0.5 ATR or more
Maximum 2 units including initial entry
Exit Conditions
Long Exit: Triggers when short entry signal appears (price breaks 20-period low + structure turns bearish)
Short Exit: Triggers when long entry signal appears (price breaks 20-period high + structure turns bullish)
Default Parameters
Channel Settings
Entry Channel Period: 20 (Donchian Channel breakout period)
Exit Channel Period: 10 (reserved parameter)
ATR Settings
ATR Period: 20
Stop Loss ATR Multiplier: 2.0
Add Position ATR Multiplier: 0.5
Structure Filter
Swing Length: 300 (Swing High/Low calculation period)
Structure Timeframe: 3 minutes
Adjust these based on your trading timeframe and asset volatility
Position Management
Maximum Units: 2 (including initial entry)
Capital Per Unit: 5000 USD
Visualization Features
Background Colors
Light Green: Bullish market structure
Light Red: Bearish market structure
Dark Green: Long position entry
Dark Red: Short position entry
Optional Display Elements (Default: OFF)
Entry and exit channel lines
Structure high/low reference lines
ATR stop-loss indicator
Next position add level
Entry/exit labels
Alert Message Format
The strategy sends notifications with the following format:
Entry: "5m Long EP:90450.50"
Add Position: "15m Add Long 2/2 EP:91000.25"
Exit: "5m Close Long Reverse Signal"
Where the first part shows your current chart timeframe and EP indicates Entry Price
Backtest Settings
Capital Allocation
Initial Capital: 10,000 USD
Per Entry: 5,000 USD (split into 2 potential entries)
Leverage: 0x (spot trading only)
Trading Costs
Commission: 0.06% (Binance spot VIP0 rate)
Slippage: 0 (adjust based on your experience)
Best Use Cases
Ideal Scenarios
Trending markets with clear directional movement
Moderate to high volatility assets
Timeframes from 1-minute to 4-hour charts
Best suited for major cryptocurrencies with good liquidity
Not Recommended For
Highly volatile choppy/ranging markets
Low liquidity small-cap coins
Extreme market conditions or black swan events
Usage Recommendations
Timeframe Guidelines
1-5 minute charts: Use for scalping, consider Swing Length 100-160
15-30 minute charts: Good for short-term trading, Swing Length 50-100
1-4 hour charts: Suitable for swing trading, Swing Length 20-50
Optimization Tips
Always backtest on historical data before live trading
Adjust swing length based on asset volatility and your timeframe
Different cryptocurrencies may require different parameter settings
Enable visualization options initially to understand entry/exit points
Monitor win rate and drawdown during backtesting
Technical Details
Built on Pine Script v6
No repainting - uses proper bar referencing with offset
Prevents lookahead bias with lookahead=off parameter
Strategy mode with accurate commission and slippage modeling
Multi-timeframe security function for structure analysis
Proper position state tracking to avoid duplicate signals
Risk Disclaimer
This strategy is provided for educational and research purposes only. Past performance does not guarantee future results. Backtesting results may differ from live trading due to slippage, execution delays, and changing market conditions. The strategy performs best in trending markets and may experience drawdowns during ranging conditions. Always practice proper risk management and never risk more than you can afford to lose. It is recommended to paper trade first and start with small position sizes when going live.
How to Use
Add the strategy to your TradingView chart
Select your desired timeframe (1m to 4h recommended)
Adjust parameters based on your risk tolerance and trading style
Review backtest results in the Strategy Tester tab
Set up alerts for automated notifications
Consider paper trading before risking real capital
Tags
Trend Following, Turtle Trading, Donchian Channel, Structure Breakout, ATR, Cryptocurrency, Spot Trading, Risk Management, Pyramiding, Multi-Timeframe Analysis
---
Strategy Name: Trend Following BTC
Version: v1.0
Pine Script Version: v6
Last Updated: December 2025

Trend Following $ZEC - Multi-Timeframe Structure Filter + Revers# Trend Following CRYPTOCAP:ZEC - Strategy Guide
## 📊 Strategy Overview
Trend Following CRYPTOCAP:ZEC is an enhanced Turtle Trading system designed for cryptocurrency spot trading, combining Donchian Channel breakouts, multi-timeframe structure filtering, and ATR-based dynamic risk management for both long and short positions.
---
## 🎯 Core Features
1. Multi-Timeframe Structure Filtering
- Uses Swing High/Low to identify market structure
- Customizable structure timeframe (default: 1 minute)
- Only enters trades in the direction of the trend, avoiding counter-trend positions
2. Reverse Signal Exit
- No fixed stop-loss or fixed-period exits
- Exits only when a reverse entry signal triggers
- Maximizes trend profits, reduces premature exits
3. ATR Dynamic Pyramiding
- Adds positions when price moves 0.5 ATR in favorable direction
- Supports up to 2 units maximum (adjustable)
- Pyramid scaling to enhance profitability
4. Complete Risk Management
- Fixed position size (5000 USD per unit)
- Commission fee 0.06% (Binance spot rate)
- Initial capital 10,000 USD
---
## 📈 Trading Logic
Entry Conditions
✅ Long Entry:
- Close price breaks above 20-period high
- Structure trend is bullish (price breaks above Swing High)
✅ Short Entry:
- Close price breaks below 20-period low
- Structure trend is bearish (price breaks below Swing Low)
Add Position Conditions
- Long: Price rises ≥ 0.5 ATR
- Short: Price falls ≥ 0.5 ATR
- Maximum 2 units including initial entry
Exit Conditions
- Long Exit: When short entry signal triggers (price breaks 20-period low + structure turns bearish)
- Short Exit: When long entry signal triggers (price breaks 20-period high + structure turns bullish)
---
## ⚙️ Parameter Settings
Channel Settings
- Entry Channel Period: 20 (Donchian Channel breakout period)
- Exit Channel Period: 10 (reserved parameter, actually uses reverse signal exit)
ATR Settings
- ATR Period: 20
- Stop Loss ATR Multiplier: 2.0 (reserved parameter)
- Add Position ATR Multiplier: 0.5
Structure Filter
- Swing Length: 160 (Swing High/Low calculation period)
- Structure Timeframe: 1 minute (can change to 5/15/60, etc.)
Position Management
- Maximum Units: 2 (including initial entry)
- Capital Per Unit: 5000 USD
---
## 🎨 Visualization Features
Background Colors
- Light Green: Bullish structure
- Light Red: Bearish structure
- Dark Green: Long entry
- Dark Red: Short entry
Optional Display (Default: OFF)
- Entry/exit channel lines
- Structure high/low lines
- ATR stop-loss line
- Next add position indicator
- Entry/exit labels
---
## 📱 Alert Message Format
Strategy sends notifications on entry/exit with the following format:
- Entry: `1m Long EP:428.26`
- Add Position: `15m Add Long 2/2 EP:429.50`
- Exit: `1m Close Long Reverse Signal`
Where:
- `1m`/`15m` = Current chart timeframe
- `EP` = Entry Price
---
## 💰 Backtest Settings
Capital Allocation
- Initial Capital: 10,000 USD
- Per Entry: 5,000 USD (split into 2 entries)
- Leverage: 0x (spot trading)
Trading Costs
- Commission: 0.06% (Binance spot VIP0)
- Slippage: 0
---
## 🎯 Use Cases
✅ Best Scenarios
- Trending markets
- Moderate volatility assets
- 1-minute to 4-hour timeframes
⚠️ Not Suitable For
- Highly volatile choppy markets
- Low liquidity small-cap coins
- Extreme market conditions (black swan events)
---
## 📊 Usage Recommendations
Timeframe Suggestions
| Timeframe | Trading Style | Suggested Parameter Adjustment |
|-----------|--------------|-------------------------------|
| 1-5 min | Scalping | Swing Length 100-160 |
| 15-30 min | Short-term | Swing Length 50-100 |
| 1-4 hour | Swing Trading | Swing Length 20-50 |
Optimization Tips
1. Adjust swing length based on backtest results
2. Different coins may require different parameters
3. Recommend backtesting on 1-minute chart first before live trading
4. Enable labels to observe entry/exit points
---
## ⚠️ Risk Disclaimer
1. Past Performance Does Not Guarantee Future Results
- Backtest data is for reference only
- Live trading may be affected by slippage, delays, etc.
2. Market Condition Changes
- Strategy performs better in trending markets
- May experience frequent stops in ranging markets
3. Capital Management
- Do not invest more than you can afford to lose
- Recommend setting total capital stop-loss threshold
4. Commission Impact
- Frequent trading accumulates commission fees
- Recommend using exchange discounts (BNB fee reduction, etc.)
---
## 🔧 Troubleshooting
Q: No entry signals?
A: Check if structure filter is too strict, adjust swing length or timeframe
Q: Too many labels displayed?
A: Turn off "Show Labels" option in settings
Q: Poor backtest performance?
A:
1. Check if the coin is suitable for trend-following strategies
2. Adjust parameters (swing length, channel period)
3. Try different timeframes
Q: How to set alerts?
A:
1. Click "Alert" in top-right corner of chart
2. Condition: Select "Strategy - Trend Following CRYPTOCAP:ZEC "
3. Choose "Order filled"
4. Set notification method (Webhook/Email/App)
---
## 📞 Contact Information
Strategy Name: Trend Following CRYPTOCAP:ZEC
Version: v1.0
Pine Script Version: v6
Last Updated: December 2025
---
## 📄 Copyright Notice
This strategy is for educational and research purposes only.
All risks of using this strategy for live trading are borne by the user.
Commercial use without authorization is prohibited.
---
## 🎓 Learning Resources
To understand the strategy principles in depth, recommended reading:
- "The Complete TurtleTrader" - Curtis Faith
- "Trend Following" - Michael Covel
- TradingView Pine Script Official Documentation
---
Happy Trading! Remember to manage your risk 📈

ATR ZigZag BreakoutATR ZigZag Breakout
This strategy uses my ATR ZigZag indicator (powered by the ZigZagCore library) to scalp breakouts at volatility-filtered highs and lows.
Everyone knows stops cluster around clear swing highs and lows. Breakout traders often pile in there, too. These levels are predictable areas where aggressive orders hit the tape. The idea here is simple:
→ Let ATR ZigZag define clean, volatility-filtered pivots
→ Arm a stop market order at those pivots
→ Join the breakout when the crowd hits the level
The key to greater success in this simple strategy lies in the ZigZag. Because the pivots are filtered by ATR instead of fixed bar counts or fractals, the levels tend to be more meaningful and less noisy.
This approach is especially suited for intraday trading on volatile instruments (e.g., NQ, GC, liquid crypto pairs).
How It Works
1. Pivot detection
The ATR ZigZag uses an ATR-based threshold to confirm swing highs and lows. Only when price has moved far enough in the opposite direction does a pivot become “official.”
2. Candidate breakout level
When a new swing direction is detected and the most recent high/low has not yet been broken in the current leg, the strategy arms a stop market order at that pivot.
• Long candidate → most recent swing high
• Short candidate → most recent swing low
These “candidate trades” are shown as dotted lines.
3. Entry, SL, and TP
If price breaks through the level, the stop order is filled and a bracket is placed:
• Stop loss = ATR × SL multiplier
• Take profit = SL distance × RR multiplier
Once a level has traded, it is not reused in the same swing leg.
4. Cancel & rotate
If the market reverses and forms a new swing in the opposite direction before the level is hit, the pending order is cancelled and a new candidate is considered in the new direction.
Additional Features
• Optional session filter for backtesting specific trading hours

Indian Scalper 2025 – PSAR + SMA50 + RSI≤50 + High Volume (75%)Best 1-min / 2-min scalping strategy for NIFTY, BANKNIFTY, FINNIFTY & liquid stocks in 2025
✓ PSAR flip + SMA-50 trend filter
✓ RSI ≤50 (avoids chasing)
✓ Only high-volume candles (bright colour)
✓ Loud mobile alerts with price & SL
✓ 1:2+ RR with PSAR trailing
Works like magic 9:15–11:30 AM and 2–3:20 PM
Made with love for the Indian trading community ♥

1M XAU Cumulative Delta Volume with OB Breakouts
### Overview
This is a **session-based CVD strategy** built around the **00:00–07:00 CEST range**. It finds the high/low of that session, turns them into **adaptive ATR-based support (yellow)** and **resistance (purple)** zones, and trades only **CVD-confirmed reversals** off those levels.
---
### How it Works
* For each day, the script:
* Builds a 00:00–07:00 CEST **profile high/low**.
* Creates a **support zone** around the session low and a **resistance zone** around the session high.
* Using lower timeframe data, it reconstructs **Cumulative Volume Delta (CVD)** and a **recent delta** filter.
* It arms “pending” states when price **enters a zone from the correct side**, then confirms:
* **BUY (long):** price reclaims above support and recent CVD is strongly positive.
* **SELL (short):** price rejects below resistance and recent CVD is strongly negative.
Only these two CVD signals (`buySignal` / `sellSignal`) open trades.
---
### Strategy Logic
* **Entries**
* `buySignal` → open **long** (if flat).
* `sellSignal` → open **short** (if flat).
* No pyramiding; one position at a time.
* **Exits (only TP & SL)**
* Long: TP at `avg_price * (0.5 + TP%)`, SL at `avg_price * (1 – SL%)`.
* Short: TP at `avg_price * (0.5 – TP%)`, SL at `avg_price * (1 + SL%)`.
* No opposite-signal exits.
---
### Extras
* **Reversal markers** on yellow/purple zones and **breakout/retest markers** are plotted for context and alerts but **do not trigger entries**.
* Zone width and “thickening” are ATR-based so important touches and near-touches are easy to see.
* Only suited for **1m intraday scalping** (e.g. XAU/USD), but can be tested on other markets/timeframes.

Safe Supertrend Strategy (No Repaint)Overview
The Safe Supertrend is a repaint-free version of the popular Supertrend trend-following indicator.
Most Supertrend indicators appear perfect on historical charts because they flip intrabar and then repaint after the candle closes.
This version fixes that by using close-of-bar confirmation only, making every trend flip 100% stable, safe, and non-repainting.
Why This Supertrend Doesn’t Repaint
Most Supertrend indicators calculate their trend direction using the current bar’s data.
But during a live candle:
ATR expands and contracts
The upper/lower bands move
Price moves above/below the band temporarily
A false flip appears → then disappears when the candle closes
That is classic repainting.
This indicator avoids all of that by using:
close > upper
close < lower
This means:
Trend direction flips only based on the previous candle,
No intrabar calculations,
No flickering signals,
No “perfect but fake” historical performance.
Every signal you see on the chart is exactly what was available in real-time.
How It Works
Calculates ATR (Average True Range) and SMA centerline
Builds upper and lower volatility bands
Confirms trend flips only after the previous bar closes
Plots clear bull and bear reversal signals
Works on all markets (crypto, stocks, forex, indices)
No repainting, no recalc, no misleading flips.
Bullish Signal (Trend Up)
A bullish trend begins only when:
The previous candle closes above the upper ATR band,
And this flip is fully confirmed.
A green triangle marks the start of a new uptrend.
Bearish Signal (Trend Down)
A bearish trend begins only when:
The previous candle closes below the lower ATR band,
And the downtrend is confirmed.
A red triangle signals the start of a new downtrend.
Inputs
ATR Length - default 10
ATR Multiplier - default 3.0
Works on all timeframes and market
Simple, but powerful.
Why Use This Version Instead of a Regular Supertrend?
Most Supertrends:
Look great historically
But repaint continuously on live charts
Give false trend flips intrabar
Cannot be reliably used in strategies
This version:
Uses strict previous-bar logic
Never repaints trend direction
Works perfectly in live trading
Backtests accurately
Is ideal for algorithmic strategies
Ideal For:
Trend-following strategies
Breakout trading
Algo trading systems
Reversal detection
Filtering market noise
Swing trading & scalping
Final Note
This is a safer, more reliable Supertrend designed for real-world use — not perfect-looking repaint illusions.
If you use Supertrend in your trading system, this no-repaint version ensures your signals are trustworthy and consistent.

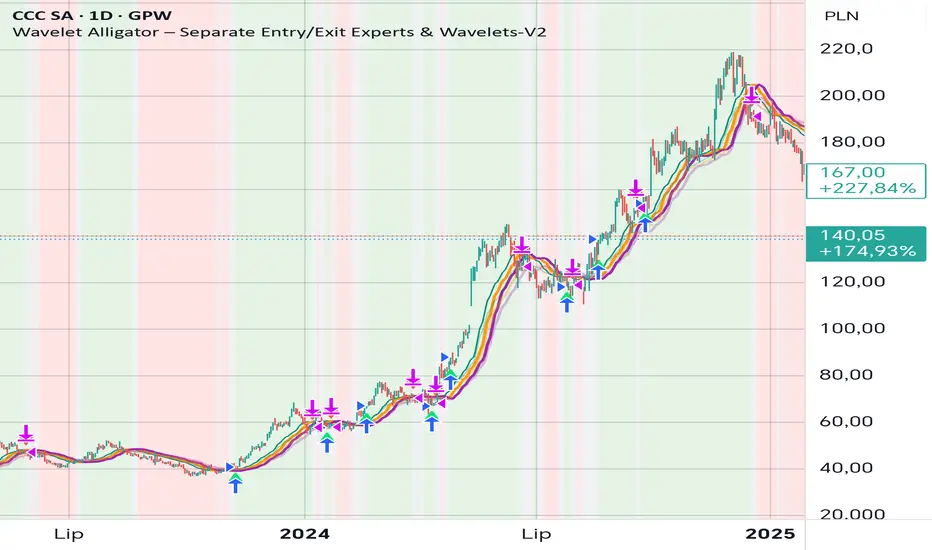
Wavelet Alligator – Separate Entry/Exit Experts & Wavelets-V2
Wavelet Alligator – Strategy Explanation & How to Use
1. Concept Overview
The Wavelet Alligator strategy combines:
- Wavelet transforms (Daubechies, Haar, Symlet, Mexican Hat, Morlet)
- Fractional calculus kernels: Caputo-Fabrizio (CF) and Atangana-Baleanu (AB)
- Three-layer “alligator-like” wavelet smoothing (soft → medium → strong)
- Expert-based entry/exit routing (RAW, CF, AB, or Majority vote)
- Independent wavelets for ENTRY and EXIT
- Main trend defined by AB wavelet ordering
This creates a multi-structure, multi-kernel trend engine capable of capturing extended moves with high signal quality.
2. Wavelet Alligator Structure
Each source (RAW, CF, AB) is transformed into three wavelet layers:
Soft = fastest reaction
Medium = mid smoothing
Strong = trend backbone
Wavelets:
- Daubechies: stable trend
- Haar: fast impulse detection
- Symlet: balanced
- Mexican Hat: curvature and reversal detection
- Morlet: cyclic, oscillatory
3. Entry Logic
Long entry occurs when:
- AB wavelet shows bullish structure (soft > medium > strong, medium rising)
- Selected entry expert approves (RAW / CF / AB / Majority)
- Wavelet condition: soft > strong AND medium crosses above strong
4. Exit Logic
Exit is independent from entry:
- Controlled by chosen exit expert
- Wavelet reversal condition: soft < strong AND medium crosses below strong
- Forced exit when AB trend turns neutral or bearish
5. Background Color (Regime)
- Green: bullish AB regime
- Red: bearish AB regime
- Gray: neutral/transition
6. How to Use
Step 1 – Choose entry wavelet
Daubechies: stable trend
Haar: breakout scalping
Mexican Hat: early reversals
Symlet: balanced
Morlet: cyclic markets
Step 2 – Choose exit wavelet
Mexican Hat: best precision
Daubechies: smooth exits
Haar: aggressive exits
Step 3 – Select entry/exit experts
CF only – fast fractional trend
AB only – stable long-memory trend
RAW only – pure price structure
Majority – safest, noise-filtered
Step 4 – Run the strategy
Entries occur only during AB bullish trend.
Exits occur on wavelet reversal or AB trend failure.
7. Why This Strategy Works
It fuses:
- Fractional calculus (memory)
- Wavelets (shape/curvature)
- Alligator ordering (trend hierarchy)
Result: high-quality entries, strong trend holding, noise-resistant signals.
Kronos Scalper (RAVINDRA KHADSE) 11.11.2025Nice — below is a ready-to-copy TradingView Pine Script (v5) strategy named “Kronos Scalper”.
It’s a self-contained scalping strategy (non-repainting) with configurable EMAs trend filter, RSI entry filter, ATR-based stop loss / take profit, optional trailing stop, plots and entry/exit labels. Drop it into TradingView’s Pine editor and Add to Chart → Strategy Tester.
