Stochastic FibonacciThis is your run-of-the-mill stochastic indicator, with one slight difference. I added Fibonacci ratios and colored them across the rainbow for aesthetics.
I noticed that the stochastic moving averages, K & D, would reverse in between 0 & 100. Just like price, they were likely Fibonacci ratios.
My original plan was to create a strategy script, and trade whenever K & D crosses the Fib levels. However, they do not cross them perfectly, rather they merely float near them and reverse. Therefore, the strategy would have never made the trades.
As you will notice in the script, there is Bitcoin Hash Rate data imported. I did so because I would like to create a stochastic hash rate indicator at some point. For those of you with this same passion, there is the hash data to mess around with; consider it an Easter Egg...
Cerca negli script per "stoch"

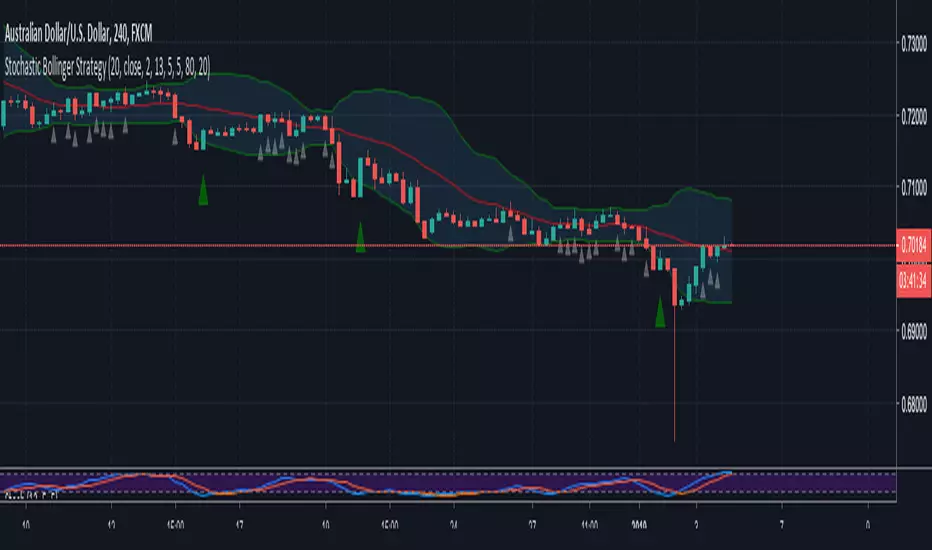
Stochastic Bollinger Strategy (Wicks)See 'Stochastic Bollinger Strategy' for details on how this works.
tips/donations are always appreciated venmo @rick-munoz

Stochastic Bollinger StrategyBollinger defaults = 20, close, 2
Stochastic defaults = 13, 5, 5
Buy Signal (GREEN triangle):
BULLISH candle formed
Candle OPEN is LESS than LOWER Bollinger Band
Stochastic (K) is LESS than 20
Sell Signal (RED triangle):
BEARISH candle formed
Candle OPEN is GREATER than UPPER Bollinger Band
Stochastic (K) is GREATER than 80
Read more about the strategy and where to set buy stops and sell stops here: swing-trading-strategies.com
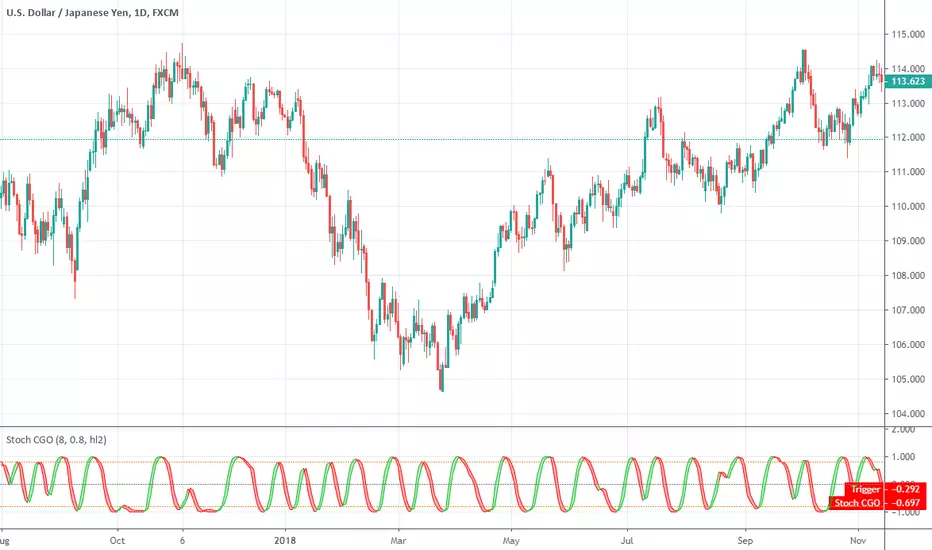
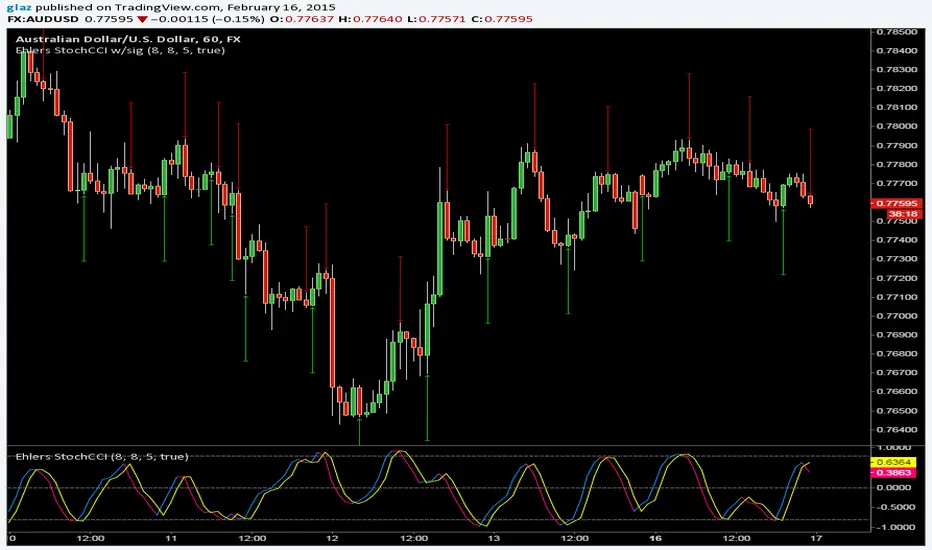
Stochastic CG Oscillator (Center of Gravity)Stochastic CG Oscillator (Center of Gravity) script.
This indicator was originally developed by John F. Ehlers (see his book `Cybernetic Analysis for Stocks and Futures`, Chapter 8: `Stochasticization and Fisherization of Indicators`).
Stochastic HistogramLast Edited: 5/19/16
Description:
This is a basic Stochastic histogram that essentially shows when the indicator
is either above or below the 50 level. Colors can be customized to your liking.
Length and smoothing factor can be adjusted as well. Defaults are 14 (Length)
and 3 (Smoothing Factor).
NOTE: The above chart contains the built-in stochastic indicator for comparison.

Stochastic In BandsWhat about to display Stochastic Oscilator in EMA-ATR Bands? If you like the idea I would code advanced version

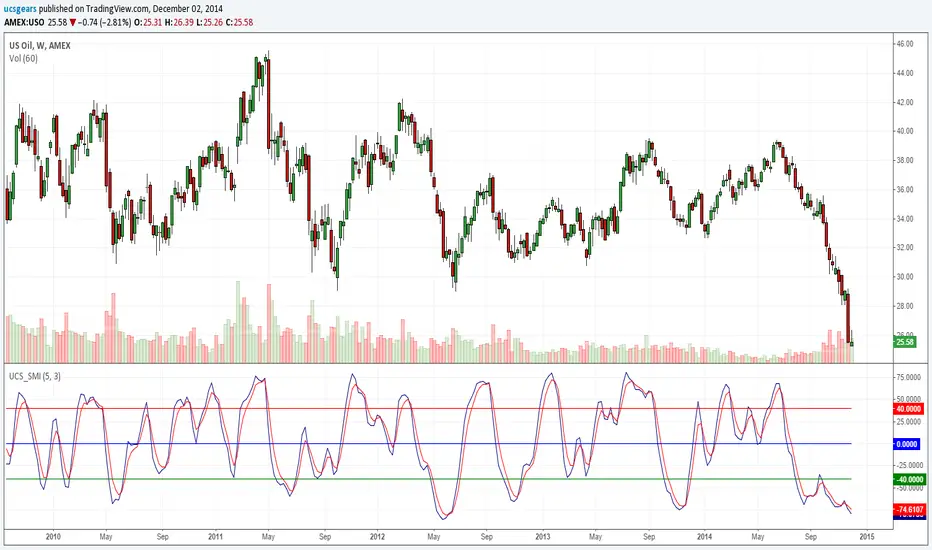
Stochastic Momentum Index _ UCSgearsThe Stochastic Momentum Index (SMI) was introduced by William Blau in 1993 as a way to clarify the traditional stochastic oscillator. SMI helps you see where the current close has taken place relative to the midpoint of the recent high to low range is based on price change in relation to the range of the price. This is a range based indicator, when used right. It can help momentum changes.
For those looking for help understanding this -
wiki.timetotrade.eu
www.tradingstrategyideas.com
tlc.thinkorswim.com
www.sierrachart.com
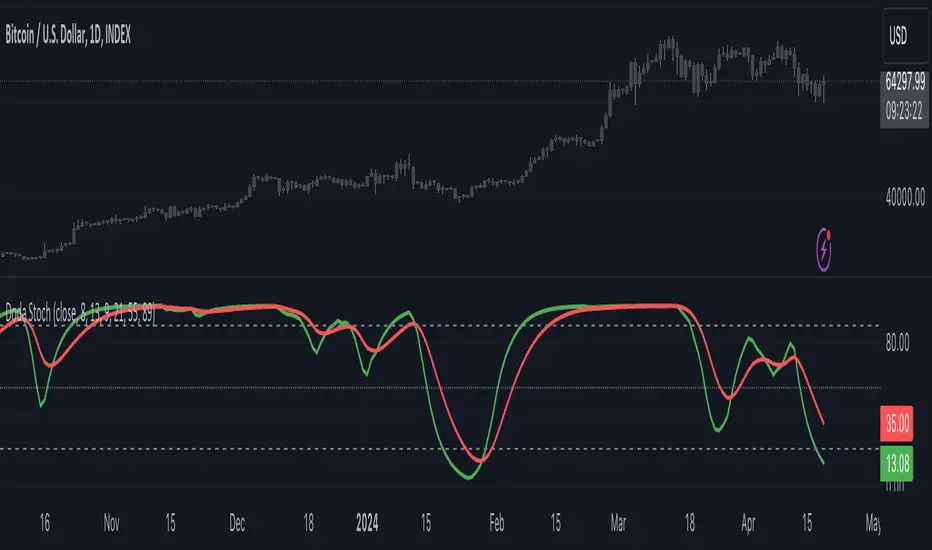
Doda StochasticThe Doda Stochastic Indicator is an oscillator designed to identify primary trends in asset price movements, operating on a scale from 0 to 100. It offers potential buying signals when it fluctuates between 0 and 20, and potential selling signals when it trends between 80 and 100. To reinforce the reliability of these signals, traders often complement them with price action indicators.
The indicator aims to display a modified version of the Stochastic Oscillator, highlighting filtered stochastic values along with related signals.
Traders often use Stochastic indicators to identify potential reversal points or overbought/oversold conditions in the market. The modified version might aim to reduce noise or improve signals compared to the standard Stochastic oscillator. Adjusting the input parameters can alter the sensitivity of the indicator to market movements.
It can also be used to identify trend by considering Doda Stochatic's Moving Average crossing the midline level. If it is above it is uptrend and if below midline then it is downtrend. It does not repaint. It is a lagging indicator because it heavily depends on Moving Averages.
What makes the Doda Stochastic Indicator unique is its attempt to eliminate false or misleading signals commonly found in standard stochastic tools. Instead of relying solely on the 20 and 80 markings for overbought and oversold conditions, it uses the crossing of the green and red lines within these segments to identify signals. However, fully grasping its functionality is pivotal to maximising its utility.
The indicator strategically analyses price movements by scrutinising key price levels, market momentum, and unexpected shifts in trends. By default, it operates with a bar count of 2000 and a PDS value of 13.0, parameters that have undergone extensive testing. It's important to note that tweaking these settings might not always be necessary, as they are well-calibrated.
How to Use the Doda Stochastic Indicator:
Setting up the Indicator:
- Begin incorporating the Doda Stochastic Indicator into your trading strategy once you're confident in identifying significant support and resistance levels.
Strategy with Doda Stochastic:
- Buy Signal Criteria:
- Asset displaying an upward trend.
- Green line crossing above the red line on the indicator.
- Confirm entry with bullish candlestick patterns.
- Set stop loss below the nearest swing low.
- Set take profit at the nearest resistance zone or exit when the green line crosses below the red line.
- Implement risk management with a risk-to-reward ratio of at least 1:2.
- Sell Signal Criteria:
- Asset demonstrating a downtrend.
- Green line crossing below the red line on the indicator.
- Confirm entry with bearish candlestick patterns.
- Set stop loss above the nearest swing high.
- Set take profit at the nearest support zone or exit when the green line crosses above the red line.
- Implement risk management with a risk-to-reward ratio of at least 1:2.
Advantages and Disadvantages:
Pros:
- Analyses crucial price levels, market momentum, and unexpected trend changes.
- Identifies overbought and oversold levels.
Cons:
- Overbought and oversold levels may not always lead to immediate price reversals.
- Signals might occasionally misinterpret a trend reversal as a correction, and vice versa.
The strength of the indicator lies in its intricate approach to price analysis and its effort to minimize false signals. However, traders should exercise caution and consider supplementary confirmation signals for more robust trade decisions.
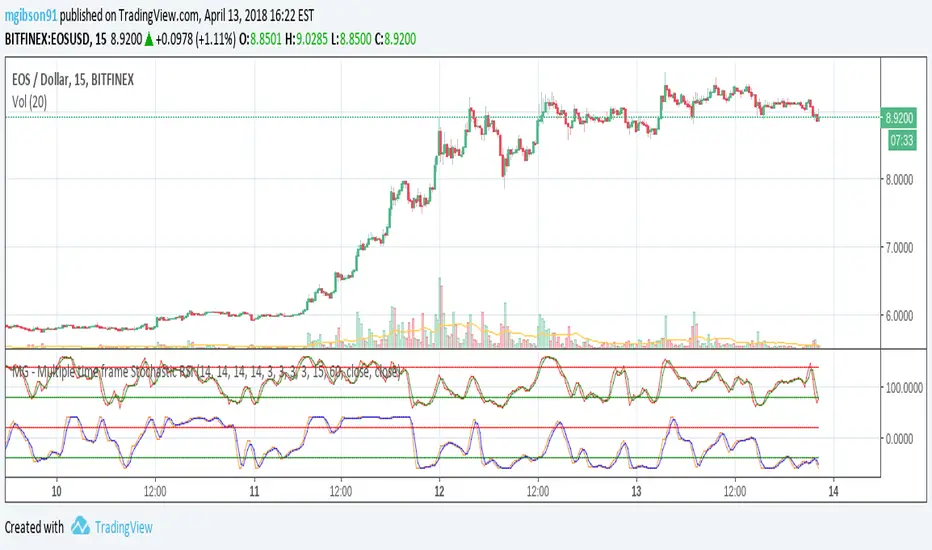
MG - Multiple time frame Stochastic RSIAllows user to view stochastic RSI from two different time frames.
Each stochastic RSI indicator is fully customizable, offering the following options:
- Timeframe
- RSI source
- RSI length
- Stochastic length
- Stochastic average length
- Stochastic smoothing length
Usage:
Comparing stochastic RSI across two different time frames can sharpen trades. For example, if you configure a 60 min and 5/15 min stochastic RSI pair, you might enter a long trade when the 60 min stoch RSI crosses up and exit / take profit when the 5 min stock RSI crosses down.

Sniper Stochastics Sniper Stochastics is a triple stochastic system.
Basically, watch the 20 and 80 crossovers. However, the settings of the three stochastics correspond to Fibonacci numbers 55, 89, and 144.
Since we have a fast, medium and slow speed stochastics; we can also watch the crossovers.
I have found that When the Red (144) is on top, it usually signals a turn upwards; conversely, a blue (89) on top of the others means that the market is going to go down.
So red on top = bullish and blue on top= bearish.
You can also think of them in terms of efficiency. If they all display the same and are overlapping in a single line; crossing an 80 or 20 line, this is a strong signal - bullish or bearish.
If on the other hand, you see them splayed out and moving away from eachother but the same direction; it signals a more inefficient process and thus a weaker signal.
I really enjoy using these and I hope you will too.
On the settings, I have turned off the %D so that they display only %K's. The Default is 55, 89 ,144.

Stochastic XThe "Stochastic X" script is a customizable momentum oscillator designed to help traders identify potential overbought and oversold conditions, as well as trend reversals, by analyzing the relationship between a security's closing price and its price range over a specified period. This indicator is particularly useful for traders looking to fine-tune their entry and exit points based on momentum shifts.
🔧 Indicator Settings and Customization
The script offers several user-configurable settings to tailor the indicator to specific trading strategies:
In addition to the source type, %K Period, %D Period, and Signal line periods you can now change moving average calculation for the stochastic and signal lines.
This script allows selection among various moving average methods (e.g., SMA, EMA, WMA, T3) for smoothing the %K and signal lines. Different methods can affect the responsiveness of the indicator.
🎨 Interpreting Background Colors
The script enhances visual analysis by changing the background color of the indicator panel based on the %K line's value:
Green Background: Indicates that the %K line is above 50, suggesting bullish momentum.
Red Background: Signifies that the %K line is below 50, pointing to bearish momentum.
Light Green Overlay: Appears when the %K line exceeds 80, highlighting overbought conditions.
Light Red Overlay: Shows up when the %K line falls below 20, indicating oversold conditions.
These visual cues assist traders in quickly assessing market momentum and potential reversal.
📈 Trading Strategies Using Stochastic X
Traders can utilize the Stochastic X indicator in various ways:
Overbought/Oversold Conditions:
A %K value above 80 may suggest that the asset is overbought, potentially signaling a price correction.
A %K value below 20 could indicate that the asset is oversold, possibly leading to a price rebound.
Signal Line Crossovers:
When the %K line crosses above the signal line, it may be interpreted as a bullish signal.
Conversely, a %K line crossing below the signal line might be seen as a bearish signal.
Divergence Analysis:
If the price makes a new high while the %K line does not, this bearish divergence could precede a price decline.
If the price hits a new low but the %K line forms a higher low, this bullish divergence might signal an upcoming price increase.
Trend Confirmation:
Sustained %K values above 50 can confirm an uptrend.
Persistent %K values below 50 may validate a downtrend.
In this chart, observe how the background colors change in response to the %K line's value, providing immediate visual feedback on market conditions. The crossovers between the %K and signal lines offer potential entry and exit points, while the overbought and oversold overlays help identify possible reversal zones.
⚙️ Adjusting Settings for Optimal Use
The Stochastic X indicator's flexibility allows traders to adjust settings to match their trading style and the specific asset's behavior:
Short-Term Trading: Use shorter periods (e.g., 5 for %K) and more responsive moving averages (e.g., WMA, VWMA, EMA, DEMA, TEMA, HMA) to capture quick market movements.
Long-Term Trading: Opt for longer periods (e.g., 14 for %K) and smoother moving averages (e.g., SMA, RMA, T3) to filter out noise and focus on broader trends.
Volatile Markets: Consider using the T3 moving average for its smoothing capabilities, helping to reduce false signals in choppy markets.
By experimenting with different settings, traders can fine-tune the indicator to better suit their analysis and improve decision-making.

Avg Stoch-RSIThis is a Stochastic RSI measurement that averages four different RSI lengths in order to catch short length as well as longer length trends. The lengths are intentionally chosen to give you periods between 1 to 4 days on the 1hr and proportionally further back by increased period.


MTI Stochastic RSI with Color Bars and ZonesPlots the %D line of a Stochastic Oscillator calculated from the RSI of close of length 14.
Red Sell Zone above 80, candles paint red
Green Buy Zone below 20, candles paint green

quad Stoch'sIt's like a Stochastic Oscillator, but there are four of them. Wait for all four to show overbought or oversold and then enter once the fastest moving oscillator breaks out
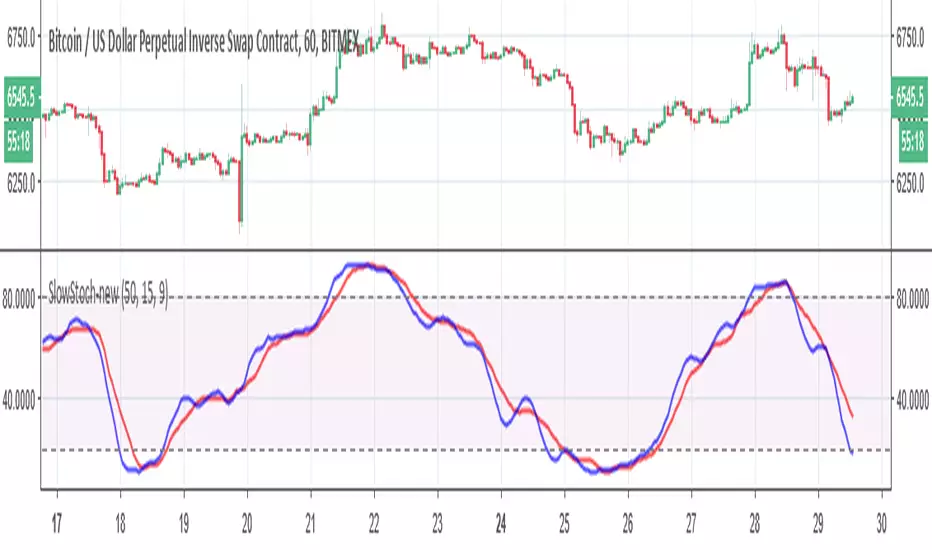
Slow Stochastic-newnothing fancy here, just some modification to the old stoch to make it more realistic
Classical Stochastic OscillatorI guess the build in STOCH indicator has some problem, it shows totally different compare to other software like MT4, so I create this one with the original definition, enjoy it!

MTF Stochastic, A versionHey everybody,
Here is a version of a MTF Stochastic script I wrote a while ago. The code is based on a formula written by Peter_O and the built in Tradingview Stochastic indicator. See this link to the original script of Peter_O. I use this formula a lot if I want to build in a Stochastic trend filter in my strategies. In this version I added options to plot different signals and trends.

Upgraded Stochastic by YenJust an enhanced version of stochastic which added with special symbol whenever K and D line crossing up or down.
Background color is green whenever K line is above middle level 50 and red when below middle level 50.
You may also turn on the histogram in settings.

StochasticUser request. A tuned version of the built-in Stochastic indicator with the following options included:
K-D Histogram
K/D Crossovers
K/D Ribbon
Bands breakouts highlighting
Middle line crossovers background
