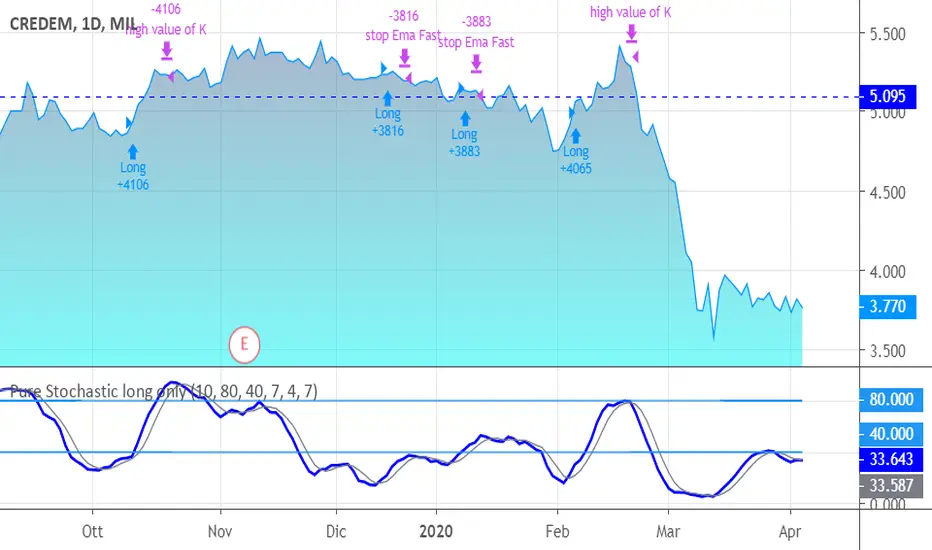
Pure Stochastic long onlyJust a stochastic for giving you a smart and quick signals of entering and exiting.
Your enter is K>D in the low band and close > last bar's high.
An Ema has been added for targeting and stops.
You exit also in case of high values of K or in case D crosses over K but in the "upper".
Length, periods and level of bands are personalized.
The system goes long only, because it fits at best for shares only; I leave you the attemp of writing code for other classes and for going short, in particular.
SUGGESTIONS:
Keep Oversold period high (> 20, also 40-45)
Keep Emaperiodfast higher (> 5)
Cerca negli script per "stoch"
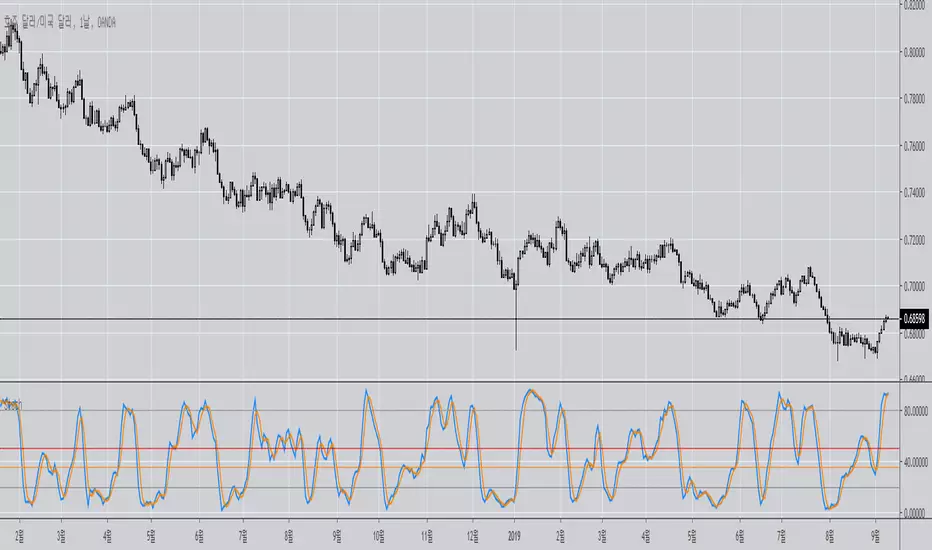
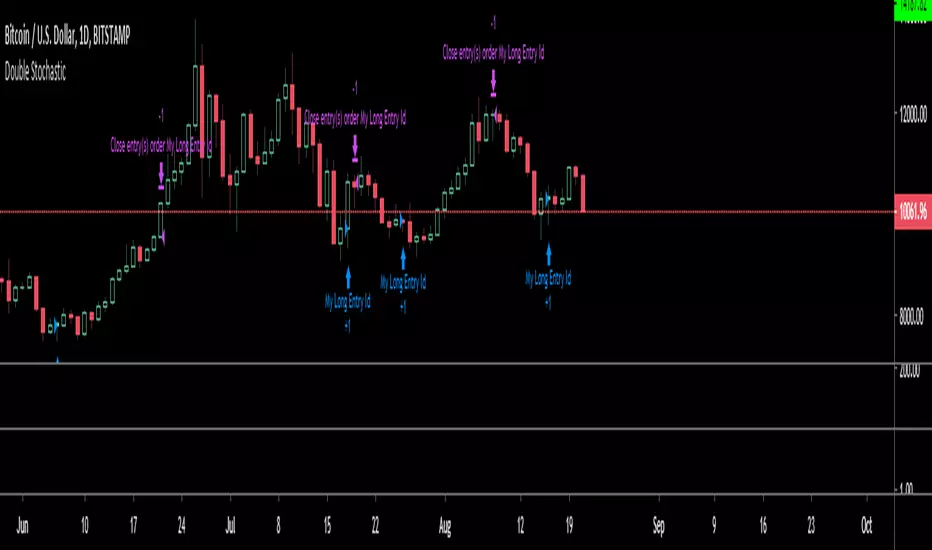
Double StochasticUses two sets of stochastic's to find bull/bear conditions tested on BTC daily and Gold etf weekly charts
Double Stochastic Multi-TimeframeI personalized a double stochastic oscillator.
HOW IS IT USED ?
Everyone should adapt the parameters to its way of trading.
First you must have a confirmation of the trend.
In positive trend, a double stochastic > 20 can be used t enter long.
In negative trend, a double stochastic < 80 can be used t enter long.
Of course this is only one possibility that everyone should adapt.
I added the possibility to add on the chart a 2nd timeframe for confirmation.
If you found this script useful, a tip is always welcome... :)


MultiTime Stochastics ProMultiTime Stochastics Pro
This indicator is an enhanced version of the stochastic indicator, featuring two separate stochastics. This functionality allows you to adjust the settings and time frame for each stochastic individually, enabling a more precise analysis of market fluctuations.
The Double Stochastic indicator enables you to simultaneously analyze the market in different time frames with two separate stochastics. One of the standout features of this indicator is that when the chart's time frame changes, each stochastic is displayed according to the time set for it and does not change in other time frames. This feature provides greater flexibility and accuracy in market analysis.
How the Indicator Works
This indicator calculates two separate stochastics:
The first stochastic (K1 and D1) with its own specific time frame and settings.
The second stochastic (K2 and D2) with a different time frame and settings.
These two stochastics are displayed simultaneously on one chart, and overbought and oversold lines are also included.
How to Use
Parameter Adjustment : Adjust the parameters K1 Length, D1 Smoothing, and K1 Time Frame as desired. Do the same for the second stochastic.
Signal Analysis : Analyze buy and sell signals based on the stochastic values and the overbought and oversold lines.
Advantages
Greater Precision : With two separate stochastics, you can follow market fluctuations with greater accuracy.
Flexibility : The ability to individually set the time frame and parameters for each stochastic makes this indicator highly flexible.
Stronger Signals : The simultaneous display of two stochastics allows you to receive stronger buy and sell signals.
Multi-time frame Analysis : The ability to analyze the market in different time frames simultaneously.
This indicator is suitable for traders seeking more precise and flexible market analysis tools. I hope these explanations help you publish your indicator in the best possible way!

Dual Stochastic Enhanced (with Presets giua64)Script Title: Dual Stochastic Enhanced (with Presets giua64)
Overview:
This indicator enhances the traditional Dual Stochastic strategy, aiming to provide more filtered and potentially reliable trading signals. By integrating dynamic overbought/oversold levels via Bollinger Bands on the slow stochastic, a trend filter based on a moving average, momentum confirmation via RSI, and user-friendly selectable presets, "Dual Stochastic Enhanced" seeks to offer a more robust approach to identifying potential entry points.
Key Features:
Dual Stochastics: Utilizes a slow stochastic (configurable, e.g., 14 periods) as a context filter and a fast stochastic (configurable, e.g., 5 periods) as a signal trigger.
Bollinger Bands on Slow Stochastic: Instead of fixed overbought/oversold levels (80/20), Bollinger Bands are applied to the %K line of the slow stochastic. This creates dynamic zones that adapt to the stochastic's own volatility.
Trend Filter: A moving average (configurable type and length, e.g., EMA 100 as seen in the example chart for general context) on the price helps filter signals, allowing only trades aligned with the prevailing trend.
RSI Confirmation: An RSI oscillator (configurable length, e.g., 14 periods) is used to confirm momentum. Signals require the RSI to cross certain thresholds to validate the strength of the move.
User Presets: Includes presets for "Scalping," "Intraday," and "Swing trading," which quickly set all key parameters to suit different styles and timeframes. A "Custom" option is also available for full manual configuration.
Clear Visual Signals: Long (green) and Short (red) arrows appear on the chart when all entry conditions are met.
Active Zone Highlighting: The background of the indicator panel changes color (green or red) when "active zone" conditions (a combination of stochastics, trend, and RSI) are favorable.
Information Panel: A table in the top-right corner of the indicator panel displays the current status of the selected preset, trend filter, RSI value, and stochastic levels.
Signal Logic:
A LONG signal is generated when:
The fast stochastic %K crosses above its %D line.
The slow stochastic %K line is below its lower Bollinger Band (dynamic oversold condition).
The fast stochastic %K line is also in a low area (e.g., <25) to confirm the trigger is not premature.
The closing price is above the trend moving average (uptrend).
The RSI is above its long confirmation level (e.g., >40), indicating sufficient bullish momentum.
A SHORT signal is generated when:
The fast stochastic %K crosses below its %D line.
The slow stochastic %K line is above its upper Bollinger Band (dynamic overbought condition).
The fast stochastic %K line is also in a high area (e.g., >75).
The closing price is below the trend moving average (downtrend).
The RSI is below its short confirmation level (e.g., <60), indicating sufficient bearish momentum.
How to Use:
Select a Preset suitable for your trading style and the timeframe you are analyzing (e.g., Scalping for M1-M15, Intraday for M5-H1, Swing for H4-D1).
Alternatively, choose "Custom" and manually adjust all parameters (stochastic lengths, smoothing, Bollinger Bands, Moving Average, RSI, confirmation thresholds).
Observe the Information Panel for a quick understanding of the current conditions.
Evaluate the arrow signals, always considering the broader market context, price action, and any other confluences (supports/resistances, chart patterns).
The background highlighting can help quickly identify periods where conditions are aligned for potential trades.
Disclaimer:
This script is provided for educational and informational purposes only. Trading involves significant risk, and past performance is not indicative of future results. Always thoroughly test any strategy or indicator on historical data and on a demo account before risking real capital. The author assumes no responsibility for any losses incurred from the use of this script.
Author: giua64

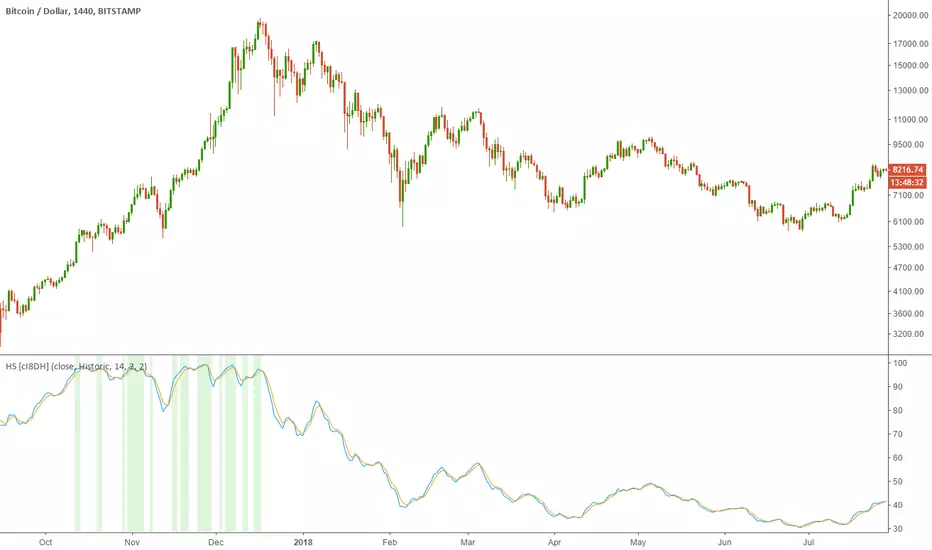
Historical Stochatic (HS) [cI8DH]This indicator calculates historical stochastic (HS). It also includes the standard stoch. HS works similar to the standard stochastic . The difference is that the standard stochastic has a set look-back period, while HS looks as far back as the first bar. This allows identifying ATHs and ATLs (background highlights green and red respectively). Basically, HS shows inverse retracement from ATL to ATH in percentage.
This indicator works best on non-range bound indicators such as MACD. As you can see in the chart below, MACD is not useful to compare against periods that price is wildly different. Applying HS on MACD fixes this issue (To achieve the same results, add MACD indicator > change the source to MACD on HS settings > since MACD is a smoothed indicator, smoothing length is set to 1. To get similar smoothing length on the signal as in standard MACD, set %D to 5 smoothed MA which is equivalent to 9 EMA smoothing on standard MACD).
Gain/Loss Moving Average (GLMA) is another indicator that can benefit well from HS. GLMA is the simplest and probably the most accurate momentum indicator. But it is not as convenient as RSI since it is not range bound. HS can make it range bound without compromising its accuracy. (To achieve the same results, add GLMA indicator > change the source to GLMA on HS settings > set %K length to 1).
Chart below shows HS applied to Accumulation/Distribution Money Flow (ADMF) and compares it against its range bound counter part, ADP.
Conclusion:
There are different ways of making an indicator normalized or range bound. Some indicators use RSI's approach (positive changes MA / all changes MA) such as MFI, CMF, ADP. This approach is great but the divergence near extremes can sometimes be misleading. HS fixes this problem as long as the indicator is not making a new ATH or ATL . When it does make new ATH or ATL , this indicator gives a warning to avoid using it for detecting divergence.
PS:
It is a bit geeky to apply HS on other indicators. I will publish some of my indicators with HS and standard stoch built-in. So stay tuned if u r interested in this indicator.
Read more here about using stochastic
www.tradingview.com(STOCH)
Three StochRSI ComboThree StochRSI with adjustable lengths in one indicator, with no extra bells or whistles. Lazybear's Apirine Slow RSI is used for the RSI formula for the third Stoch.
14-period StochRSI (red) is considered short term.
20-period StochRSI is another short to mid term preset I've seen used in various indicators on different platforms by default, and is included as the yellow stochRSI.
Lazybear's Apirine Slow RSI is used as the base for the third, slower stoch - parameter input adjustment for your specific timeframe and instrument is recommended. The Apirine Slow RSI doesn't have as effective strong divergences during established trends, so the way it would react in when run through a stoch should be more synergistic than not during trending periods for longer term trends.
StochRSI:
StochRSI measures the value of RSI relative to its high/low range over a set number of periods - It's important to note that StochRSI is technically an indicator of an indicator (RSI), which makes it the second derivative of price. This is part of the main contributing factors to how it looks and functions in relation to price.
A move above 80 ---> considered overbought.
A move below 20 ---> considered oversold.
Moves around the midline (50) can also be interpreted as continuation of upward/downwards trend depending on whether the midline is acting more of as a support (uptrend) or a resistance level (downtrend).
Stoch K-line disabled by default/D-line enabled by default.
Stoch K/D lengths are set to 3/3/14/14 (red), 6/6/20/20 (yellow), 12/12 (green) by default.
Midline (50) set to white/silver to make more visible on darkmode charts.
Additional adjustable levels for Overbought/Oversold beyond 20/80 (set at 10/90 by default - see dashed grey line. Dotted line is 20/80.)
Three stochRSI with 3/3/14/14, 6/6/20/20, and 12/12/14/14/6 length are shown below the indicator for reference.
Acknowledgements:
// Aprine Slow RSI - Lazybear
//
// Stockcharts for StochRSI reference
// school.stockcharts.com
Medium Term Weighted Stochastic (STPMT) by DGTLa Stochastique Pondérée Moyen Terme (STPMT) , or Mᴇᴅɪᴜᴍ Tᴇʀᴍ Wᴇɪɢʜᴛᴇᴅ Sᴛᴏᴄʜᴀꜱᴛɪᴄꜱ created by Eric Lefort in 1999, a French trader and author of trading books
█ The STPMT indicator is a tool which concerns itself with both the direction and the timing of the market. The STPMT indicator helps the trader with:
The general trend by observing the level around which the indicator oscillates
The changes of direction in the market
The timing to open or close a position by observing the oscillations and by observing the relative position of the STPMT versus its moving average
STPMT Calculation
stpmt = (4,1 * stoch(5, 3) + 2,5 * stoch(14, 3) + stoch(45, 14) + 4 * stoch(75, 20)) / 11.6
Where the first argument of the stoch function representation above is period (length) of K and second argument smoothing period of K. The result series is then plotted as red line and its moving average as blue line. By default disabled gray lines are the components of the STPMT
The oscillations of the STPMT around its moving average define the timing to open a position as crossing of STMP line and moving average line in case when both trends have same direction. The moving average determines the direction.
Long examples
█ Tʜᴇ CYCLE Iɴᴅɪᴄᴀᴛᴏʀ is derived from the STPMT. It is
cycle = stpmt – stpmt moving average
It is indicates more clearly all buy and sell opportunities. On the other hand it does not give any information on market direction. The Cycle indicator is a great help in timing as it allows the trader to more easily see the median length of an oscillation around the average point. In this way the traders can simply use the time axis to identify both a favorable price and a favorable moment. The Cycle Indicator is presented as histogram
The Lefort indicators are not a trading strategy. They are tools for different purposes which can be combined and which can serve for trading all instruments (stocks, market indices, forex, commodities…) in a variety of time frames. Hence they can be used for both day trading and swing trading.
👉 For whom that would like simple version of the Cycle indicator on top of the main price chart with signals as presented below.
Please note that in the following code STMP moving average direction is not considered and will plot signals regardless of the direction of STMP moving average. It is not a non-repainting version too.
here is pine code for the overlay version
// © dgtrd
//@version=4
study("Medium Term Weighted Stochastic (STPMT) by DGT", "STPMT ʙʏ DGT ☼☾", true, format.price, 2, resolution="")
i_maLen = input(9 , "Stoch MA Length", minval=1)
i_periodK1 = input(5 , "K1" , minval=1)
i_smoothK1 = input(3 , "Smooth K1", minval=1)
i_weightK1 = input(4.1 , "Weight K1", minval=1, step=.1)
i_periodK2 = input(14 , "K2" , minval=1)
i_smoothK2 = input(3 , "Smooth K2", minval=1)
i_weightK2 = input(2.5 , "Weight K2", minval=1, step=.1)
i_periodK3 = input(45 , "K3" , minval=1)
i_smoothK3 = input(14 , "Smooth K3", minval=1)
i_weightK3 = input(1. , "Weight K3", minval=1, step=.1)
i_periodK4 = input(75 , "K4" , minval=1)
i_smoothK4 = input(20 , "Smooth K4", minval=1)
i_weightK4 = input(4. , "Weight K4", minval=1, step=.1)
i_data = input(false, "Components of the STPMT")
//------------------------------------------------------------------------------
// stochastic function
f_stoch(_periodK, _smoothK) => sma(stoch(close, high, low, _periodK), _smoothK)
//------------------------------------------------------------------------------
// calculations
// La Stochastique Pondérée Moyen Terme (STPMT) or Medium Term Weighted Stochastics calculation
stpmt = (i_weightK1 * f_stoch(i_periodK1, i_smoothK1) + i_weightK2 * f_stoch(i_periodK2, i_smoothK2) + i_weightK3 * f_stoch(i_periodK3, i_smoothK3) + i_weightK4 * f_stoch(i_periodK4, i_smoothK4)) / (i_weightK1 + i_weightK2 + i_weightK3 + i_weightK4)
stpmt_ma = sma(stpmt, i_maLen) // STPMT Moving Average
cycle = stpmt - stpmt_ma // Cycle Indicator
//------------------------------------------------------------------------------
// plotting
plotarrow(change(sign(cycle)), "STPMT Signals", color.green, color.red, 0, maxheight=41)
alertcondition(cross(cycle, 0), title="Trading Opportunity", message="STPMT Cycle : Probable Trade Opportunity\n{{exchange}}:{{ticker}}->\nPrice = {{close}},\nTime = {{time}}")

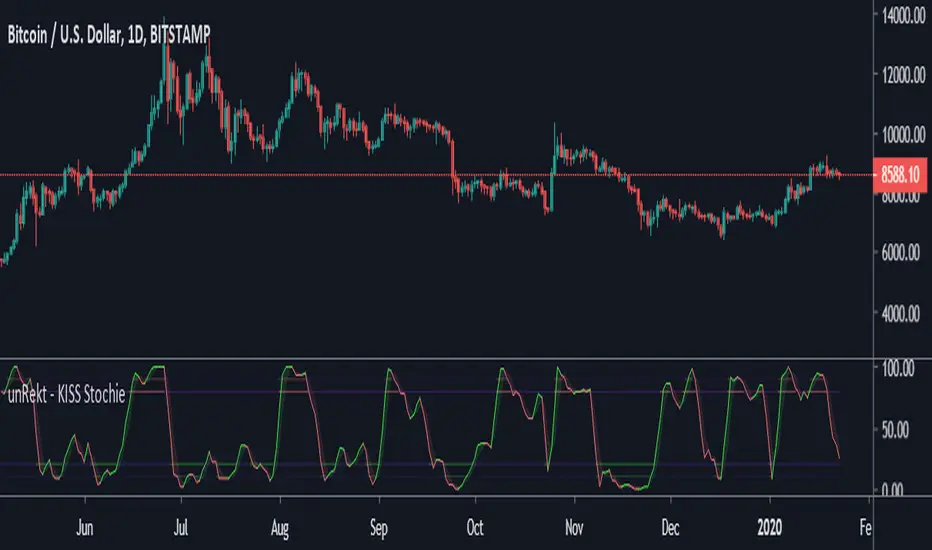
unRekt - KISS StochieStochie is the StochRSI indicator and is part of the ''keeping it simple' series that have a similar color scheme. The Stochastic RSI technical indicator applies the Stochastic Oscillator to values of the Relative Strength Index (RSI). The indicator thus produces two main plots FullK and FullD oscillating between oversold and overbought levels. The StochRSI can also be used to detect divergence and trend.
"The Stocashi" - Stochastic RSI + Heikin-AshiWhat up guys and welcome to the coffee shop. I have a special little tool for you today to throw in your toolbox. This one is a freebie.
This is the Stochastic RS-Heiken-Ashi "The Stocashi"
This is the stochastic RSI built to look like Heikin-Ashi candles.
a lot of people have trouble using the stochastic indicator because of its ability to look very choppy at its edges instead of having nice curves or arcs to its form when you use it on scalping time frames it ends up being very pointed and you can't really tell when the bands turn over if you're using a stochastic Ribbon or you can't tell when it's actually moving in a particular direction if you're just using the K and the D line.
This new format of Presentation seeks to get you to have a better visual representation of what the stochastic is actually doing.
It's long been noted that Heikin-Ashi do a very good job of representing momentum in a price so using it on something that is erratic as the stochastic indicator seems like a plausible idea.
The strategy is simple because you use it exactly the same way you've always used the stochastic indicator except now you can look for the full color of the candle.
this one uses a gradient color setup for the candle so when the candle is fully red then you have a confirmed downtrend and when the candle is fully green you have a confirmed up trend of the stochastic however if, you a combination of the two colors inside of one candle then you do not have a confirmed direction of the stochastic.
the strategy is simple for the stochastic and that you need to know your overall trend. if you are in an uptrend you are waiting for the stochastic to reach bottom and start curving up.
if you are in a downtrend you are waiting for the stochastic to reach its top or its peak and curve down.
In an uptrend you want to make sure that the stochastic is making consistently higher lows just like price should be. if at any moment it makes a lower low then you know you have a problem with your Trend and you should consider exiting.
The opposite is true for a downtrend. In a downtrend you want to make sure you have lower highs. if at any given moment you end up with a higher high than you know you have a problem with your Trend and it's probably ending so you should consider exiting.
The stochastic indicator done as he can actually candles also does a very good job of telling you when there is a change of character. In that moment when the change of character shows up you simply wait until your trend and your price start to match up.
You can also use the stochastic indicator in this format to find divergences the same way you would on the relative strength index against your price highs and price lows so Divergence trading is visually a little bit easier with this tool.
The settings for the K percent D percent RSI length and stochastic length can be adjusted at will so be sure to study the history of the stochastic and find the good settings for your trading strategy.

Stochastic [Tcs] | OSCThis script is an implementation of the stochastic relative strength index (STOCH RSI) indicator
The script takes inputs from the length of the RSI, the source of the data, and parameters for the smoothing of the STOCH RSI.
The STOCH RSI is calculated by first calculating the RSI of the chosen source data, then smoothing it with an exponential moving average. The stochastic oscillator is then applied to the smoothed RSI, and smoothed again to create the final STOCH RSI.
The script also calculates a trigger value using a combination of the STOCH RSI and a volume-weighted moving average. It then plots the STOCH RSI, trigger value, and overbought/oversold levels, and fills the background of the plot based on the relationship between the trigger and STOCH RSI values.
Finally, the script plots buy and sell signals based on crossovers and crossunders of the STOCH RSI and its smoothed version.
The cross signal is stronger than the dots, in both direction and usually the best entries happen when two crosses signal on the level 0(long) or 100(short) appear after a dot signal.
Please note that this indicator is for educational purposes only and should not be used for trading without further testing and analysis.

Stochastic BTC OptimizedEnhanced Stochastic for Bitcoin (BTC) – Optimized for Daily Timeframe
This enhanced Stochastic oscillator is specifically fine-tuned for BTC/USD on the 1D timeframe, leveraging historical data from Bitstamp (2011–2025) to minimize false signals and maximize reliability in Bitcoin's volatile swings.
Unlike the classic Stochastic (14, 3, 3), this version uses optimized parameters:
- K Period = 21 – smoother reaction, better suited for BTC’s macro cycles
- D Period = 3, Smooth K = 3 – reduces noise while preserving responsiveness
- Overbought = 85, Oversold = 15 – accounts for BTC’s tendency to trend strongly within extreme zones without immediate reversal
✅ Smart Signal Logic:
Buy/sell signals appear only when %K crosses %D inside the oversold (≤15) or overbought (≥85) zones, and only the first signal is shown to avoid whipsaws.
Visual Enhancements:
- Thick lines when %K/%D are in overbought/oversold zones
- Green/red background highlights on valid signals
- Optional up/down arrows for clear entry visualization
- Customizable colors, line widths, and transparency
🔒 No alerts included – clean, focused on price action and momentum.
💡 Pro Tip: For even higher accuracy, use this indicator in combination with a long-term trend filter (e.g., EMA 200). The oscillator excels in ranging or retracement phases but should not be used alone in strong parabolic moves.
Based on Mozilla Public License v2.0 – feel free to use, modify, and share. Perfect for swing traders and long-term Bitcoin analysts seeking high-probability reversal zones.
перевод на русский
Улучшенный Stochastic для Bitcoin (BTC) — оптимизирован для дневного таймфрейма
Этот улучшенный осциллятор Stochastic специально настроен под BTC/USD на дневном графике, с учётом исторических данных Bitstamp (2011–2025), чтобы минимизировать ложные сигналы и повысить надёжность в условиях высокой волатильности биткоина.
В отличие от классического Stochastic (14, 3, 3), эта версия использует оптимизированные параметры:
- Период K = 21 — более плавная реакция, лучше соответствует макроциклам BTC
- Период D = 3, Сглаживание K = 3 — снижает шум, сохраняя отзывчивость
- Уровень перекупленности = 85, перепроданности = 15 — учитывает склонность BTC к сильным трендам в экстремальных зонах без немедленного разворота
✅ Интеллектуальная логика сигналов:
Покупка/продажа отображается только при пересечении %K и %D внутри зоны перепроданности (≤15) или перекупленности (≥85), и только первый сигнал фиксируется, чтобы избежать «хлыстов».
Улучшенная визуализация:
- Жирные линии, когда %K/%D находятся в экстремальных зонах
- Зелёный/красный фон при появлении сигналов
- Опциональные стрелки для чёткого отображения точек входа
- Настройка цветов, толщины линий и прозрачности
🔒 Без алертов — чистый инструмент, сфокусированный на цене и импульсе.
💡 Совет профессионала: для ещё большей точности используйте этот индикатор вместе с трендовым фильтром (например, EMA 200). Осциллятор лучше всего работает в фазах консолидации или отката, но не стоит применять его в одиночку во время сильных параболических движений.
На основе Mozilla Public License v2.0 — свободно используйте, модифицируйте и делитесь. Идеален для свинг-трейдеров и аналитиков Bitcoin, ищущих зоны с высокой вероятностью разворота.

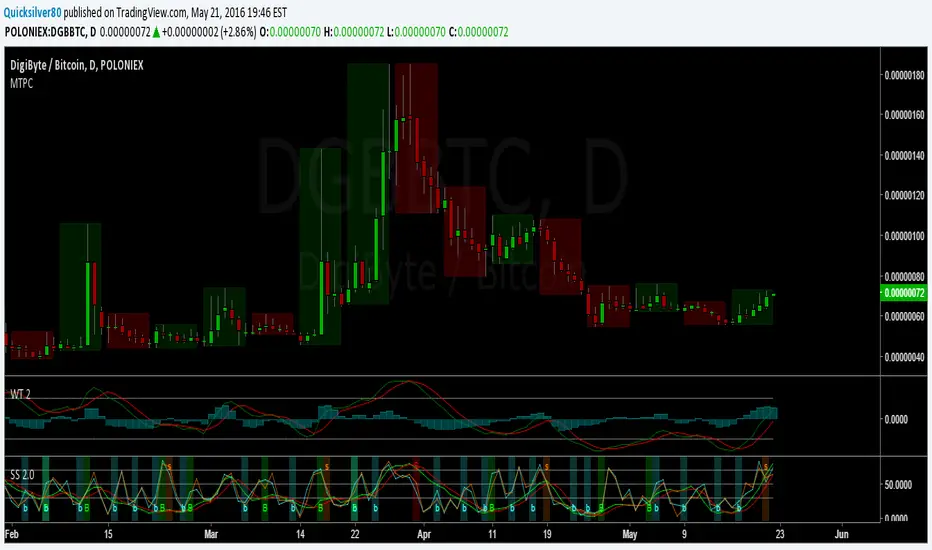
Stoch Money Flow (ADMF) & Absolute Strength Index (ASI) [cI8DH]This indicator can apply my previous indicator, Historical and Standard Stochastic, to Money Flow (ADMF) or Absolute Strength Index (ASI) or both at the same time. It can also display those two indicators in regular mode as well as showing visual cues when the indicators make new ATH or ATL.
ASI is basically a new name I am giving to my Gain/Loss Moving Average indicator. If you normalize ASI with the moving average of all the changes in price, it becomes identical to RSI. So ASI is basically non-normalized RSI, that is why it should be a more accurate representation of price momentum.
ADMF is an accumulation/distribution and money flow momentum indicator. Both ASI and ADMF are not range-bound so it is not easy to compare them against each other. When stochastic equation is applied to them, they both become range-bound and comparable. The gaps between the two indicator can reveal valuable information about market dynamics. The chart below shows some examples (note the settings).
For conventional usages of stochastic, please read www.tradingview.com(STOCH) and www.tradingview.com(STOCH_RSI). I recommend you to find the optimal length by playing with the stoch length in the indicator settings. If this parameter is calibrated properly, this indicator can be a powerful tool for identifying market cycle.
You can get these features ( ATH , ATL detection and historical stochastic) for any other indicator using the script below:

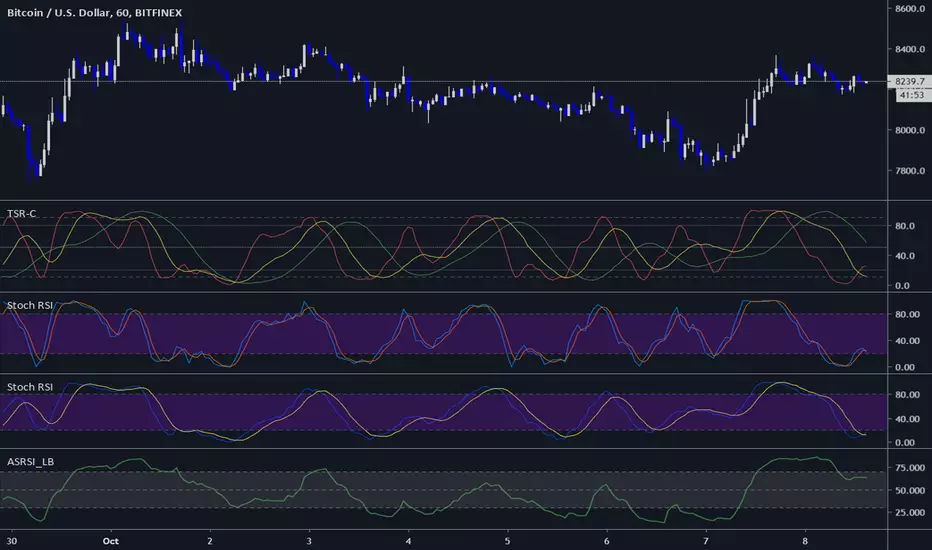
Stoch/RSI with EMA50 Cross & HHLLA hybrid but simple indicator that plots 4 strategies in one pane .
1) RSI Indicator
2) Stoch RSI
3) EMA50 Cross (To determine direction in current timeframe)
4) Higher Highs & Lower Lows to analyze the trend and break of trend
The relative strength index (RSI) is a momentum indicator used in technical analysis. It is displayed as an oscillator (a line graph) on a scale of zero to 100. When the RSI indicator crosses 30 on the RSI chart, it is a bullish sign and when it crosses 70, it is a bearish sign.
The Stochastic RSI (StochRSI) is also a momentum indicator used in technical analysis. It is displayed as an oscillator (a line graph) on a scale of zero to 100. When the StochRSI indicator crosses 20 on the RSI chart, it is a bullish sign and when it crosses 80, it is a bearish sign.
The EMA50Cross denotes two cases in the script:
a) A crossover of CMP on the EMA50 is highlighted by a green bar signals a possible bullish trend
b) A crossunder of CMP on the EMA50 is highlighted by a red bar signals a possible bearish trend
The HHLL is denoted by mneumonics HH, HL,LH, LL. A combination of HHs and HLs denotes a uptrend while the combination of LLs and LHs denoted a downtrend
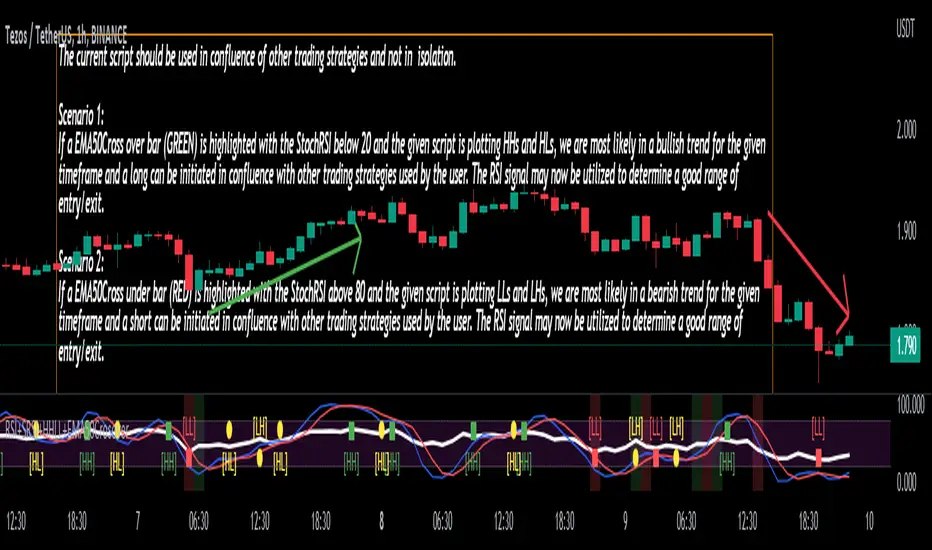
The current script should be used in confluence of other trading strategies and not in isolation.
Scenario 1:
If a EMA50Cross over bar (GREEN) is highlighted with the StochRSI below 20 and the given script is plotting HHs and HLs, we are most likely in a bullish trend for the given timeframe and a long can be initiated in confluence with other trading strategies used by the user. The RSI signal may now be utilized to determine a good range of entry/exit.
Scenario 2:
If a EMA50Cross under bar (RED) is highlighted with the StochRSI above 80 and the given script is plotting LLs and LHs, we are most likely in a bearish trend for the given timeframe and a short can be initiated in confluence with other trading strategies used by the user. The RSI signal may now be utilized to determine a good range of entry/exit.
Disclaimer:
The current script should be used in confluence with other trading strategies and not in isolation. The scripts works best on 4H and 1D Timeframes and should be used with caution on lower timeframes.
This indicator is not intended to give exact entry or exit points for a trade but to provide a general idea of the trend & determine a good range for entering or exiting the trade. Please DYOR
Credit & References:
This script uses the default technical analysis reference library provided by PineScript (denoted as ta)
Lane's Stochastics (yasujiy)This script is original Lane's Stochastics.
Default script uses SMA for %D, but this %D is calculated separately numerator and denominator.

Super StochAdded signal functionality to StochRSI 2
Set Default Resolution of StochRSI 1 to "D" and StochRSI 2 to "240"
StochFusion – Multi D-LineStochFusion – Multi D-Line
An advanced fusion of four Stochastic %D lines into one powerful oscillator.
What it does:
Combines four user-weighted Stochastic %D lines—from fastest (9,3) to slowest (60,10)—into a single “Fusion” line that captures both short-term and long-term momentum in one view.
How to use:
Adjust the four weights (0–10) to emphasize the speed of each %D component.
Watch the Fusion line crossing key zones:
– Above 80 → overbought condition, potential short entry.
– Below 20 → oversold condition, potential long entry.
– Around 50 → neutral/midline, watch for trend shifts.
Applications:
Entry/exit filter: Only take trades when the Fusion line confirms zone exits.
Trend confirmation: Analyze slope and cross of the midline for momentum strength.
Multi-timeframe alignment: Use on different chart resolutions to find confluence.
Tips & Tricks:
Default weights give more influence to slower %D—good for trend-focused strategies.
Equal weights provide a balanced oscillator that mimics an ensemble average.
Experiment: Increase the fastest weight to capture early reversal signals.
Developed by: TradeQUO — inspired by DayTraderRadio John
“The best momentum indicator is the one you adapt to your own trading rhythm.”

Stochastic Fusion Elite [trade_lexx]📈 Stochastic Fusion Elite is your reliable trading assistant!
📊 What is Stochastic Fusion Elite ?
Stochastic Fusion Elite is a trading indicator based on a stochastic oscillator. It analyzes the rate of price change and generates buy or sell signals based on various technical analysis methods.
💡 The main components of the indicator
📊 Stochastic oscillator (K and D)
Stochastic shows the position of the current price relative to the price range for a certain period. Values above 80 indicate overbought (an early sale is possible), and values below 20 indicate oversold (an early purchase is possible).
📈 Moving Averages (MA)
The indicator uses 10 different types of moving averages to smooth stochastic lines.:
- SMA: Simple moving average
- EMA: Exponential moving average
- WMA: Weighted moving average
- HMA: Moving Average Scale
- KAMA: Kaufman Adaptive Moving Average
- VWMA: Volume-weighted moving average
- ALMA: Arnaud Legoux Moving Average
- TEMA: Triple exponential moving average
- ZLEMA: zero delay exponential moving average
- DEMA: Double exponential moving average
The choice of the type of moving average affects the speed of the indicator's response to market changes.
🎯 Bollinger Bands (BB)
Bands around the moving average that widen and narrow depending on volatility. They help determine when the stochastic is out of the normal range.
🔄 Divergences
Divergences show discrepancies between price and stochastic:
- Bullish divergence: price is falling and stochastic is rising — an upward reversal is possible
- Bearish divergence: the price is rising, and stochastic is falling — a downward reversal is possible
🔍 Indicator signals
1️⃣ KD signals (K and D stochastic lines)
- Buy signal:
- What happens: the %K line crosses the %D line from bottom to top
- What does it look like: a green triangle with the label "KD" under the chart and the label "Buy" below the bar
- What does this mean: the price is gaining an upward momentum, growth is possible
- Sell signal:
- What happens: the %K line crosses the %D line from top to bottom
- What it looks like: a red triangle with the label "KD" above the chart and the label "Sell" above the bar
- What does this mean: the price is losing its upward momentum, possibly falling
2️⃣ Moving Average Signals (MA)
- Buy Signal:
- What happens: stochastic crosses the moving average from bottom to top
- What it looks like: a green triangle with the label "MA" under the chart and the label "Buy" below the bar
- What does this mean: stochastic is starting to accelerate upward, price growth is possible
- Sell signal:
- What happens: stochastic crosses the moving average from top to bottom
- What it looks like: a red triangle with the label "MA" above the chart and the label "Sell" above the bar
- What does this mean: stochastic is starting to accelerate downwards, a price drop is possible
3️⃣ Bollinger Band Signals (BB)
- Buy signal:
- What happens: stochastic crosses the lower Bollinger band from bottom to top
- What it looks like: a green triangle with the label "BB" under the chart and the label "Buy" below the bar
- What does this mean: stochastic was too low and is now starting to recover
- Sell signal:
- What happens: Stochastic crosses the upper Bollinger band from top to bottom
- What it looks like: a red triangle with a "BB" label above the chart and a "Sell" label above the bar
- What does this mean: stochastic was too high and is now starting to decline
4️⃣ Divergence Signals (Div)
- Buy Signal (Bullish Divergence):
- What's happening: the price is falling, and stochastic is forming higher lows
- What it looks like: a green triangle with a "Div" label under the chart and a "Buy" label below the bar
- What does this mean: despite the falling price, the momentum is already changing in an upward direction
- Sell signal (bearish divergence):
- What's going on: the price is rising, and stochastic is forming lower highs
- What it looks like: a red triangle with a "Div" label above the chart and a "Sell" label above the bar
- What does this mean: despite the price increase, the momentum is already weakening
🛠️ Filters to filter out false signals
1️⃣ Minimum distance between the signals
- What it does: sets the minimum number of candles between signals
- Why it is needed: prevents signals from being too frequent during strong market fluctuations
- How to set it up: Set the number from 0 and above (default: 5)
2️⃣ "Waiting for the opposite signal" mode
- What it does: waits for a signal in the opposite direction before generating a new signal
- Why you need it: it helps you not to miss important trend reversals
- How to set up: just turn the function on or off
3️⃣ Filter by stochastic levels
- What it does: generates signals only when the stochastic is in the specified ranges
- Why it is needed: it helps to catch the moments when the market is oversold or overbought
- How to set up:
- For buy signals: set a range for oversold (for example, 1-20)
- For sell signals: set a range for overbought (for example, 80-100)
4️⃣ MFI filter
- What it does: additionally checks the values of the cash flow index (MFI)
- Why it is needed: confirms stochastic signals with cash flow data
- How to set it up:
- For buy signals: set the range for oversold MFI (for example, 1-25)
- For sell signals: set the range for overbought MFI (for example, 75-100)
5️⃣ The RSI filter
- What it does: additionally checks the RSI values to confirm the signals
- Why it is needed: adds additional confirmation from another popular indicator
- How to set up:
- For buy signals: set the range for oversold MFI (for example, 1-30)
- For sell signals: set the range for overbought MFI (for example, 70-100)
🔄 Signal combination modes
1️⃣ Normal mode
- How it works: all signals (KD, MA, BB, Div) work independently of each other
- When to use it: for general market analysis or when learning how to work with the indicator
2️⃣ "AND" Mode ("AND Mode")
- How it works: the alarm appears only when several conditions are triggered simultaneously
- Combination options:
- KD+MA: signals from the KD and moving average lines
- KD+BB: signals from KD lines and Bollinger bands
- KD+Div: signals from the KD and divergence lines
- KD+MA+BB: three signals simultaneously
- KD+MA+Div: three signals at the same time
- KD+BB+Div: three signals at the same time
- KD+MA+BB+Div: all four signals at the same time
- When to use: for more reliable but rare signals
🔌 Connecting to trading strategies
The indicator can be connected to your trading strategies using 6 different channels.:
1. Connector KD signals: connects only the signals from the intersection of lines K and D
2. Connector MA signals: connects only signals from moving averages
3. Connector BB signal: connects only the signals from the Bollinger bands
4. Connector divergence signals: connects only divergence signals
5. Combined Connector: connects any signals
6. Connector for "And" mode: connects only combined signals
🔔 Setting up alerts
The indicator can send alerts when alarms appear.:
- Alerts for KD: when the %K line crosses the %D line
- Alerts for MA: when stochastic crosses the moving average
- Alerts for BB: when stochastic crosses the Bollinger bands
- Divergence alerts: when a divergence is detected
- Combined alerts: for all types of alarms
- Alerts for "And" mode: for combined signals
🎭 What does the indicator look like on the chart ?
- Main lines K and D: blue and orange lines
- Overbought/oversold levels: horizontal lines at levels 20 and 80
- Middle line: dotted line at level 50
- Stochastic Moving Average: yellow line
- Bollinger bands: green lines around the moving average
- Signals: green and red triangles with corresponding labels
📚 How to start using Stochastic Fusion Elite
1️⃣ Initial setup
- Add an indicator to your chart
- Select the types of signals you want to use (KD, MA, BB, Div)
- Adjust the period and smoothing for the K and D lines
2️⃣ Filter settings
- Set the distance between the signals to get rid of unnecessary noise
- Adjust stochastic, MFI and RSI levels depending on the volatility of your asset
- If you need more reliable signals, turn on the "Waiting for the opposite signal" mode.
3️⃣ Operation mode selection
- First, use the standard mode to see all possible signals.
- When you get comfortable, try the "And" mode for rarer signals.
4️⃣ Setting up Alerts
- Select the types of signals you want to be notified about
- Set up alerts for these types of signals
5️⃣ Verification and adaptation
- Check the operation of the indicator on historical data
- Adjust the parameters for a specific asset
- Adapt the settings to your trading style
🌟 Usage examples
For trend trading
- Use the KD and MA signals in the direction of the main trend
- Set the distance between the signals
- Set stricter levels for filters
For trading in a sideways range
- Use BB signals to detect bounces from the range boundaries
- Use a stochastic level filter to confirm overbought/oversold conditions
- Adjust the Bollinger bands according to the width of the range
To determine the pivot points
- Pay attention to the divergence signals
- Set the distance between the signals
- Check the MFI and RSI filters for additional confirmation

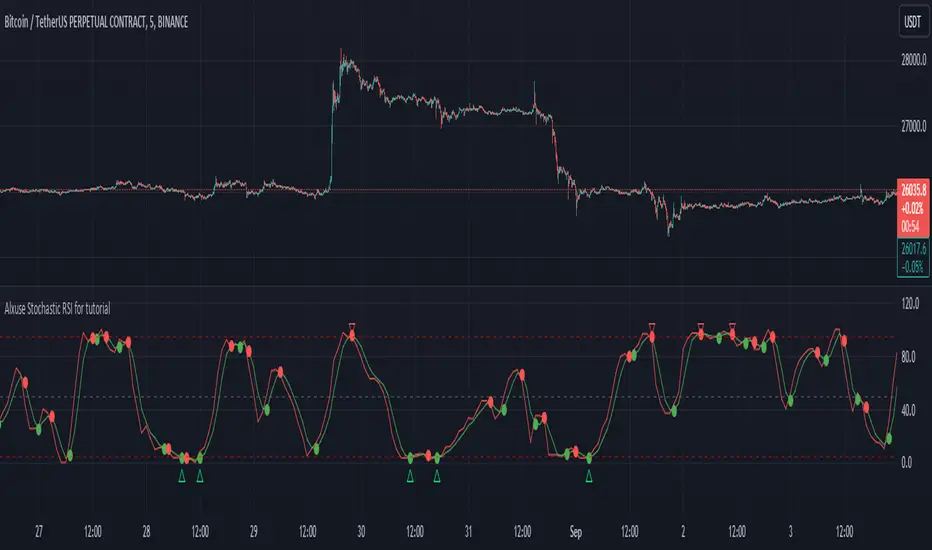
Alxuse Stochastic RSI for tutorial All abilities of Stochastic RSI, moreover :
Drawing upper band and lower band & the ability to change values, change colors, turn on/off show.
Crossing K line and D line in multi timeframe & there are symbols (Circles) with green color (Buy) and red color (Sell) & the ability to change colors, turn on/off show.
Crossing K line and D line in multi timeframe according to the values of upper band and lower band & there are symbols (Triangles) with green color (Long) and red color (Short) & the ability to change colors, turn on/off show.
The ability used in the alert section and create customized alerts.
To receive valid alerts the replay section , the timeframe of the chart must be the same as the timeframe of the indicator.
Stochastic RSI (STOCH RSI)
Definition
The Stochastic RSI indicator (Stoch RSI) is essentially an indicator of an indicator. It is used in technical analysis to provide a stochastic calculation to the RSI indicator. This means that it is a measure of RSI relative to its own high/low range over a user defined period of time. The Stochastic RSI is an oscillator that calculates a value between 0 and 1 which is then plotted as a line. This indicator is primarily used for identifying overbought and oversold conditions.
The basics
It is important to remember that the Stoch RSI is an indicator of an indicator making it two steps away from price. RSI is one step away from price and therefore a stochastic calculation of the RSI is two steps away. This is important because as with any indicator that is multiple steps away from price, Stoch RSI can have brief disconnects from actual price movement. That being said, as a range bound indicator, the Stoch RSI's primary function is identifying crossovers as well as overbought and oversold conditions.
Overbought/Oversold
Overbought and Oversold conditions are traditionally different than the RSI. While RSI overbought and oversold conditions are traditionally set at 70 for overbought and 30 for oversold, Stoch RSI are typically .80 and .20 respectively. When using the Stoch RSI, overbought and oversold work best when trading along with the underlying trend.
During an uptrend, look for oversold conditions for points of entry.
During a downtrend, look for overbought conditions for points of entry.
Summary
When using Stoch RSI in technical analysis, a trader should be careful. By adding the Stochastic calculation to RSI, speed is greatly increased. This can generate many more signals and therefore more bad signals as well as the good ones. Stoch RSI needs to be combined with additional tools or indicators in order to be at its most effective. Using trend lines or basic chart pattern analysis can help to identify major, underlying trends and increase the Stoch RSI's accuracy. Using Stoch RSI to make trades that go against the underlying trend is a dangerous proposition.
The added features to the indicator are made for training, it is advisable to use it with caution in tradings.
Bull Trend Filtered StochRSI (BTFS)Ride Bull Trends Via Stochastic with Special Rules for Heavy Bullish Bias
TLDR: Long Only Trend Indicator Where you are always entered Long if the stochastic is over the lower band line and the price is above the Donchian Chanel high. Exit when Stochastic RSI is below the lower band.
Indicators:
Filter = Trend/Bullish indicator is Donchian of ema(high) this is set as the highest ema(high, 6) in the last 30 candles. this can be adjusted to fit the market as desired.
**indicator prints green background when the filter condition is satisfied***
Entry Exit = enter when the Stoch RSI is above the given lower trend band. This value is set at 35 but can be adjusted according to risk tolerance and market conditions.
Logic:
this indicator allows a trader to be present during bullish/parabolic trends by only triggering if the close is > than the highest 6 candle average high over the last 30 candles. This filter requires the market to be in a generally bullish posture. If the market is in this condition the stochastic RSI indicator value offers a good gauge of price action and only goes significantly down if price trends below the average range of the rsi period. This filters out noise and keeps a trader from over trading on inconsequential corrections while responding fairly quickly to changes in general trend direction. the response is fast enough to produce an unprofitable amount of false signals if the bull market filter is not implemented. However when used in combination the signals return desirable results in bull trending markets.
Hope this Helps. Happy Trades.
-Snarky Puppy

Stochastic Heat MapA series of 28 stochastic oscillators plotted horizontally and stacked vertically from bottom to top as the oscillator background.
Each oscillator has been interpreted and the value has been used to colour the lines in.
Lower lines are shorter term stochastics and higher lines are longer term stochastics.
The average of the 28 stochastics has been taken and then used to plot the fast oscillator line, which also has a slow oscillator line to follow.
The oscillator line can be used to colour in the candles.
Inputs:
MA: multiple smoothing methods
Theme: multiple colours
Increment: stochastic length start and increments
Smooth Fast: smooth fast length
Smooth Slow: smooth slow length
Paint Bars: colour candles
Waves: toggle method to weight/increment stochastics
Heat map shows momentum extremes:
