[Sextan] Haos Vieual BacktestLevel: 1
NOTE: This is a request by @scantor516 to backtest Haos Visual @PuppyTherapy by QuantTherapy with my Sextan framework. You can backtest many of my indicators in minutes now! Of course,you can define your own indicator in the highlighted area in compliance with the uniform format, which guarantee when you use "Indicator on Indicator" function, it would not produce any error.
Courtesy of QuantTherapy for his Haos Visual @PuppyTherapy
Background
Backtesting of technical indicators and strategies is the most common way to understand a quantitative strategy. However, the complicated configuration and adaptation work of backtesting many quantitative tools makes many traders who do not understand the code daunted. Moreover, although I have written a lot of strategies, I am still not very satisfied with the backtest configuration and writing efficiency. Therefore, I have been thinking about how to build a backtesting framework that can quickly and easily evaluate the backtesting performance of any indicator with a "long/short entry" indicator, that is, a "simple backtesting tool for dummies". The performance requirements should be stable, and the operation should be simple and convenient. It is best to "copy", "paste", and "a few mouse clicks" to complete the quick backtest and evaluation of a new indicator.
Luckily, I recently realized that TradingView provides an "Indicator on Indicator" feature, which is the perfect foundation for doing "hot swap" backtesting. My basic idea is to use a two-layer design. The first layer is the technical indicator signal source that needs to be embedded, which is only used to provide buy and sell signals of custom strategies; the second layer is the trading system, which is used to receive the output signals of the first layer, and filter the signals according to the agreed specifications. , Take Profit, Stop Loss, draw buy and sell signals and cost lines, define and send custom buy and sell alert messages to mobile phones, social software or trading interfaces. In general, this two-layer design is a flexible combination of "death and alive", which can meet the needs of most traders to quickly evaluate the performance of a certain technical indicator. The first layer here is flexible. Users can insert their own strategy codes according to my template, and they can draw buy and sell signals and output them to the second layer. The second layer is fixed, and the overall framework is solidified to ensure the stability and unity of the trading system. It is convenient to compare different or similar strategies under the same conditions. Finally, all trading signals are drawn on the chart, and the output strategy returns. test report.
The main function:
The first layer: "{Sextan} Your Indicator Source", the script provides a template for personalized strategy input, and the signal and definition interfaces ensure full compatibility with the second layer. Backtesting is performed stably in the backtesting framework of the layer. The first layer of this script is also relatively simple: enter your script in the highlighted custom script area, and after ensuring the final buy and sell signals long = bool condition, short = bool condition, the design of the first layer is considered complete. Input it into the PINE script editor of TradingView, save it and add it to the chart, you can see the pulse sequence in yellow (buy) and purple (sell) on the sub-picture, corresponding to the main picture, you can subjectively judge that the quality of the trading point of the strategy is good Bad.
The second layer: "{Sextan} PINEv4 Sextans Backtest Framework". This script is the standardized trading system strategy execution and alarm, used to generate the final report of the strategy backtest and some key indicators that I have customized that I find useful, such as: winning rate , Odds, Winning Surface, Kelly Ratio, Take Profit and Stop Loss Thresholds, Trading Frequency, etc. are evaluated according to the Kelly formula. To use the second layer, first load it into the TrainingView chart, no markers will appear on the chart, since you have not specified any strategy source signals, click on the gear-shaped setting next to the "{Sextan} PINEv4 Sextans BTFW" header button, you can open the backtest settings, the first item is to select your custom strategy source. Because we have added the strategy source to the chart in the previous step, you can easily find an option "{Sextan} Your Indicator Source: Signal" at the bottom of the list, this is the strategy source input we need, select and confirm , you can see various markers on the main graph, and quickly generate a backtesting profit graph and a list of backtesting reports. You can generate files and download the backtesting reports locally. You can also click the gear on the backtest chart interface to customize some conditions of the backtest, including: initial capital amount, currency type, percentage of each order placed, amount of pyramid additions, commission fees, slippage, etc. configuration. Note: The configuration in the interface dialog overrides the same configuration implemented by the code in the backtest script.
How to output charts:
The first layer: "{Sextan} Your Indicator Source", the output of this script is the pulse value of yellow and purple, yellow +1 means buy, purple -1 means sell.
The second layer: PINEv4 Sextans Backtest Framework". The output of this script is a bit complicated. After all, it is the entire trading system with a lot of information:
1. Blue and red arrows. The blue upward arrow indicates long position, the red downward arrow indicates short position, and the horizontal bar at the end of the purple arrow indicates take profit or stop loss exit.
2. Red and green lines. This is the holding cost line of the strategy, green represents the cost of holding a long position, and red represents the cost of holding a short position. The cost line is a continuous solid line and the price action is relatively close.
3. Green and yellow long take profit and stop loss area and green and yellow long take profit and stop loss fork. Once a long position is held, there is a conditional order for take profit and stop loss. The green horizontal line is the long take profit ratio line, and the yellow is the long stop loss ratio line; the green cross indicates the long take profit price, and the yellow cross indicates the long position. Stop loss price. It's worth noting that the prongs and wires don't necessarily go together. Because of the optimization of the algorithm, for a strong market, the take profit will occur after breaking the take profit line, and the profit will not be taken until the price falls.
4. The purple and red short take profit and stop loss area and the purple red short stop loss fork. Once a short position is held, there will be a take profit and stop loss conditional order, the red is the short take profit ratio line, and the purple is the short stop loss ratio line; the red cross indicates the short take profit price, and the purple cross indicates the short stop loss price.
5. In addition to the above signs, there are also text and numbers indicating the profit and loss values of long and short positions. "L" means long; "S" means short; "XL" means close long; "XS" means close short.
TradingView Strategy Tester Panel:
The overview graph is an intuitive graph that plots the blue (gain) and red (loss) curves of all backtest periods together, and notes: the absolute value and percentage of net profit, the number of all closed positions, the winning percentage, the profit factor, The maximum trading loss, the absolute value and ratio of the average trading profit and loss, and the average number of K-lines held in all trades.
Another is the performance summary. This is to display all long and short statistical indicators of backtesting in the form of a list, such as: net profit, gross profit, Sharpe ratio, maximum position, commission, times of profit and loss, etc.
Finally, the transaction list is a table indexed by the transaction serial number, showing the signal direction, date and time, price, profit and loss, accumulated profit and loss, maximum transaction profit, transaction loss and other values.
Remarks
Finally, I will explain that this is just the beginning of this model. I will continue to optimize the trading system of the second layer. Various optimization feedback and suggestions are welcome. For valuable feedback, I am willing to provide some L4/L5 technical indicators as rewards for free subscription rights.
Cerca negli script per "stop loss"

[Sextan] Delta-RSI Oscillator BacktestLevel: 1
NOTE: This is a request by @scantor516 to backtest Delta-RSI Oscillator by tbiktag with my Sextan framework. You can backtest many of my indicators in minutes now! Of course,you can define your own indicator in the highlighted area in compliance with the uniform format, which guarantee when you use "Indicator on Indicator" function, it would not produce any error.
Courtesy of tbiktag for his Delta-RSI Oscillator Strategy
Background
Backtesting of technical indicators and strategies is the most common way to understand a quantitative strategy. However, the complicated configuration and adaptation work of backtesting many quantitative tools makes many traders who do not understand the code daunted. Moreover, although I have written a lot of strategies, I am still not very satisfied with the backtest configuration and writing efficiency. Therefore, I have been thinking about how to build a backtesting framework that can quickly and easily evaluate the backtesting performance of any indicator with a "long/short entry" indicator, that is, a "simple backtesting tool for dummies". The performance requirements should be stable, and the operation should be simple and convenient. It is best to "copy", "paste", and "a few mouse clicks" to complete the quick backtest and evaluation of a new indicator.
Luckily, I recently realized that TradingView provides an "Indicator on Indicator" feature, which is the perfect foundation for doing "hot swap" backtesting. My basic idea is to use a two-layer design. The first layer is the technical indicator signal source that needs to be embedded, which is only used to provide buy and sell signals of custom strategies; the second layer is the trading system, which is used to receive the output signals of the first layer, and filter the signals according to the agreed specifications. , Take Profit, Stop Loss, draw buy and sell signals and cost lines, define and send custom buy and sell alert messages to mobile phones, social software or trading interfaces. In general, this two-layer design is a flexible combination of "death and alive", which can meet the needs of most traders to quickly evaluate the performance of a certain technical indicator. The first layer here is flexible. Users can insert their own strategy codes according to my template, and they can draw buy and sell signals and output them to the second layer. The second layer is fixed, and the overall framework is solidified to ensure the stability and unity of the trading system. It is convenient to compare different or similar strategies under the same conditions. Finally, all trading signals are drawn on the chart, and the output strategy returns. test report.
The main function:
The first layer: "{Sextan} Your Indicator Source", the script provides a template for personalized strategy input, and the signal and definition interfaces ensure full compatibility with the second layer. Backtesting is performed stably in the backtesting framework of the layer. The first layer of this script is also relatively simple: enter your script in the highlighted custom script area, and after ensuring the final buy and sell signals long = bool condition, short = bool condition, the design of the first layer is considered complete. Input it into the PINE script editor of TradingView, save it and add it to the chart, you can see the pulse sequence in yellow (buy) and purple (sell) on the sub-picture, corresponding to the main picture, you can subjectively judge that the quality of the trading point of the strategy is good Bad.
The second layer: "{Sextan} PINEv4 Sextans Backtest Framework". This script is the standardized trading system strategy execution and alarm, used to generate the final report of the strategy backtest and some key indicators that I have customized that I find useful, such as: winning rate , Odds, Winning Surface, Kelly Ratio, Take Profit and Stop Loss Thresholds, Trading Frequency, etc. are evaluated according to the Kelly formula. To use the second layer, first load it into the TrainingView chart, no markers will appear on the chart, since you have not specified any strategy source signals, click on the gear-shaped setting next to the "{Sextan} PINEv4 Sextans BTFW" header button, you can open the backtest settings, the first item is to select your custom strategy source. Because we have added the strategy source to the chart in the previous step, you can easily find an option "{Sextan} Your Indicator Source: Signal" at the bottom of the list, this is the strategy source input we need, select and confirm , you can see various markers on the main graph, and quickly generate a backtesting profit graph and a list of backtesting reports. You can generate files and download the backtesting reports locally. You can also click the gear on the backtest chart interface to customize some conditions of the backtest, including: initial capital amount, currency type, percentage of each order placed, amount of pyramid additions, commission fees, slippage, etc. configuration. Note: The configuration in the interface dialog overrides the same configuration implemented by the code in the backtest script.
How to output charts:
The first layer: "{Sextan} Your Indicator Source", the output of this script is the pulse value of yellow and purple, yellow +1 means buy, purple -1 means sell.
The second layer: PINEv4 Sextans Backtest Framework". The output of this script is a bit complicated. After all, it is the entire trading system with a lot of information:
1. Blue and red arrows. The blue upward arrow indicates long position, the red downward arrow indicates short position, and the horizontal bar at the end of the purple arrow indicates take profit or stop loss exit.
2. Red and green lines. This is the holding cost line of the strategy, green represents the cost of holding a long position, and red represents the cost of holding a short position. The cost line is a continuous solid line and the price action is relatively close.
3. Green and yellow long take profit and stop loss area and green and yellow long take profit and stop loss fork. Once a long position is held, there is a conditional order for take profit and stop loss. The green horizontal line is the long take profit ratio line, and the yellow is the long stop loss ratio line; the green cross indicates the long take profit price, and the yellow cross indicates the long position. Stop loss price. It's worth noting that the prongs and wires don't necessarily go together. Because of the optimization of the algorithm, for a strong market, the take profit will occur after breaking the take profit line, and the profit will not be taken until the price falls.
4. The purple and red short take profit and stop loss area and the purple red short stop loss fork. Once a short position is held, there will be a take profit and stop loss conditional order, the red is the short take profit ratio line, and the purple is the short stop loss ratio line; the red cross indicates the short take profit price, and the purple cross indicates the short stop loss price.
5. In addition to the above signs, there are also text and numbers indicating the profit and loss values of long and short positions. "L" means long; "S" means short; "XL" means close long; "XS" means close short.
TradingView Strategy Tester Panel:
The overview graph is an intuitive graph that plots the blue (gain) and red (loss) curves of all backtest periods together, and notes: the absolute value and percentage of net profit, the number of all closed positions, the winning percentage, the profit factor, The maximum trading loss, the absolute value and ratio of the average trading profit and loss, and the average number of K-lines held in all trades.
Another is the performance summary. This is to display all long and short statistical indicators of backtesting in the form of a list, such as: net profit, gross profit, Sharpe ratio, maximum position, commission, times of profit and loss, etc.
Finally, the transaction list is a table indexed by the transaction serial number, showing the signal direction, date and time, price, profit and loss, accumulated profit and loss, maximum transaction profit, transaction loss and other values.
Remarks
Finally, I will explain that this is just the beginning of this model. I will continue to optimize the trading system of the second layer. Various optimization feedback and suggestions are welcome. For valuable feedback, I am willing to provide some L4/L5 technical indicators as rewards for free subscription rights.

[Sextan] Supertrend - Ladder ATR BacktestLevel: 1
NOTE: This is a request by @upslidedown to backtest Supertrend - Ladder ATR by HeWhoMustNotBeNamed with my Sextan framework. You can backtest many of my indicators in minutes now! Of course,you can define your own indicator in the highlighted area in compliance with the uniform format, which guarantee when you use "Indicator on Indicator" function, it would not produce any error.
Courtesy of HeWhoMustNotBeNamed for his Supertrend - Ladder ATR indicator
Background
Backtesting of technical indicators and strategies is the most common way to understand a quantitative strategy. However, the complicated configuration and adaptation work of backtesting many quantitative tools makes many traders who do not understand the code daunted. Moreover, although I have written a lot of strategies, I am still not very satisfied with the backtest configuration and writing efficiency. Therefore, I have been thinking about how to build a backtesting framework that can quickly and easily evaluate the backtesting performance of any indicator with a "long/short entry" indicator, that is, a "simple backtesting tool for dummies". The performance requirements should be stable, and the operation should be simple and convenient. It is best to "copy", "paste", and "a few mouse clicks" to complete the quick backtest and evaluation of a new indicator.
Luckily, I recently realized that TradingView provides an "Indicator on Indicator" feature, which is the perfect foundation for doing "hot swap" backtesting. My basic idea is to use a two-layer design. The first layer is the technical indicator signal source that needs to be embedded, which is only used to provide buy and sell signals of custom strategies; the second layer is the trading system, which is used to receive the output signals of the first layer, and filter the signals according to the agreed specifications. , Take Profit, Stop Loss, draw buy and sell signals and cost lines, define and send custom buy and sell alert messages to mobile phones, social software or trading interfaces. In general, this two-layer design is a flexible combination of "death and alive", which can meet the needs of most traders to quickly evaluate the performance of a certain technical indicator. The first layer here is flexible. Users can insert their own strategy codes according to my template, and they can draw buy and sell signals and output them to the second layer. The second layer is fixed, and the overall framework is solidified to ensure the stability and unity of the trading system. It is convenient to compare different or similar strategies under the same conditions. Finally, all trading signals are drawn on the chart, and the output strategy returns. test report.
The main function:
The first layer: "{Sextan} Your Indicator Source", the script provides a template for personalized strategy input, and the signal and definition interfaces ensure full compatibility with the second layer. Backtesting is performed stably in the backtesting framework of the layer. The first layer of this script is also relatively simple: enter your script in the highlighted custom script area, and after ensuring the final buy and sell signals long = bool condition, short = bool condition, the design of the first layer is considered complete. Input it into the PINE script editor of TradingView, save it and add it to the chart, you can see the pulse sequence in yellow (buy) and purple (sell) on the sub-picture, corresponding to the main picture, you can subjectively judge that the quality of the trading point of the strategy is good Bad.
The second layer: "{Sextan} PINEv4 Sextans Backtest Framework". This script is the standardized trading system strategy execution and alarm, used to generate the final report of the strategy backtest and some key indicators that I have customized that I find useful, such as: winning rate , Odds, Winning Surface, Kelly Ratio, Take Profit and Stop Loss Thresholds, Trading Frequency, etc. are evaluated according to the Kelly formula. To use the second layer, first load it into the TrainingView chart, no markers will appear on the chart, since you have not specified any strategy source signals, click on the gear-shaped setting next to the "{Sextan} PINEv4 Sextans BTFW" header button, you can open the backtest settings, the first item is to select your custom strategy source. Because we have added the strategy source to the chart in the previous step, you can easily find an option "{Sextan} Your Indicator Source: Signal" at the bottom of the list, this is the strategy source input we need, select and confirm , you can see various markers on the main graph, and quickly generate a backtesting profit graph and a list of backtesting reports. You can generate files and download the backtesting reports locally. You can also click the gear on the backtest chart interface to customize some conditions of the backtest, including: initial capital amount, currency type, percentage of each order placed, amount of pyramid additions, commission fees, slippage, etc. configuration. Note: The configuration in the interface dialog overrides the same configuration implemented by the code in the backtest script.
How to output charts:
The first layer: "{Sextan} Your Indicator Source", the output of this script is the pulse value of yellow and purple, yellow +1 means buy, purple -1 means sell.
The second layer: PINEv4 Sextans Backtest Framework". The output of this script is a bit complicated. After all, it is the entire trading system with a lot of information:
1. Blue and red arrows. The blue upward arrow indicates long position, the red downward arrow indicates short position, and the horizontal bar at the end of the purple arrow indicates take profit or stop loss exit.
2. Red and green lines. This is the holding cost line of the strategy, green represents the cost of holding a long position, and red represents the cost of holding a short position. The cost line is a continuous solid line and the price action is relatively close.
3. Green and yellow long take profit and stop loss area and green and yellow long take profit and stop loss fork. Once a long position is held, there is a conditional order for take profit and stop loss. The green horizontal line is the long take profit ratio line, and the yellow is the long stop loss ratio line; the green cross indicates the long take profit price, and the yellow cross indicates the long position. Stop loss price. It's worth noting that the prongs and wires don't necessarily go together. Because of the optimization of the algorithm, for a strong market, the take profit will occur after breaking the take profit line, and the profit will not be taken until the price falls.
4. The purple and red short take profit and stop loss area and the purple red short stop loss fork. Once a short position is held, there will be a take profit and stop loss conditional order, the red is the short take profit ratio line, and the purple is the short stop loss ratio line; the red cross indicates the short take profit price, and the purple cross indicates the short stop loss price.
5. In addition to the above signs, there are also text and numbers indicating the profit and loss values of long and short positions. "L" means long; "S" means short; "XL" means close long; "XS" means close short.
TradingView Strategy Tester Panel:
The overview graph is an intuitive graph that plots the blue (gain) and red (loss) curves of all backtest periods together, and notes: the absolute value and percentage of net profit, the number of all closed positions, the winning percentage, the profit factor, The maximum trading loss, the absolute value and ratio of the average trading profit and loss, and the average number of K-lines held in all trades.
Another is the performance summary. This is to display all long and short statistical indicators of backtesting in the form of a list, such as: net profit, gross profit, Sharpe ratio, maximum position, commission, times of profit and loss, etc.
Finally, the transaction list is a table indexed by the transaction serial number, showing the signal direction, date and time, price, profit and loss, accumulated profit and loss, maximum transaction profit, transaction loss and other values.
Remarks
Finally, I will explain that this is just the beginning of this model. I will continue to optimize the trading system of the second layer. Various optimization feedback and suggestions are welcome. For valuable feedback, I am willing to provide some L4/L5 technical indicators as rewards for free subscription rights.

[Sextan] Your Indicator Source for PINE v5Level: 1
NOTE: Many request this indicator template to support PINE v5. Now, here it is .This is ONLY an PINE v5 EXAMPLE on HOW-TO produce a customized "{Sextan} PINEv4 Sextans Backtest Framework" (for bactest framework it does not need to be written by PINE v5)intput signal source, you can define your own indicator in the highlighted area in compliance with the uniform format, which guarantee when you use "Indicator on Indicator" function, it would not produce any error.
I use two simple moving average crossings to produce long and short entry signal with SMA3 and SMA8 in the example.
Background
Backtesting of technical indicators and strategies is the most common way to understand a quantitative strategy. However, the complicated configuration and adaptation work of backtesting many quantitative tools makes many traders who do not understand the code daunted. Moreover, although I have written a lot of strategies, I am still not very satisfied with the backtest configuration and writing efficiency. Therefore, I have been thinking about how to build a backtesting framework that can quickly and easily evaluate the backtesting performance of any indicator with a "long/short entry" indicator, that is, a "simple backtesting tool for dummies". The performance requirements should be stable, and the operation should be simple and convenient. It is best to "copy", "paste", and "a few mouse clicks" to complete the quick backtest and evaluation of a new indicator.
Luckily, I recently realized that TradingView provides an "Indicator on Indicator" feature, which is the perfect foundation for doing "hot swap" backtesting. My basic idea is to use a two-layer design. The first layer is the technical indicator signal source that needs to be embedded, which is only used to provide buy and sell signals of custom strategies; the second layer is the trading system, which is used to receive the output signals of the first layer, and filter the signals according to the agreed specifications. , Take Profit, Stop Loss, draw buy and sell signals and cost lines, define and send custom buy and sell alert messages to mobile phones, social software or trading interfaces. In general, this two-layer design is a flexible combination of "death and alive", which can meet the needs of most traders to quickly evaluate the performance of a certain technical indicator. The first layer here is flexible. Users can insert their own strategy codes according to my template, and they can draw buy and sell signals and output them to the second layer. The second layer is fixed, and the overall framework is solidified to ensure the stability and unity of the trading system. It is convenient to compare different or similar strategies under the same conditions. Finally, all trading signals are drawn on the chart, and the output strategy returns. test report.
The main function:
The first layer: "{Sextan} Your Indicator Source", the script provides a template for personalized strategy input, and the signal and definition interfaces ensure full compatibility with the second layer. Backtesting is performed stably in the backtesting framework of the layer. The first layer of this script is also relatively simple: enter your script in the highlighted custom script area, and after ensuring the final buy and sell signals long = bool condition, short = bool condition, the design of the first layer is considered complete. Input it into the PINE script editor of TradingView, save it and add it to the chart, you can see the pulse sequence in yellow (buy) and purple (sell) on the sub-picture, corresponding to the main picture, you can subjectively judge that the quality of the trading point of the strategy is good Bad.
The second layer: "{Sextan} PINEv4 Sextans Backtest Framework". This script is the standardized trading system strategy execution and alarm, used to generate the final report of the strategy backtest and some key indicators that I have customized that I find useful, such as: winning rate , Odds, Winning Surface, Kelly Ratio, Take Profit and Stop Loss Thresholds, Trading Frequency, etc. are evaluated according to the Kelly formula. To use the second layer, first load it into the TrainingView chart, no markers will appear on the chart, since you have not specified any strategy source signals, click on the gear-shaped setting next to the "{Sextan} PINEv4 Sextans BTFW" header button, you can open the backtest settings, the first item is to select your custom strategy source. Because we have added the strategy source to the chart in the previous step, you can easily find an option "{Sextan} Your Indicator Source: Signal" at the bottom of the list, this is the strategy source input we need, select and confirm , you can see various markers on the main graph, and quickly generate a backtesting profit graph and a list of backtesting reports. You can generate files and download the backtesting reports locally. You can also click the gear on the backtest chart interface to customize some conditions of the backtest, including: initial capital amount, currency type, percentage of each order placed, amount of pyramid additions, commission fees, slippage, etc. configuration. Note: The configuration in the interface dialog overrides the same configuration implemented by the code in the backtest script.
How to output charts:
The first layer: "{Sextan} Your Indicator Source", the output of this script is the pulse value of yellow and purple, yellow +1 means buy, purple -1 means sell.
The second layer: PINEv4 Sextans Backtest Framework". The output of this script is a bit complicated. After all, it is the entire trading system with a lot of information:
1. Blue and red arrows. The blue upward arrow indicates long position, the red downward arrow indicates short position, and the horizontal bar at the end of the purple arrow indicates take profit or stop loss exit.
2. Red and green lines. This is the holding cost line of the strategy, green represents the cost of holding a long position, and red represents the cost of holding a short position. The cost line is a continuous solid line and the price action is relatively close.
3. Green and yellow long take profit and stop loss area and green and yellow long take profit and stop loss fork. Once a long position is held, there is a conditional order for take profit and stop loss. The green horizontal line is the long take profit ratio line, and the yellow is the long stop loss ratio line; the green cross indicates the long take profit price, and the yellow cross indicates the long position. Stop loss price. It's worth noting that the prongs and wires don't necessarily go together. Because of the optimization of the algorithm, for a strong market, the take profit will occur after breaking the take profit line, and the profit will not be taken until the price falls.
4. The purple and red short take profit and stop loss area and the purple red short stop loss fork. Once a short position is held, there will be a take profit and stop loss conditional order, the red is the short take profit ratio line, and the purple is the short stop loss ratio line; the red cross indicates the short take profit price, and the purple cross indicates the short stop loss price.
5. In addition to the above signs, there are also text and numbers indicating the profit and loss values of long and short positions. "L" means long; "S" means short; "XL" means close long; "XS" means close short.
TradingView Strategy Tester Panel:
The overview graph is an intuitive graph that plots the blue (gain) and red (loss) curves of all backtest periods together, and notes: the absolute value and percentage of net profit, the number of all closed positions, the winning percentage, the profit factor, The maximum trading loss, the absolute value and ratio of the average trading profit and loss, and the average number of K-lines held in all trades.
Another is the performance summary. This is to display all long and short statistical indicators of backtesting in the form of a list, such as: net profit, gross profit, Sharpe ratio, maximum position, commission, times of profit and loss, etc.
Finally, the transaction list is a table indexed by the transaction serial number, showing the signal direction, date and time, price, profit and loss, accumulated profit and loss, maximum transaction profit, transaction loss and other values.
Remarks
Finally, I will explain that this is just the beginning of this model. I will continue to optimize the trading system of the second layer. Various optimization feedback and suggestions are welcome. For valuable feedback, I am willing to provide some L4/L5 technical indicators as rewards for free subscription rights.

[Sextan] Hull MA BacktestLevel: 1
NOTE: This is a request by @babaa to backtest Hull suite by InSilico with my Sextan framework. You can backtest many of my indicators in minutes now! Of course,you can define your own indicator in the highlighted area in compliance with the uniform format, which guarantee when you use "Indicator on Indicator" function, it would not produce any error.
Courtesy of InSilico for his Hull suite indicator
Background
Backtesting of technical indicators and strategies is the most common way to understand a quantitative strategy. However, the complicated configuration and adaptation work of backtesting many quantitative tools makes many traders who do not understand the code daunted. Moreover, although I have written a lot of strategies, I am still not very satisfied with the backtest configuration and writing efficiency. Therefore, I have been thinking about how to build a backtesting framework that can quickly and easily evaluate the backtesting performance of any indicator with a "long/short entry" indicator, that is, a "simple backtesting tool for dummies". The performance requirements should be stable, and the operation should be simple and convenient. It is best to "copy", "paste", and "a few mouse clicks" to complete the quick backtest and evaluation of a new indicator.
Luckily, I recently realized that TradingView provides an "Indicator on Indicator" feature, which is the perfect foundation for doing "hot swap" backtesting. My basic idea is to use a two-layer design. The first layer is the technical indicator signal source that needs to be embedded, which is only used to provide buy and sell signals of custom strategies; the second layer is the trading system, which is used to receive the output signals of the first layer, and filter the signals according to the agreed specifications. , Take Profit, Stop Loss, draw buy and sell signals and cost lines, define and send custom buy and sell alert messages to mobile phones, social software or trading interfaces. In general, this two-layer design is a flexible combination of "death and alive", which can meet the needs of most traders to quickly evaluate the performance of a certain technical indicator. The first layer here is flexible. Users can insert their own strategy codes according to my template, and they can draw buy and sell signals and output them to the second layer. The second layer is fixed, and the overall framework is solidified to ensure the stability and unity of the trading system. It is convenient to compare different or similar strategies under the same conditions. Finally, all trading signals are drawn on the chart, and the output strategy returns. test report.
The main function:
The first layer: "{Sextan} Your Indicator Source", the script provides a template for personalized strategy input, and the signal and definition interfaces ensure full compatibility with the second layer. Backtesting is performed stably in the backtesting framework of the layer. The first layer of this script is also relatively simple: enter your script in the highlighted custom script area, and after ensuring the final buy and sell signals long = bool condition, short = bool condition, the design of the first layer is considered complete. Input it into the PINE script editor of TradingView, save it and add it to the chart, you can see the pulse sequence in yellow (buy) and purple (sell) on the sub-picture, corresponding to the main picture, you can subjectively judge that the quality of the trading point of the strategy is good Bad.
The second layer: "{Sextan} PINEv4 Sextans Backtest Framework". This script is the standardized trading system strategy execution and alarm, used to generate the final report of the strategy backtest and some key indicators that I have customized that I find useful, such as: winning rate , Odds, Winning Surface, Kelly Ratio, Take Profit and Stop Loss Thresholds, Trading Frequency, etc. are evaluated according to the Kelly formula. To use the second layer, first load it into the TrainingView chart, no markers will appear on the chart, since you have not specified any strategy source signals, click on the gear-shaped setting next to the "{Sextan} PINEv4 Sextans BTFW" header button, you can open the backtest settings, the first item is to select your custom strategy source. Because we have added the strategy source to the chart in the previous step, you can easily find an option "{Sextan} Your Indicator Source: Signal" at the bottom of the list, this is the strategy source input we need, select and confirm , you can see various markers on the main graph, and quickly generate a backtesting profit graph and a list of backtesting reports. You can generate files and download the backtesting reports locally. You can also click the gear on the backtest chart interface to customize some conditions of the backtest, including: initial capital amount, currency type, percentage of each order placed, amount of pyramid additions, commission fees, slippage, etc. configuration. Note: The configuration in the interface dialog overrides the same configuration implemented by the code in the backtest script.
How to output charts:
The first layer: "{Sextan} Your Indicator Source", the output of this script is the pulse value of yellow and purple, yellow +1 means buy, purple -1 means sell.
The second layer: PINEv4 Sextans Backtest Framework". The output of this script is a bit complicated. After all, it is the entire trading system with a lot of information:
1. Blue and red arrows. The blue upward arrow indicates long position, the red downward arrow indicates short position, and the horizontal bar at the end of the purple arrow indicates take profit or stop loss exit.
2. Red and green lines. This is the holding cost line of the strategy, green represents the cost of holding a long position, and red represents the cost of holding a short position. The cost line is a continuous solid line and the price action is relatively close.
3. Green and yellow long take profit and stop loss area and green and yellow long take profit and stop loss fork. Once a long position is held, there is a conditional order for take profit and stop loss. The green horizontal line is the long take profit ratio line, and the yellow is the long stop loss ratio line; the green cross indicates the long take profit price, and the yellow cross indicates the long position. Stop loss price. It's worth noting that the prongs and wires don't necessarily go together. Because of the optimization of the algorithm, for a strong market, the take profit will occur after breaking the take profit line, and the profit will not be taken until the price falls.
4. The purple and red short take profit and stop loss area and the purple red short stop loss fork. Once a short position is held, there will be a take profit and stop loss conditional order, the red is the short take profit ratio line, and the purple is the short stop loss ratio line; the red cross indicates the short take profit price, and the purple cross indicates the short stop loss price.
5. In addition to the above signs, there are also text and numbers indicating the profit and loss values of long and short positions. "L" means long; "S" means short; "XL" means close long; "XS" means close short.
TradingView Strategy Tester Panel:
The overview graph is an intuitive graph that plots the blue (gain) and red (loss) curves of all backtest periods together, and notes: the absolute value and percentage of net profit, the number of all closed positions, the winning percentage, the profit factor, The maximum trading loss, the absolute value and ratio of the average trading profit and loss, and the average number of K-lines held in all trades.
Another is the performance summary. This is to display all long and short statistical indicators of backtesting in the form of a list, such as: net profit, gross profit, Sharpe ratio, maximum position, commission, times of profit and loss, etc.
Finally, the transaction list is a table indexed by the transaction serial number, showing the signal direction, date and time, price, profit and loss, accumulated profit and loss, maximum transaction profit, transaction loss and other values.
Remarks
Finally, I will explain that this is just the beginning of this model. I will continue to optimize the trading system of the second layer. Various optimization feedback and suggestions are welcome. For valuable feedback, I am willing to provide some L4/L5 technical indicators as rewards for free subscription rights.

[Sextan] Fisher Transform BacktestLevel: 1
NOTE: This is a request by @Uni_ve12se to backtest Ehlers Fisher Transform by cheatcountry with my Sextan framework. I ONLY take 5 minutes to perform it and how much time would you cost for this work? You can backtest many of my indicators in minutes now! Of course,you can define your own indicator in the highlighted area in compliance with the uniform format, which guarantee when you use "Indicator on Indicator" function, it would not produce any error.
Courtesy of cheatcountry for his Ehlers Fisher Transform indicator
Background
Backtesting of technical indicators and strategies is the most common way to understand a quantitative strategy. However, the complicated configuration and adaptation work of backtesting many quantitative tools makes many traders who do not understand the code daunted. Moreover, although I have written a lot of strategies, I am still not very satisfied with the backtest configuration and writing efficiency. Therefore, I have been thinking about how to build a backtesting framework that can quickly and easily evaluate the backtesting performance of any indicator with a "long/short entry" indicator, that is, a "simple backtesting tool for dummies". The performance requirements should be stable, and the operation should be simple and convenient. It is best to "copy", "paste", and "a few mouse clicks" to complete the quick backtest and evaluation of a new indicator.
Luckily, I recently realized that TradingView provides an "Indicator on Indicator" feature, which is the perfect foundation for doing "hot swap" backtesting. My basic idea is to use a two-layer design. The first layer is the technical indicator signal source that needs to be embedded, which is only used to provide buy and sell signals of custom strategies; the second layer is the trading system, which is used to receive the output signals of the first layer, and filter the signals according to the agreed specifications. , Take Profit, Stop Loss, draw buy and sell signals and cost lines, define and send custom buy and sell alert messages to mobile phones, social software or trading interfaces. In general, this two-layer design is a flexible combination of "death and alive", which can meet the needs of most traders to quickly evaluate the performance of a certain technical indicator. The first layer here is flexible. Users can insert their own strategy codes according to my template, and they can draw buy and sell signals and output them to the second layer. The second layer is fixed, and the overall framework is solidified to ensure the stability and unity of the trading system. It is convenient to compare different or similar strategies under the same conditions. Finally, all trading signals are drawn on the chart, and the output strategy returns. test report.
The main function:
The first layer: "{Sextan} Your Indicator Source", the script provides a template for personalized strategy input, and the signal and definition interfaces ensure full compatibility with the second layer. Backtesting is performed stably in the backtesting framework of the layer. The first layer of this script is also relatively simple: enter your script in the highlighted custom script area, and after ensuring the final buy and sell signals long = bool condition, short = bool condition, the design of the first layer is considered complete. Input it into the PINE script editor of TradingView, save it and add it to the chart, you can see the pulse sequence in yellow (buy) and purple (sell) on the sub-picture, corresponding to the main picture, you can subjectively judge that the quality of the trading point of the strategy is good Bad.
The second layer: "{Sextan} PINEv4 Sextans Backtest Framework". This script is the standardized trading system strategy execution and alarm, used to generate the final report of the strategy backtest and some key indicators that I have customized that I find useful, such as: winning rate , Odds, Winning Surface, Kelly Ratio, Take Profit and Stop Loss Thresholds, Trading Frequency, etc. are evaluated according to the Kelly formula. To use the second layer, first load it into the TrainingView chart, no markers will appear on the chart, since you have not specified any strategy source signals, click on the gear-shaped setting next to the "{Sextan} PINEv4 Sextans BTFW" header button, you can open the backtest settings, the first item is to select your custom strategy source. Because we have added the strategy source to the chart in the previous step, you can easily find an option "{Sextan} Your Indicator Source: Signal" at the bottom of the list, this is the strategy source input we need, select and confirm , you can see various markers on the main graph, and quickly generate a backtesting profit graph and a list of backtesting reports. You can generate files and download the backtesting reports locally. You can also click the gear on the backtest chart interface to customize some conditions of the backtest, including: initial capital amount, currency type, percentage of each order placed, amount of pyramid additions, commission fees, slippage, etc. configuration. Note: The configuration in the interface dialog overrides the same configuration implemented by the code in the backtest script.
How to output charts:
The first layer: "{Sextan} Your Indicator Source", the output of this script is the pulse value of yellow and purple, yellow +1 means buy, purple -1 means sell.
The second layer: PINEv4 Sextans Backtest Framework". The output of this script is a bit complicated. After all, it is the entire trading system with a lot of information:
1. Blue and red arrows. The blue upward arrow indicates long position, the red downward arrow indicates short position, and the horizontal bar at the end of the purple arrow indicates take profit or stop loss exit.
2. Red and green lines. This is the holding cost line of the strategy, green represents the cost of holding a long position, and red represents the cost of holding a short position. The cost line is a continuous solid line and the price action is relatively close.
3. Green and yellow long take profit and stop loss area and green and yellow long take profit and stop loss fork. Once a long position is held, there is a conditional order for take profit and stop loss. The green horizontal line is the long take profit ratio line, and the yellow is the long stop loss ratio line; the green cross indicates the long take profit price, and the yellow cross indicates the long position. Stop loss price. It's worth noting that the prongs and wires don't necessarily go together. Because of the optimization of the algorithm, for a strong market, the take profit will occur after breaking the take profit line, and the profit will not be taken until the price falls.
4. The purple and red short take profit and stop loss area and the purple red short stop loss fork. Once a short position is held, there will be a take profit and stop loss conditional order, the red is the short take profit ratio line, and the purple is the short stop loss ratio line; the red cross indicates the short take profit price, and the purple cross indicates the short stop loss price.
5. In addition to the above signs, there are also text and numbers indicating the profit and loss values of long and short positions. "L" means long; "S" means short; "XL" means close long; "XS" means close short.
TradingView Strategy Tester Panel:
The overview graph is an intuitive graph that plots the blue (gain) and red (loss) curves of all backtest periods together, and notes: the absolute value and percentage of net profit, the number of all closed positions, the winning percentage, the profit factor, The maximum trading loss, the absolute value and ratio of the average trading profit and loss, and the average number of K-lines held in all trades.
Another is the performance summary. This is to display all long and short statistical indicators of backtesting in the form of a list, such as: net profit, gross profit, Sharpe ratio, maximum position, commission, times of profit and loss, etc.
Finally, the transaction list is a table indexed by the transaction serial number, showing the signal direction, date and time, price, profit and loss, accumulated profit and loss, maximum transaction profit, transaction loss and other values.
Remarks
Finally, I will explain that this is just the beginning of this model. I will continue to optimize the trading system of the second layer. Various optimization feedback and suggestions are welcome. For valuable feedback, I am willing to provide some L4/L5 technical indicators as rewards for free subscription rights.

[Sextan] M-Oscillator BacktestLevel: 1
NOTE: This is a request by @scantor516 to backtest M-Oscillator by Mango2Juice with my Sextan framework. I ONLY take 5 minutes to perform it and how much time would you cost for this work?
Courtesy of Mango2Juice for M-Oscillator script.
You can backtest many of my indicators in minutes now! Of course,you can define your own indicator in the highlighted area in compliance with the uniform format, which guarantee when you use "Indicator on Indicator" function, it would not produce any error.
Background
Backtesting of technical indicators and strategies is the most common way to understand a quantitative strategy. However, the complicated configuration and adaptation work of backtesting many quantitative tools makes many traders who do not understand the code daunted. Moreover, although I have written a lot of strategies, I am still not very satisfied with the backtest configuration and writing efficiency. Therefore, I have been thinking about how to build a backtesting framework that can quickly and easily evaluate the backtesting performance of any indicator with a "long/short entry" indicator, that is, a "simple backtesting tool for dummies". The performance requirements should be stable, and the operation should be simple and convenient. It is best to "copy", "paste", and "a few mouse clicks" to complete the quick backtest and evaluation of a new indicator.
Luckily, I recently realized that TradingView provides an "Indicator on Indicator" feature, which is the perfect foundation for doing "hot swap" backtesting. My basic idea is to use a two-layer design. The first layer is the technical indicator signal source that needs to be embedded, which is only used to provide buy and sell signals of custom strategies; the second layer is the trading system, which is used to receive the output signals of the first layer, and filter the signals according to the agreed specifications. , Take Profit, Stop Loss, draw buy and sell signals and cost lines, define and send custom buy and sell alert messages to mobile phones, social software or trading interfaces. In general, this two-layer design is a flexible combination of "death and alive", which can meet the needs of most traders to quickly evaluate the performance of a certain technical indicator. The first layer here is flexible. Users can insert their own strategy codes according to my template, and they can draw buy and sell signals and output them to the second layer. The second layer is fixed, and the overall framework is solidified to ensure the stability and unity of the trading system. It is convenient to compare different or similar strategies under the same conditions. Finally, all trading signals are drawn on the chart, and the output strategy returns. test report.
The main function:
The first layer: "{Sextan} Your Indicator Source", the script provides a template for personalized strategy input, and the signal and definition interfaces ensure full compatibility with the second layer. Backtesting is performed stably in the backtesting framework of the layer. The first layer of this script is also relatively simple: enter your script in the highlighted custom script area, and after ensuring the final buy and sell signals long = bool condition, short = bool condition, the design of the first layer is considered complete. Input it into the PINE script editor of TradingView, save it and add it to the chart, you can see the pulse sequence in yellow (buy) and purple (sell) on the sub-picture, corresponding to the main picture, you can subjectively judge that the quality of the trading point of the strategy is good Bad.
The second layer: "{Sextan} PINEv4 Sextans Backtest Framework". This script is the standardized trading system strategy execution and alarm, used to generate the final report of the strategy backtest and some key indicators that I have customized that I find useful, such as: winning rate , Odds, Winning Surface, Kelly Ratio, Take Profit and Stop Loss Thresholds, Trading Frequency, etc. are evaluated according to the Kelly formula. To use the second layer, first load it into the TrainingView chart, no markers will appear on the chart, since you have not specified any strategy source signals, click on the gear-shaped setting next to the "{Sextan} PINEv4 Sextans BTFW" header button, you can open the backtest settings, the first item is to select your custom strategy source. Because we have added the strategy source to the chart in the previous step, you can easily find an option "{Sextan} Your Indicator Source: Signal" at the bottom of the list, this is the strategy source input we need, select and confirm , you can see various markers on the main graph, and quickly generate a backtesting profit graph and a list of backtesting reports. You can generate files and download the backtesting reports locally. You can also click the gear on the backtest chart interface to customize some conditions of the backtest, including: initial capital amount, currency type, percentage of each order placed, amount of pyramid additions, commission fees, slippage, etc. configuration. Note: The configuration in the interface dialog overrides the same configuration implemented by the code in the backtest script.
How to output charts:
The first layer: "{Sextan} Your Indicator Source", the output of this script is the pulse value of yellow and purple, yellow +1 means buy, purple -1 means sell.
The second layer: PINEv4 Sextans Backtest Framework". The output of this script is a bit complicated. After all, it is the entire trading system with a lot of information:
1. Blue and red arrows. The blue upward arrow indicates long position, the red downward arrow indicates short position, and the horizontal bar at the end of the purple arrow indicates take profit or stop loss exit.
2. Red and green lines. This is the holding cost line of the strategy, green represents the cost of holding a long position, and red represents the cost of holding a short position. The cost line is a continuous solid line and the price action is relatively close.
3. Green and yellow long take profit and stop loss area and green and yellow long take profit and stop loss fork. Once a long position is held, there is a conditional order for take profit and stop loss. The green horizontal line is the long take profit ratio line, and the yellow is the long stop loss ratio line; the green cross indicates the long take profit price, and the yellow cross indicates the long position. Stop loss price. It's worth noting that the prongs and wires don't necessarily go together. Because of the optimization of the algorithm, for a strong market, the take profit will occur after breaking the take profit line, and the profit will not be taken until the price falls.
4. The purple and red short take profit and stop loss area and the purple red short stop loss fork. Once a short position is held, there will be a take profit and stop loss conditional order, the red is the short take profit ratio line, and the purple is the short stop loss ratio line; the red cross indicates the short take profit price, and the purple cross indicates the short stop loss price.
5. In addition to the above signs, there are also text and numbers indicating the profit and loss values of long and short positions. "L" means long; "S" means short; "XL" means close long; "XS" means close short.
TradingView Strategy Tester Panel:
The overview graph is an intuitive graph that plots the blue (gain) and red (loss) curves of all backtest periods together, and notes: the absolute value and percentage of net profit, the number of all closed positions, the winning percentage, the profit factor, The maximum trading loss, the absolute value and ratio of the average trading profit and loss, and the average number of K-lines held in all trades.
Another is the performance summary. This is to display all long and short statistical indicators of backtesting in the form of a list, such as: net profit, gross profit, Sharpe ratio, maximum position, commission, times of profit and loss, etc.
Finally, the transaction list is a table indexed by the transaction serial number, showing the signal direction, date and time, price, profit and loss, accumulated profit and loss, maximum transaction profit, transaction loss and other values.
Remarks
Finally, I will explain that this is just the beginning of this model. I will continue to optimize the trading system of the second layer. Various optimization feedback and suggestions are welcome. For valuable feedback, I am willing to provide some L4/L5 technical indicators as rewards for free subscription rights.

[Sextan] KAMA BacktestLevel: 1
NOTE: This is ONLY an EXAMPLE on HOW-TO produce a customized "{Sextan} PINEv4 Sextans Backtest Framework" with intput signal source as my "{blackcat} L2 Perry Kaufman Adaptive MA (KAMA)" quickly and drawing on main chart. You can backtest many of my indicators in minutes now!
Of course,you can define your own indicator in the highlighted area in compliance with the uniform format, which guarantee when you use "Indicator on Indicator" function, it would not produce any error.
Background
Backtesting of technical indicators and strategies is the most common way to understand a quantitative strategy. However, the complicated configuration and adaptation work of backtesting many quantitative tools makes many traders who do not understand the code daunted. Moreover, although I have written a lot of strategies, I am still not very satisfied with the backtest configuration and writing efficiency. Therefore, I have been thinking about how to build a backtesting framework that can quickly and easily evaluate the backtesting performance of any indicator with a "long/short entry" indicator, that is, a "simple backtesting tool for dummies". The performance requirements should be stable, and the operation should be simple and convenient. It is best to "copy", "paste", and "a few mouse clicks" to complete the quick backtest and evaluation of a new indicator.
Luckily, I recently realized that TradingView provides an "Indicator on Indicator" feature, which is the perfect foundation for doing "hot swap" backtesting. My basic idea is to use a two-layer design. The first layer is the technical indicator signal source that needs to be embedded, which is only used to provide buy and sell signals of custom strategies; the second layer is the trading system, which is used to receive the output signals of the first layer, and filter the signals according to the agreed specifications. , Take Profit, Stop Loss, draw buy and sell signals and cost lines, define and send custom buy and sell alert messages to mobile phones, social software or trading interfaces. In general, this two-layer design is a flexible combination of "death and alive", which can meet the needs of most traders to quickly evaluate the performance of a certain technical indicator. The first layer here is flexible. Users can insert their own strategy codes according to my template, and they can draw buy and sell signals and output them to the second layer. The second layer is fixed, and the overall framework is solidified to ensure the stability and unity of the trading system. It is convenient to compare different or similar strategies under the same conditions. Finally, all trading signals are drawn on the chart, and the output strategy returns. test report.
The main function:
The first layer: "{Sextan} Your Indicator Source", the script provides a template for personalized strategy input, and the signal and definition interfaces ensure full compatibility with the second layer. Backtesting is performed stably in the backtesting framework of the layer. The first layer of this script is also relatively simple: enter your script in the highlighted custom script area, and after ensuring the final buy and sell signals long = bool condition, short = bool condition, the design of the first layer is considered complete. Input it into the PINE script editor of TradingView, save it and add it to the chart, you can see the pulse sequence in yellow (buy) and purple (sell) on the sub-picture, corresponding to the main picture, you can subjectively judge that the quality of the trading point of the strategy is good Bad.
The second layer: "{Sextan} PINEv4 Sextans Backtest Framework". This script is the standardized trading system strategy execution and alarm, used to generate the final report of the strategy backtest and some key indicators that I have customized that I find useful, such as: winning rate , Odds, Winning Surface, Kelly Ratio, Take Profit and Stop Loss Thresholds, Trading Frequency, etc. are evaluated according to the Kelly formula. To use the second layer, first load it into the TrainingView chart, no markers will appear on the chart, since you have not specified any strategy source signals, click on the gear-shaped setting next to the "{Sextan} PINEv4 Sextans BTFW" header button, you can open the backtest settings, the first item is to select your custom strategy source. Because we have added the strategy source to the chart in the previous step, you can easily find an option "{Sextan} Your Indicator Source: Signal" at the bottom of the list, this is the strategy source input we need, select and confirm , you can see various markers on the main graph, and quickly generate a backtesting profit graph and a list of backtesting reports. You can generate files and download the backtesting reports locally. You can also click the gear on the backtest chart interface to customize some conditions of the backtest, including: initial capital amount, currency type, percentage of each order placed, amount of pyramid additions, commission fees, slippage, etc. configuration. Note: The configuration in the interface dialog overrides the same configuration implemented by the code in the backtest script.
How to output charts:
The first layer: "{Sextan} Your Indicator Source", the output of this script is the pulse value of yellow and purple, yellow +1 means buy, purple -1 means sell.
The second layer: PINEv4 Sextans Backtest Framework". The output of this script is a bit complicated. After all, it is the entire trading system with a lot of information:
1. Blue and red arrows. The blue upward arrow indicates long position, the red downward arrow indicates short position, and the horizontal bar at the end of the purple arrow indicates take profit or stop loss exit.
2. Red and green lines. This is the holding cost line of the strategy, green represents the cost of holding a long position, and red represents the cost of holding a short position. The cost line is a continuous solid line and the price action is relatively close.
3. Green and yellow long take profit and stop loss area and green and yellow long take profit and stop loss fork. Once a long position is held, there is a conditional order for take profit and stop loss. The green horizontal line is the long take profit ratio line, and the yellow is the long stop loss ratio line; the green cross indicates the long take profit price, and the yellow cross indicates the long position. Stop loss price. It's worth noting that the prongs and wires don't necessarily go together. Because of the optimization of the algorithm, for a strong market, the take profit will occur after breaking the take profit line, and the profit will not be taken until the price falls.
4. The purple and red short take profit and stop loss area and the purple red short stop loss fork. Once a short position is held, there will be a take profit and stop loss conditional order, the red is the short take profit ratio line, and the purple is the short stop loss ratio line; the red cross indicates the short take profit price, and the purple cross indicates the short stop loss price.
5. In addition to the above signs, there are also text and numbers indicating the profit and loss values of long and short positions. "L" means long; "S" means short; "XL" means close long; "XS" means close short.
TradingView Strategy Tester Panel:
The overview graph is an intuitive graph that plots the blue (gain) and red (loss) curves of all backtest periods together, and notes: the absolute value and percentage of net profit, the number of all closed positions, the winning percentage, the profit factor, The maximum trading loss, the absolute value and ratio of the average trading profit and loss, and the average number of K-lines held in all trades.
Another is the performance summary. This is to display all long and short statistical indicators of backtesting in the form of a list, such as: net profit, gross profit, Sharpe ratio, maximum position, commission, times of profit and loss, etc.
Finally, the transaction list is a table indexed by the transaction serial number, showing the signal direction, date and time, price, profit and loss, accumulated profit and loss, maximum transaction profit, transaction loss and other values.
Remarks
Finally, I will explain that this is just the beginning of this model. I will continue to optimize the trading system of the second layer. Various optimization feedback and suggestions are welcome. For valuable feedback, I am willing to provide some L4/L5 technical indicators as rewards for free subscription rights.

[Sextan] Backtesting with L2 Reversal Labels as an input sourceLevel: 1
NOTE: This is ONLY an EXAMPLE on HOW-TO produce a customized "{Sextan} PINEv4 Sextans Backtest Framework" intput signal with "(blackcat) L2 Reversal Labels", and you can define your own indicator in the highlighted area in compliance with the uniform format, which guarantee when you use "Indicator on Indicator" function, it would not produce any error.
I use two simple moving average crossings to produce long and short entry signal with SMA3 and SMA8 in the example.
Background
Backtesting of technical indicators and strategies is the most common way to understand a quantitative strategy. However, the complicated configuration and adaptation work of backtesting many quantitative tools makes many traders who do not understand the code daunted. Moreover, although I have written a lot of strategies, I am still not very satisfied with the backtest configuration and writing efficiency. Therefore, I have been thinking about how to build a backtesting framework that can quickly and easily evaluate the backtesting performance of any indicator with a "long/short entry" indicator, that is, a "simple backtesting tool for dummies". The performance requirements should be stable, and the operation should be simple and convenient. It is best to "copy", "paste", and "a few mouse clicks" to complete the quick backtest and evaluation of a new indicator.
Luckily, I recently realized that TradingView provides an "Indicator on Indicator" feature, which is the perfect foundation for doing "hot swap" backtesting. My basic idea is to use a two-layer design. The first layer is the technical indicator signal source that needs to be embedded, which is only used to provide buy and sell signals of custom strategies; the second layer is the trading system, which is used to receive the output signals of the first layer, and filter the signals according to the agreed specifications. , Take Profit, Stop Loss, draw buy and sell signals and cost lines, define and send custom buy and sell alert messages to mobile phones, social software or trading interfaces. In general, this two-layer design is a flexible combination of "death and alive", which can meet the needs of most traders to quickly evaluate the performance of a certain technical indicator. The first layer here is flexible. Users can insert their own strategy codes according to my template, and they can draw buy and sell signals and output them to the second layer. The second layer is fixed, and the overall framework is solidified to ensure the stability and unity of the trading system. It is convenient to compare different or similar strategies under the same conditions. Finally, all trading signals are drawn on the chart, and the output strategy returns. test report.
The main function:
The first layer: "{Sextan} Your Indicator Source", the script provides a template for personalized strategy input, and the signal and definition interfaces ensure full compatibility with the second layer. Backtesting is performed stably in the backtesting framework of the layer. The first layer of this script is also relatively simple: enter your script in the highlighted custom script area, and after ensuring the final buy and sell signals long = bool condition, short = bool condition, the design of the first layer is considered complete. Input it into the PINE script editor of TradingView, save it and add it to the chart, you can see the pulse sequence in yellow (buy) and purple (sell) on the sub-picture, corresponding to the main picture, you can subjectively judge that the quality of the trading point of the strategy is good Bad.
The second layer: "{Sextan} PINEv4 Sextans Backtest Framework". This script is the standardized trading system strategy execution and alarm, used to generate the final report of the strategy backtest and some key indicators that I have customized that I find useful, such as: winning rate , Odds, Winning Surface, Kelly Ratio, Take Profit and Stop Loss Thresholds, Trading Frequency, etc. are evaluated according to the Kelly formula. To use the second layer, first load it into the TrainingView chart, no markers will appear on the chart, since you have not specified any strategy source signals, click on the gear-shaped setting next to the "{Sextan} PINEv4 Sextans BTFW" header button, you can open the backtest settings, the first item is to select your custom strategy source. Because we have added the strategy source to the chart in the previous step, you can easily find an option "{Sextan} Your Indicator Source: Signal" at the bottom of the list, this is the strategy source input we need, select and confirm , you can see various markers on the main graph, and quickly generate a backtesting profit graph and a list of backtesting reports. You can generate files and download the backtesting reports locally. You can also click the gear on the backtest chart interface to customize some conditions of the backtest, including: initial capital amount, currency type, percentage of each order placed, amount of pyramid additions, commission fees, slippage, etc. configuration. Note: The configuration in the interface dialog overrides the same configuration implemented by the code in the backtest script.
How to output charts:
The first layer: "{Sextan} Your Indicator Source", the output of this script is the pulse value of yellow and purple, yellow +1 means buy, purple -1 means sell.
The second layer: PINEv4 Sextans Backtest Framework". The output of this script is a bit complicated. After all, it is the entire trading system with a lot of information:
1. Blue and red arrows. The blue upward arrow indicates long position, the red downward arrow indicates short position, and the horizontal bar at the end of the purple arrow indicates take profit or stop loss exit.
2. Red and green lines. This is the holding cost line of the strategy, green represents the cost of holding a long position, and red represents the cost of holding a short position. The cost line is a continuous solid line and the price action is relatively close.
3. Green and yellow long take profit and stop loss area and green and yellow long take profit and stop loss fork. Once a long position is held, there is a conditional order for take profit and stop loss. The green horizontal line is the long take profit ratio line, and the yellow is the long stop loss ratio line; the green cross indicates the long take profit price, and the yellow cross indicates the long position. Stop loss price. It's worth noting that the prongs and wires don't necessarily go together. Because of the optimization of the algorithm, for a strong market, the take profit will occur after breaking the take profit line, and the profit will not be taken until the price falls.
4. The purple and red short take profit and stop loss area and the purple red short stop loss fork. Once a short position is held, there will be a take profit and stop loss conditional order, the red is the short take profit ratio line, and the purple is the short stop loss ratio line; the red cross indicates the short take profit price, and the purple cross indicates the short stop loss price.
5. In addition to the above signs, there are also text and numbers indicating the profit and loss values of long and short positions. "L" means long; "S" means short; "XL" means close long; "XS" means close short.
TradingView Strategy Tester Panel:
The overview graph is an intuitive graph that plots the blue (gain) and red (loss) curves of all backtest periods together, and notes: the absolute value and percentage of net profit, the number of all closed positions, the winning percentage, the profit factor, The maximum trading loss, the absolute value and ratio of the average trading profit and loss, and the average number of K-lines held in all trades.
Another is the performance summary. This is to display all long and short statistical indicators of backtesting in the form of a list, such as: net profit, gross profit, Sharpe ratio, maximum position, commission, times of profit and loss, etc.
Finally, the transaction list is a table indexed by the transaction serial number, showing the signal direction, date and time, price, profit and loss, accumulated profit and loss, maximum transaction profit, transaction loss and other values.
Remarks
Finally, I will explain that this is just the beginning of this model. I will continue to optimize the trading system of the second layer. Various optimization feedback and suggestions are welcome. For valuable feedback, I am willing to provide some L4/L5 technical indicators as rewards for free subscription rights.

[Sextan] Your Indicator SourceLevel: 1
NOTE: This is ONLY an EXAMPLE on HOW-TO produce a customized "{Sextan} PINEv4 Sextans Backtest Framework" intput signal source, you can define your own indicator in the highlighted area in compliance with the uniform format, which guarantee when you use "Indicator on Indicator" function, it would not produce any error.
I use two simple moving average crossings to produce long and short entry signal with SMA3 and SMA8 in the example.
Background
Backtesting of technical indicators and strategies is the most common way to understand a quantitative strategy. However, the complicated configuration and adaptation work of backtesting many quantitative tools makes many traders who do not understand the code daunted. Moreover, although I have written a lot of strategies, I am still not very satisfied with the backtest configuration and writing efficiency. Therefore, I have been thinking about how to build a backtesting framework that can quickly and easily evaluate the backtesting performance of any indicator with a "long/short entry" indicator, that is, a "simple backtesting tool for dummies". The performance requirements should be stable, and the operation should be simple and convenient. It is best to "copy", "paste", and "a few mouse clicks" to complete the quick backtest and evaluation of a new indicator.
Luckily, I recently realized that TradingView provides an "Indicator on Indicator" feature, which is the perfect foundation for doing "hot swap" backtesting. My basic idea is to use a two-layer design. The first layer is the technical indicator signal source that needs to be embedded, which is only used to provide buy and sell signals of custom strategies; the second layer is the trading system, which is used to receive the output signals of the first layer, and filter the signals according to the agreed specifications. , Take Profit, Stop Loss, draw buy and sell signals and cost lines, define and send custom buy and sell alert messages to mobile phones, social software or trading interfaces. In general, this two-layer design is a flexible combination of "death and alive", which can meet the needs of most traders to quickly evaluate the performance of a certain technical indicator. The first layer here is flexible. Users can insert their own strategy codes according to my template, and they can draw buy and sell signals and output them to the second layer. The second layer is fixed, and the overall framework is solidified to ensure the stability and unity of the trading system. It is convenient to compare different or similar strategies under the same conditions. Finally, all trading signals are drawn on the chart, and the output strategy returns. test report.
The main function:
The first layer: "{Sextan} Your Indicator Source", the script provides a template for personalized strategy input, and the signal and definition interfaces ensure full compatibility with the second layer. Backtesting is performed stably in the backtesting framework of the layer. The first layer of this script is also relatively simple: enter your script in the highlighted custom script area, and after ensuring the final buy and sell signals long = bool condition, short = bool condition, the design of the first layer is considered complete. Input it into the PINE script editor of TradingView, save it and add it to the chart, you can see the pulse sequence in yellow (buy) and purple (sell) on the sub-picture, corresponding to the main picture, you can subjectively judge that the quality of the trading point of the strategy is good Bad.
The second layer: "{Sextan} PINEv4 Sextans Backtest Framework". This script is the standardized trading system strategy execution and alarm, used to generate the final report of the strategy backtest and some key indicators that I have customized that I find useful, such as: winning rate , Odds, Winning Surface, Kelly Ratio, Take Profit and Stop Loss Thresholds, Trading Frequency, etc. are evaluated according to the Kelly formula. To use the second layer, first load it into the TrainingView chart, no markers will appear on the chart, since you have not specified any strategy source signals, click on the gear-shaped setting next to the "{Sextan} PINEv4 Sextans BTFW" header button, you can open the backtest settings, the first item is to select your custom strategy source. Because we have added the strategy source to the chart in the previous step, you can easily find an option "{Sextan} Your Indicator Source: Signal" at the bottom of the list, this is the strategy source input we need, select and confirm , you can see various markers on the main graph, and quickly generate a backtesting profit graph and a list of backtesting reports. You can generate files and download the backtesting reports locally. You can also click the gear on the backtest chart interface to customize some conditions of the backtest, including: initial capital amount, currency type, percentage of each order placed, amount of pyramid additions, commission fees, slippage, etc. configuration. Note: The configuration in the interface dialog overrides the same configuration implemented by the code in the backtest script.
How to output charts:
The first layer: "{Sextan} Your Indicator Source", the output of this script is the pulse value of yellow and purple, yellow +1 means buy, purple -1 means sell.
The second layer: PINEv4 Sextans Backtest Framework". The output of this script is a bit complicated. After all, it is the entire trading system with a lot of information:
1. Blue and red arrows. The blue upward arrow indicates long position, the red downward arrow indicates short position, and the horizontal bar at the end of the purple arrow indicates take profit or stop loss exit.
2. Red and green lines. This is the holding cost line of the strategy, green represents the cost of holding a long position, and red represents the cost of holding a short position. The cost line is a continuous solid line and the price action is relatively close.
3. Green and yellow long take profit and stop loss area and green and yellow long take profit and stop loss fork. Once a long position is held, there is a conditional order for take profit and stop loss. The green horizontal line is the long take profit ratio line, and the yellow is the long stop loss ratio line; the green cross indicates the long take profit price, and the yellow cross indicates the long position. Stop loss price. It's worth noting that the prongs and wires don't necessarily go together. Because of the optimization of the algorithm, for a strong market, the take profit will occur after breaking the take profit line, and the profit will not be taken until the price falls.
4. The purple and red short take profit and stop loss area and the purple red short stop loss fork. Once a short position is held, there will be a take profit and stop loss conditional order, the red is the short take profit ratio line, and the purple is the short stop loss ratio line; the red cross indicates the short take profit price, and the purple cross indicates the short stop loss price.
5. In addition to the above signs, there are also text and numbers indicating the profit and loss values of long and short positions. "L" means long; "S" means short; "XL" means close long; "XS" means close short.
TradingView Strategy Tester Panel:
The overview graph is an intuitive graph that plots the blue (gain) and red (loss) curves of all backtest periods together, and notes: the absolute value and percentage of net profit, the number of all closed positions, the winning percentage, the profit factor, The maximum trading loss, the absolute value and ratio of the average trading profit and loss, and the average number of K-lines held in all trades.
Another is the performance summary. This is to display all long and short statistical indicators of backtesting in the form of a list, such as: net profit, gross profit, Sharpe ratio, maximum position, commission, times of profit and loss, etc.
Finally, the transaction list is a table indexed by the transaction serial number, showing the signal direction, date and time, price, profit and loss, accumulated profit and loss, maximum transaction profit, transaction loss and other values.
Remarks
Finally, I will explain that this is just the beginning of this model. I will continue to optimize the trading system of the second layer. Various optimization feedback and suggestions are welcome. For valuable feedback, I am willing to provide some L4/L5 technical indicators as rewards for free subscription rights.

HPH's FractalTradesThis indicator is based on some dark fractal magic.
Not really, it's inspired by Vladimir Poltoratskiy and basically just waits for the price to go higher or lower than a previous fractal. If that's the case and all the additional settings allow the trade to take place, it is entered with the stop loss at the last opposite fractal of were it was entered (so if we enter a trade because the price went higher than the last up fractal, the sl is at the last down fractal).
The trades are visualised with a stop loss and 3 take profits levels (at a 1:1, 2,1:1 and 4:1 risk/reward ratio). The stop loss will trail once a certain take profit level is reached. Enjoy!
The settings:
LiveVersion : If ticked it will use close for stop losses and take profits. If unticked high and low will be used. Neither is accurate when backtesting as there is no intrabar data...
CancelEarly : Swings trade in the opposite direction when an opposite signal is received. If unticked the trade will continue until a tp or sl is hit.
ShowStats : Show a table in the top right displaying how many times the stop losses or take profits got hit.
FractalPeriods : Number of bars that are required for a fractal. E.g. if it's 2, 2 bars need to be lower on the left and right of a candle for it to print an up fractal.
MinFractalDiv : If this is bigger than 0, it will not allow new fractals to print unless they are at least a percentage based amount bigger than the last one. So this can be used to filter out fractals that are in the same range. Bigger value = more aggressive filtering!
TicksOnFractal : Tick based offset to add onto the fractals to enter trades. E.g. if it's 5 and the price goes above an up fractal, it needs to go up 5 more ticks to enter a trade.
UseFilter, FilterMultMin and FilterMultMax : If ticked, trades are limited to the once in the specified range (distance of the stop loss). E.g. if FilterMultMax is 0.05, the stop loss can not be bigger than 5% of the assets price for the trade to take place.

ADX and DI-BolarinwaThe Average Directional Movement Index (ADX) is a technical indicator that measures the strength of a trend. While the indicator itself doesn’t give an insight into the direction of the trend, the Directional Movement lines can be used to determine if the market moves up or down.
The ADX can return a value between 0 and 100. The usual threshold for a market to be considered as trending by the ADX is a value of 25 or above. Values between 25 and 50 signal a trending market, between 50 and 75 very strong trends and between 75 and 100 extremely strong trends.
The ADX Crossover Trading Strategy
A popular trading strategy to trade on the ADX is based on a crossover of the directional movement lines (+DI and -DI) which was developed directly by the indicator’s creator Mr. Wilder.
The trading strategy states that the first condition for a trade setup is that the ADX has a value of 25 or above, which indicates a trending market.
A buy order is triggered when +DI crosses above -DI, i.e. the underlying trend is an uptrend, while a sell signal is triggered when -DI crosses above +DI, i.e. the underlying trend is a downtrend.
Stop-losses are placed at the low of the current trading day, and the trade setup remains valid even if the directional movement lines cross again after the trade signal. Only a break of the current trading day’s low would lead to the trade setup becoming invalid.
If the ADX remains above 25 or rises even higher, indicating that the strength of the underlying trend increases, then traders can put a trailing stop on the trade.
The following chart shows an example of the ADX crossover strategy on the daily EUR/USD pair.
ADX Crossover Strategy
The first cross of -DI above +DI didn’t send a sell signal because the ADX was below 25. The sell signal came with ADX crossing above 25, while the -DI was still above +DI. On the chart, the SL was put just above the day’s high.
The second signal was a buy signal, with the cross of +DI above -DI and the ADX above 25, signaling a strong trend. The stop-loss is placed just below the day’s low, indicated by the dotted line on the chart.
Finally, the third sell signal came with the cross of -DI above -DI and the ADX above 25. Again, the stop-loss is placed just above the day’s high.
While the ADX crossover strategy can also be applied to lower timeframes, you need to be aware that the increased market noise may create more false signals than on the higher timeframes. The following chart is a 5-minute chart with buy and sell signals based on the crossover strategy. Notice that we placed the stop-losses slightly different than in the previous example. In this case, stop-losses have been placed at the recent highs and lows of the price.
ADX Trading Graph
The first buy signal came with +DI crossing above -DI and ADX above 25. In the middle of the chart, you can notice the crosses of the directional movement lines (+DI and -DI) while the ADX was below 25. As ADX needs to be above 25, those crosses are not used as entry triggers based on the ADX crossover strategy.
After that we received a sell signal with -DI crossing above +DI and ADX above 25, which is followed by a buy signal when +DI crossed above -DI.
Using ADX for Trade Confirmations
Beside the ADX crossover strategy which is based on the crosses of +DI and -DI, traders can also use the ADX indicator to supplement other trading strategies. For example, you might want to use a trend-following strategy when ADX shows a strong trend (value above 25), or a trading strategy that is more suited for ranging markets in times when the ADX shows an absence of trends (value below 25).
Before You Trade
The Average Directional Movement Index is a versatile technical indicator that can be used as a stand-alone trading strategy, or in combination with other trading strategies. The ADX crossover strategy is based on the crossover of the directional movement lines (+DI and -DI) and an ADX reading of above 25. While it can be used across all timeframes, it usually returns the best results on higher ones.
As the ADX measures the strength of the underlying trend, trend-following traders can use it to filter flat and ranging markets and avoid trading during those times.
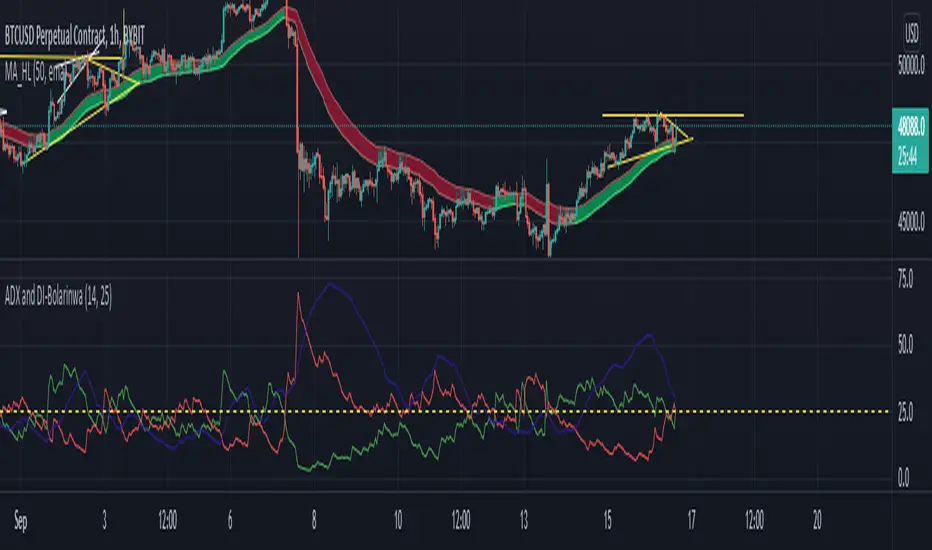
Long Wick TrialI've created this as a confirmation indicator to help know when market conditions are favorable to enter a trade. It measures volume, volatility, and ATR. It is not intended to tell you when to enter/exit the market, but use it with another indicator such as the mirror macd to filter out many losses and avoid entering the market during low volume or excessive volatility that may trip your stop loss.
Green = Favorable Market conditions
Yellow = Enter with caution, the market is moving sideways but is slightly trending
Orange = Enter with caution, the market is trending but extremely volatile and may trip stop loss early
Black = Shouldn't enter market here, market is moving sideways and volume is also low.
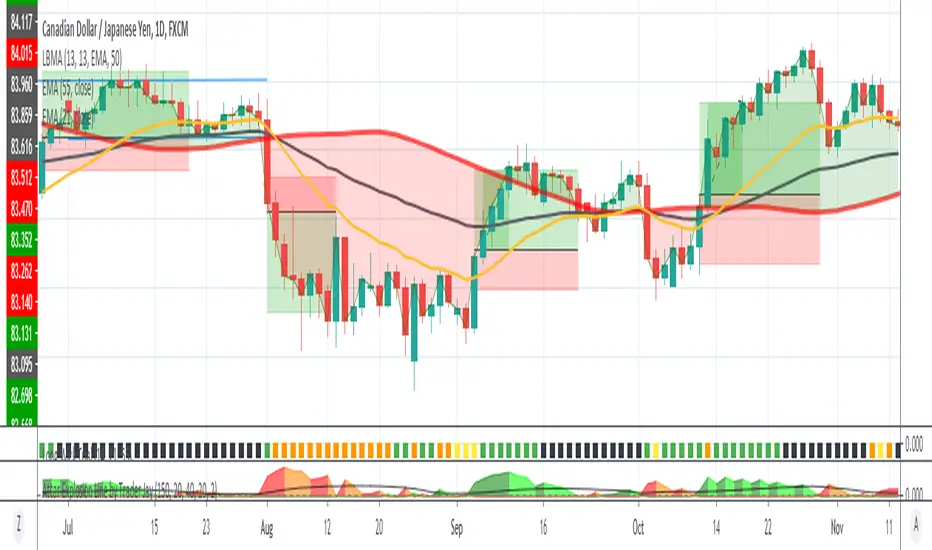
Red and Green Ignored Bar by Oliver VelezOn this occasion I present a script that detects Ignored Red Candles and Ignored Green Candles, basically it is a Price Action event that indicates a possible continuation of the current trend and gives the opportunity to climb it with a Very tight risk, before delving into detail I would like to leave this note:
Note: the detection of this event does not guarantee that the signal will be good, the trader must have the ability to determine its quality based on aspects such as trend, maturity, support / resistance levels, expansion / contraction of the market, risk / benefit, etc, if you do not have knowledge about this you should not use this indicator since using it without a robust trading plan and experience could cause you to partially or totally lose your money, if this is your case you should train before If you try to extract money from the market, this script was created to be another tool in your trading plan in order to configure the rules at your discretion, execute them consistently and have AUTOMATIC ALERTS when the event occurs, which is where I find more value because you can have many instruments waiting for the event to be generated, in the time frame you want and without having to observe the mer When the alert is generated, the Trader should evaluate the quality of the alert and define whether or not to execute it (higher timeframes, they can give you more time to execute the operation correctly).
Let's continue….
This event was created by Oliver Velez recognized trader / mentor of price action, the event has a very interesting particularity since it allows to take a position with a very limited risk in trend movements, this achieves favorable operations of good ratio and small losses when taking An adjusted risk, if the trade works, a good ratio is quickly achieved and we agree with a key point in the “Keep small losses and big profits” trading, this makes it easier to have a positive mathematical hope when your level of Success is not very high, so leave you in the field of profitability.
THE EVENT:
The event has a bullish configuration (Ignored Red Candle) and a bearish configuration (Ignored Green Candle), below I detail the “Hard” rules (later I explain why “Hard”):
1- Last 3 bars have to be GREEN-RED-GREEN (possible bullish configuration) or RED-GREEN-RED (possible bearish configuration), the first bar is called Control Bar, the second is called Ignored Bar and the third Signal Bar as shown in the following image:
2- Be in a trend determined by simple moving averages (Slow of 20 periods and Fast of 8 periods), as a general rule you can take the direction of MA20 but the Trader has to determine if there is a trend movement or not.
3- Control bar of good range, little tail and with a body greater than 55%.
4- Ignored bar preferably narrow range, little tail and that is located in the upper 1/3 of the control bar.
5- Signal bar cannot override the minimum of the ignored bar.
6- Activation / Confirmation of event by means of signal bar in overcoming the body of the ignored bar.
Some examples of ignored bars (with “Hard” and “Flexible” rules):
Features and configuration of the indicator:
To access the indicator settings, press the wheel next to the indicator name VVI_VRI "Configuration options".
- Operation mode (Filtering Type):
• Filtering Complete: all filters activated according to the configuration below.
• Without Filtering: all filters deactivated, all VRI / VVI are displayed without any selection criteria.
• Trend Filter only: shows only VRI / VVI that are in accordance with what is set in “Trend Settings”
- Configuration Moving Averages:
• See Slow Media: slow moving average display with direction detection and color change.
• See Fast Media: display of fast moving average with direction detection and color change.
• Type: possibility to choose the type of media: DEMA, EMA, HullMA, SMA, SSMA, SSMA, TEMA, TMA, VWMA, WMA, ZEMA)
• Period: number of previous bars.
• Source: possibility to choose the type of source, open, close, high, low, hl2 hlc3, ohlc4.
• Reaction: this configuration affects the color change before a change of direction, 1 being an immediate reaction and higher values, a more delayed reaction obtaining les false "changes of direction", a value of 3 filters the direction quite well.
- Trend Configuration
• Uptrend Condition P / VRI: possibility to select any of these conditions:
o Bullish MA direction
o Quick bullish MA direction
o Slow and fast bullish MA direction
o Price higher than slow MA
o Price higher than fast MA
o Price higher than slow and fast MA
o Price higher than slow MA and bullish direction
o Price higher than fast MA and bullish direction
o Price higher than slow, fast MA and bullish direction
o No condition
• Condition P / VVI bear trend: possibility of selecting any of these conditions:
o Slow bearish MA direction
o Fast bearish MA direction
o Slow and fast bearish MA direction
o Price less than slow MA
o Price less than fast MA
o Price less than slow and fast MA
o Price lower than slow MA and bearish direction
o Price less than fast MA and bearish direction
o Price less than slow, fast MA and bearish direction
o No condition
- Control bar configuration
• Minimum body percentage%: possibility to select what body percentage the bar must have.
• Paint control bar: when selected, paint the control bar.
• See control bar label: when selected, a label with the legend BC is plotted.
- Configuration bar ignored
• Above X% of the control bar: possibility to select above what percentage of the control bar the ignored bar must be located.
• Paint ignored bar: when selected, paint the ignored bar.
- Signal bar configuration
• You cannot override the minimum of the ignored bar: when selected, the condition is added that the signal bar cannot override the minimum of the ignored bar.
• Paint signal bar: when selected, paint the signal bar.
• See arrow: when selected it shows the direction arrow of the possible movement.
• See bear and arrow: when selected it shows bear and arrow label
• See bull and arrow: when selected it shows bull and arrow label
The following image shows the ignored bar and painted signal:
- Take profit / loss
The profit / loss taking varies depending on the trader and its risk / monetary plan, the proposal is a recommendation based on the nature of the event that is to have a small risk unit (stop below the minimum of the ignored bar), look for objectives in ratios greater than 2: 1 and eliminate the risk in 1: 1 by taking the stop to BE, all parameters are configurable and are the following:
• See recommended stop loss and take profit: trace the levels of Stop, BE, TP1 and TP2, as well as their prices to know them quickly based on the assumed risk
• To: select which event you want to draw the SL and TP (VRI, VVI)
• Extend stop loss line x bars: allows extending the stop line by x number of bars
• Extend take profit line x bars: allows extending the stop line by x number of bars
• Ratio to move to break even: allows you to select the minimum ratio to move stop to break even (default 1: 1)
• Take profit 1 ratio: allows you to select the ratio for take profit 1 (default 2: 1)
• Take profit 2 ratio: allows you to select the ratio for take profit 2 (default 4: 1)
- Alerts
• It is possible to configure the following alerts:
-VRI DETECTED
-VVI DETECTED
-VRI / VVI DETECTED
Final Notes:
- The term hard rules refers to the fact that an event is sought with the rules detailed above to obtain a high quality event but this brings 2 situations to consider, less
number of events and events that are generated in a strong impulse may be leaked, a very large control bar followed by an ignored narrow body away from moving averages, despite having a good chance of continuing, taking a stop very tight in a strong impulse you can touch it by the simple fact of the own volatility at that time.
- The setting of the parameters “Minimum body percentage% (control bar)”, “Above x% of the control bar (bar ignored)” and “Cannot override the minimum of the ignored bar” can bring large Benefits in terms of number of events and that can also be of high quality, feel free to find the best configuration for your instrument to operate.
- It is recommended to look for trending events, near moving averages and at an early stage of it.
- The display of several nearby VRIs or VVIs in an advanced trend may indicate a depletion of it.
- The alerts can be worked in 2 ways: at the closing of the candle (confirms event but the risk unit may be larger or smaller) or immediately the body of the ignored bar is exceeded, in case you are operating from the mobile and miss many events because of the short time I recommend that you operate in a superior time frame to have more time.
- The indicator is configured with “flexible” rules to have more events, but without any important criteria, each trader has to look for the best configuration that suits his instrument.
- It is recommended to partially close the operation based on the ratio and always keep a part of the position to apply manual trailing stop and try to maximize profits.
The code is open feel free to use and modify it, a mention in credits is appreciated.
If you liked this SCRIPT THUMB UP!
Greetings to all, I wish you much green!

Algorithm Builder - Multiple TrendsHello traders
I. SCRIPTS ACCESS AND TRIALS
1. For the trial request access, they have to be done through my website .
2. My website URL is in this script signature at the very bottom (you'll have to scroll down a bit and going past the long description) and in my profile status available here : Daveatt
Due to the new scripts publishing house rules, I won't mention the URL here directly. As I value my partnership with TradingView very much, I prefer showing you the way for finding them :)
3. You may also contact me directly for more information
II. Algorithm Builder - Multiple Trends
2.1 Forewords
This indicator is available only to our PREMIUM users. Our PREMIUM indicators offer more trading analysis capabilities and opportunities.
A few words of caution: the Algorithm Builders - Multiple Trends are more advanced and as such, would require slightly more time to be mastered.
They're not that much difficult, but we understand that designing a trading system with 2 trends might be slightly more complicated - however, there is nothing to be scared of :).
The time spent to learn how to use our PREMIUM tools might be rewarded handsomely.
2.2 Concept
The Algorithm Builder - Multiple Trends is made to detect the convergence of many unrelated indicators and give a BUY or SELL signal whenever all the selected sub-indicators are converging in the same direction.
This is an upgrade of the PRO package giving access to the Algorithm Builder - Single Trend - designed to show 1 unique entry per trend - whereas the Multiple Trends offers re-entries in the same direction of the trend if the indicator detects good convergences to accumulate more positions.
III. Multiple Trends versus Single Trend
3.1 Multiple Trends benefits
A friend asked us recently Why using the Multiple Trends if we can use the Single Trend in a smaller timeframe, and get more entries that way?
We thought this was an excellent question, but the answer is obvious.
Using a Single Trend on a smaller timeframe to solely getting more entries will reduce the security of the given trades.
We designed the Algorithm Builders to take a trade in an identified trend but reducing the timeframe too much will mostly increase your risk - and might lead to capital loss.
By the way, this is a universal rule valid also for a big majority of indicators.
We're absolutely not saying that the Single Trend won't work on small timeframes because actually it really does. But, if you find out a great configuration for your Single Trend, and want to get more signals without increasing your risk - then the Multiple Trends would be a very viable option.
3.2 Main signal versus secondary signals
For the main and secondary trends, the color green symbolizes any identified "BUY" trend. And the color red symbolizes any identified "SELL" trend.
-The MAIN trend symbol is unique and symbolized by a triangle.
- The SECONDARY (could also be called re-entries) trends are multiple and symbolized by a diamond.
In the Algorithm Builder indicator settings, they're identified with the Additional keyword.
3.3 How the convergences are calculated
Extremely important: The diamonds (or re-entries) are displayed, as long as a triangle (or main/primary signal) is displayed.
For a trend change (buy to sell or sell to buy), the system waits for ALL selected re-entries sub-indicators , to give a convergence/confluence in the opposite direction.
For example, let's assume a BUY/green convergence based on 3 indicators. One or Two of them going turning red, won't be enough for a trend change.
But, if all of them turn red, then we'll see a red triangle - signaling the beginning of a new downtrend.
3.4 Why multiple entries?
Here are a few use cases :
1. The main use case why we made those Multiple Trends indicators: A trader got invalidated or stopped out on a trade, but wants a system to let hin/her jump back in with a minimum of security. (security depending on the configuration of the Algorithm Builder as a whole).
This is very frustrating to get in a trade, being stopped out, and finally, see the trade going in the expected direction.
Even more frustrating to jump back in at the end of a trend, and get stopped out again - we all agree on this.
2. You want to add more positions on your main trade as your Algo Builder identified a solid trend - this is a nice way to possibly maximize your gains.
Once again, we don't/won't guarantee any performance result (not because we don't believe in our tools, but for legal reason), all depends on the time spent reading our documentation and playing with the Algo Builder - as explained on our Tutorials.
More info available on our website. URL available in this script signature and on my profile status.
IV. Why the Algorithm Builder Multiple Trends may help you
I worked with many traders during my career, and their feedback about trading is often pretty similar.
They all tried a lot of complicated indicators, losing their capital, and finally getting back to the basics (even to the basic indicators if I might say)
The art is finding a good combination of indicators and setting strict money/risk management rules.
Easy in concept, but more than 90+% of traders lose money on the markets... which teach us that trading is not only about drawing trendlines, or using cool indicators but finding ways to ease our psychology while trading.
4.1 The Algorithm Builder trading framework
The sub-indicators (full list on our website) weren't chosen randomly. They're based on a trading method we've developed over the last 6 years - while working with traders and other trading quants.
The Algo Builders are made to detect a convergence - and as such, will give a signal once a trend has been identified.
They're not made to detect reversal but have been designed to give a signal when all sub-indicators are either ALL bullish (green) or ALL bearish (red).
We provide a framework based on indicators we selected because they:
1. make sense to be used altogether
2. work on asset classes like INDEX, CRYPTO, STOCK OPTIONS, FOREX, COMMODITIES
3. it may expand your knowledge about what detecting a convergence with pre-selected indicator really means
4.2 Supports and Resistances
The indicator displays the main algorithmic supports and resistances according to our trading method.
I think they're relevant for all asset classes, but you're absolutely free to use any different supports/resistances logic if you want to.
I'm not against it because I know that pivots, Fibonacci levels, etc. may work very well also.
4.6 Hard Exits
Our trading method is known for the hard exits, also called invalidation.
The Single Trend+ includes a hard exit based on a MACD - settings are flexible and you may update them.
Having a stop-loss protecting your trade is a best practice - Protecting your stop-loss also from getting hit is incredible.
We prefer invalidate a few positions, even if sometimes we don't want to. Rather than the market hard exiting on us, and leaving with our hard-working money.
4.7 Alerts
Alerts are enabled for:
- BUY/SELL MAIN triangles signals
- BUY/SELL SECONDARY diamond signals
- Hard Exits
V. Pain points that we're trying to solve with our Algorithm Builders
Issue #1 There are many informations / indicators / strategies / backtests / noise. Finding the right ones is not a simple task.
Solution #1 A reliable system that removes the external noise is much needed in trading to stay "in the game".
Issue #2 Trading could be quite stressful - The majority doesn't lose in trading because technical analysis is hard, but because managing our psychology is one of the hardest things a human can do.
Solution #2 Some ways to reduce the "trading stress" could be: getting better quality signals and trading like a "machine". Forgetting about Twitter and trusting the system you designed.
Issue #3 Trading without strict rules and only based on what we feel, or what we think the market should do is the fastest way to kiss our money goodbye.
Only 1 indicator generally is not enough. Traders generally use a combination of several indicators but they're monitoring them individually.
It's normal then to feel exhausted at the end of the day ^^ (to say the least)... and exhaustion leads to mistakes which leads to..... (I'm sure you got it) ... capital loss.
Solution #3 As a trader, I needed a trading framework and a method. I offer our trading method but they're plenty others out there. We cannot claim obviously it's the best ever ....but let's say we're using those exact same
scripts ourselves for our trading. And this what we've been recommending our clients to trade with for the past years. Also, having a tool detecting the convergence of several indicators and giving 1 unique signal
for BUY/SELL position will save you a lot of time/energy, and perhaps might help you out getting better trading performance.
VI. Resolving a complex puzzle and having fun in the process
Trading has to stay a passion and not (only be) a source of intense stress.
The most successful traders I know are "trading geeks" - literally always looking for optimizing, searching for the best possible entries, setups, indicators, tools, etc.
For them, it's not even about the money anymore, but only about beating their previous performance.
Why are they doing this? Because it's fun
Might appears as a bold statement, but I guarantee that looking for setups is fun.
One of our users even told us, that it's like playing with "Legos" and we couldn't possibly agree more.
VII. Designing a system that "makes sense"
Another bold statement now. Brace yourselves ladies and gentlemen
The Algorithm Builders allow to design trading systems quickly. What could takes days/weeks/months to find out... might be now within your reach in less than a few hours.
With a bit of practice, less than an hour might be enough per asset/timeframe to find a system that makes sense to you and adapted to your trading capital and psychology.
Assuming our users read our guides and are fully committed to learning a new way of trading - then we do guarantee you'll be able to design kick-ass trading systems that make sense.
"Making sense" doesn't mean at all it's guaranteed to win, it means you're the one defining the convergence of indicators, using your Algorithm Builder, and observe that most of the time - whenever there is a BUY signal, the candlesticks are going upwards - whenever there is a SELL signal, it's going downwards.
This is a necessary step to make real progress from a trading analyst perspective - and hopefully could lead to profits.
VII. Algorithm Builder versus the main trader enemy(=psychology)
This indicator has the goal to help solving one of the MAIN issues encountered by traders.
Most of traders realize, they can't perform with only 1 indicator (or 1 price pattern or 1 price action) and need a combination of multiple indicators before getting in a trade.
Far from being a magic pill, if it could at least reduce the stress you have while trading, then we'll consider we made a great job - it's a technical "useless noise remover", and needs to be followed strictly.
Such trust in a trading system can only be built by testing your Algorithm Builder configuration on either:
1. a demo account
2. or a live account with small bids. And then, increasing progressively the bids if your capital increases progressively.
Though, you should still use your common sense. (for instance: if we get a BUY signal right on a big timeframe resistance we're hitting for the first time).
I'm aware this is a new way of trading but for many, and while we cannot foresee the future, neither predict performance, we believe it might save you a lot of time to find good signals.
My maximum level of happiness will be reached the day when our users will contact me and showing me setups being mine.
I'm sure that even I can learn from my users and, we can all learn from each other Algorithm Builder configuration
VIII. What is a wrong or bad configuration?
Simply put. If you see that most of your signals react such as described below:
1. a buy triangle predicts, most of the time an upwards move
2. a sell triangle predicts, most of the time a downwards move
3. you estimated yourself the stop-loss needed to give enough room for your trades.
4. take profits based on algorithmic support and resistances or your own take profit method.
So what's a good Algorithm Builder configuration? A configuration you're happy with and makes sense.
A better Algorithm Builder setup is one used in demo or a live account w/ small bids for a few weeks, and you're consistent in your trading performance.
If you have any doubt or question, please hit me up directly or ask in the comments section of this script.
I'll never claim I have the best trading methodology or the best indicators. You only will be the judge, and I'll appreciate all the questions and feedback you're sending my way.
They help me a ton to develop indicators based on all the requests I received.
Kind regards,
Dave

Crypto FOMO Strategy (monthly-access)PLEASE READ THE ENTIRE POST BEFORE PURCHASING & USING THE FOMO INDICATOR. Saves you and me some time in emails and messages. :)
This is the NEW MONTHLY ACCESS Version of the Crypto FOMO Strategy
Please check the links at the bottom of this post, so you find the way to our shop.
1 Month access is set at $25
10% Disount --> "FOMO25"
Any question, DM me here or on Twitter , check for link on the bottom.
The FOMO Buy Sell Indicator is a very specific strategy, cut down to its roots and made perfect for the volatile crypto market.
Many indicators focus only on one aspect, one side, one specific rule. As you know, this is not how life, the market or anything else works.
FOMO combines many different aspects at the same time, scans multiple other indicators and comes to a conclusion based on over 950 lines of code.
It is based on Divergences, Elliott Waves , Ichimoku , MACD , MACD Histogram, RSI , Stoch , CCI , Momentum, OBV, DIOSC, VWMACD, CMF and multiple EMAs.
Every single aspect is weighted into the decision before giving out an indication.
Most buy/sell indicators FAIL because they try to apply the same strategy to every single chart, which
are as individual as humans.
To conquer this problem, FOMO has a wide range of settings and variables which can be easily
modified.
To make it a true strategy, FOMO has as well settings for Take Profit Points, Multiple Entries and Stop Losses. Everything with an Alert Feature of course.
I know from experience that many people take one indicator and are simply too LAZY to add multiple indicators to make a rational choice.
The result of that is that they lose money, by following blatantly only one indicator.
FOMO has additional 7 indicators, perfect for the crypto market, which can be turned on and off.
FOMO Signals Settings
“Show Signals?” - On/Off to show the Buy/Sell Signals. “Aggressiveness” - Increase to make the signals less aggressive
and decrease to make them more aggressive.
“Show Custom FOMO Timeframe?” - On/Off to show FOMO Signals of a different timeframe in addition to the normal ones.
“Custom FOMO Timeframe?” - Choose the timeframe for the custom FOMO signals.
“Use Safe FOMO?” - On/Off to show only “safe” (less but more exact) FOMO signals.
“Safe FOMO Sells” - Settings for the “safe” FOMO Sell Signals. Decrease number for “less safe” Signals.
Increase number for “more safe” Signals.
“Safe FOMO Buys” - Settings for the “safe” FOMO Buy Signals. Decrease number for “more safe” Signals.
Increase number for “less safe” Signals.
FOMO Strategy Settings
“Take Profit 1 ” - On/Off to show TP1 points.
“Take Profit After %” - Set the percentage after which TP1 is
active.
“Take Profit 2 ” - On/Off to show TP2 points.
“Take Profit 2 After %” - Set the percentage after which TP2 is active.
“Take Profit 3 ” - On/Off to show TP3 points.
“Take Profit 3 After %” - Set the percentage after which TP3 is
active.
“Second Entry” - On/Off to show Second Entry points.
“Second Entry After %” - Set the percentage after which Second Entry is active.
“Third Entry ” - On/Off to Third Entry points.
“Third Entry After %” - Set the percentage after which Third
Entry is active.
“Stop Loss ” - On/Off to show Stop Loss points.
“Take Profit After %” - Set the percentage after which Stop Loss is active.
The FOMO Lifeguard is a special feature made to cancel out the “noice” of the signals and show only signals with a great technical significance.
For this FOMO uses the default settings of +7 and - 7. This references to an index value of multiple settings of almost all indicators used in this script.
+7 cuts out all sell signals below the index value of 7.
- 7 cuts out all buy signals above the index value of - 7.
Using the FOMO Lifeguard is a key element for a sustainable and profitable strategy.
As the normal FOMO Signals, the Lifeguard Signals are also bound to the “Aggressiveness”. Should the cut out of signals with the Lifeguard on be too big, try adjusting the “Aggressiveness”.
With this, once can choose and make this indicator PERFECT for his own strategy and trading style. Day Traders would use no “Lifeguard” and aggressive signals.
Swing Traders would use “Lifeguard” and aggressive signals.
To make the life of the FOMO user even easier, I have added all adjustable Take Profit Points, Multiple entry points and Stop Loss points.
Simply choose how many Take Profit points you would like to have and choose the percentage after which you would like to see the Take Profit point appear on the chart and notify you to take profits.
Are you a Trader who likes multiple entries? Also no problem with FOMO. Select how many additional entries you would like to have and after how many percent you would like them to appear on the chart and remind you of adding to the position.
What would a Strategy be without a Stop Loss? Same settings apply here as on the TPs and MEs .
Crypto Modified Indicators
“Show Divergences?” - On/Off to show Divergences on the Chart based on the data of 10 different indicators.
“Show Custom Divergences?” - On/Off to show Divergences on the chart of a custom timeframe.
“Custom Divergence Timeframe?” - Choose the Timeframe for which the Custom Divergences should appear on the chart.
“Show Oversold/bought?” - On/Off to change the colour of the chart in Oversold/bought conditions.
“Oversold/bought value?” - Choose a value for which the chart is Oversold/bought.
“Show Fibonacci Levels?” - On/Off to show automatic Fibonacci Levels.
“Fibonacci Lookback Lenght” - This value states how many candles from right now are taken into account to paint the Fibonacci Levels.
“Fibonacci Lookback Lenght” - Choose a custom Timeframe that should be used to paint the Fibonacci Levels.
Crypto Modified Indicators 2
“Show EMAs?” - On/Off to show three EMAs on the chart, after the example of @Teddycleps
“EMA Lenght 1” - Choose a value for the first EMA Lenght
“EMA Lenght 2 ” - Choose a value for the second EMA Lenght.
“EMA Lenght 3” - Choose a value for the third EMA Lenght.
The area between the first and third EMA is filled. Is EMA1 above 21, it’s filled green. Is it below, it’s filled red.
“Show Ichimoku? ” - On/Off to show Ichimoku on the chart.
“Show Tenkin?” - On/Off to show Tenkin on the chart.
“Tenkin” - Set the lenght of the Tenkin.
“Show Kijun?” - On/Off to show Kijun on the chart.
“Kijun” - Set the lenght of the Kijun.
“Show Senkou?” - On/Off to show the Senkou on the chart. “Senkou” - Set the lenght of the Senkou.
“Displacement” - Set the value of the Displacement.
“Show ZIG ZAG Lines?” - On/Off to show ZigZag Lines on the chart, used to identify short-term trends and EW counts.
“ZZ Lenght 1” - Set the first lenght of the ZigZag Lines.
“ZZ Lenght 2” - Set the second lenght of the ZigZag Lines.
FOMO without any doubt has Custom Alerts for all Signals that it is painting on the chart. This goes for the “Normal Signals” as well as for the “Lifeguard Signals”.
One can even choose to receive custom notifications for Take Profit points, Multiple Entry points and the Stop Loss points.
The signals appear on the chart DURING the candle, not at the end of the candle. Therefore, the alerts do this as well. These appear during the candle.
Here we can see all of the possible Alerts that can be chosen to be displayed. In total it is 30 different custom alerts, based on what the trader is looking for and how he is trading.
Personally, I have 10-15 coins that I trade the most and for these I have custom notifications, mostly though only the SAFE FOMO Buy and Sell Signals.
To activate Alerts for FOMO
1) Go to the “ALERT” icon on the top tool bar of your Tradingview.
2) Select “CONDITION” as “—Crypto FOMO Strategy—“
3) Then choose ONE condition from the list of conditions.
4) On “OPTIONS” you can set how many times it appears, I have “Once per Bar”.
4.1) If you want to make sure that the signal is truly there and not just a condition for a second during the candle, choose “ONCE PER BAR CLOSE”.
5) “Expiration Time” sets the time until the alert expires. PRO users have no expiration for alerts.
6) “Alert Actions” give you a row of choices what happens and how you want to be notified.
7) “Message” is the message that you receive inside the notification.
AFTERWORD/DISCLAIMER
FOMO has been created after my goal to #MakeCryptoProfessionalAgain. Every aspect of it has its own and very specific use, which traders have shown to find useful in their trading.
This Indicator is meant to help new and experienced traders to understand the various aspects of this market and access all of the most important and most commonly used tools, with JUST ONE CLICK.
FOMO should be used responsibly and treated as an indicator. Signals, scripts, algorithms can NEVER be 100% exact. It is up to the trader to make a well thought and educated decision, wether to follow a signal or not. Our brains are way more advanced than any indicator and algorithm.
I advise especially for this reason to have not just the signals turned on. Please do not use the SAME settings for each chart. Look which Aggressiveness and Lifeguard Settings fit your chart the most, you will be amazed how well some charts work with FOMO.
FOMO should NOT make you FOMO into a trade anymore. It should teach you to make more educated decisions and especially for margin trading reduce the risk of liquidation.
Should you have problems with being liquidated multiple times, I advise to use the “STOP LOSS” function.
Most importantly, enjoy the indicator and trading in general.
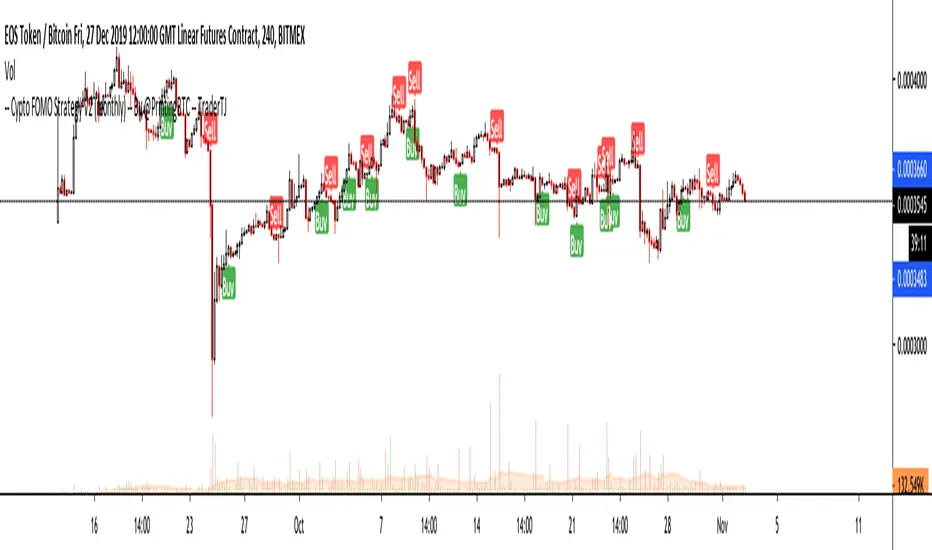
MACKAVELLI Algorithmic ALERTThis is the ALERT script to compliment the strategy script.
When you set the alerts, make sure you use "On Bar Close" as the option, otherwise you will get repeated alerts. You can use this ALERT script with Autoview for automated algorithmic trading.
I had a hard time finding a strategy that would work in different time-frames and multiple different currency pairs. This is what I ended up with after countless hours of research and testing. I designed this strategy for auto-algorithmic trading and it uses three different indicators for Long/Short positions and a 4th indicator for exiting positions.
1) A green-light indicator that tells you whether or not you can go long/short.
2) A confirmation indicator that executes the long/short positions.
3) A chop indicator that measures the distance between the two MA's. When they're too close a trade will not be executed, as this usually indicates a chop zone.
4) A third MA is used as an exit indicator.
5) Finally, a loop function is designed to prevent repeat signals. Once a signal is produced on bar close it cannot happen again until that trade is closed or a new position is opened.
Be advised, you need to adjust the settings for each currency pair and time-frame. Once you do that, back-test it and count the last 100 trades to determine accurately your wins/losses. Long entries are the top of the previous bar, shorts are the bottom of the previous bar. This is a more accurate way of counting wins/losses. Tradingview back-test's are not accurate because of where they estimate your long/short entries are, it's very misleading.
Right now I have it setup for 2hr USDCAD with a back-test of 58% win rate on the last 100 trades.
The chop indicator is set to 0.04, I suggest starting there. 0.03 is the lowest I would go. You can go all the way up to 0.1 and higher if needed. You'll start missing big trades though.
The EMA for green-light signal is set to 10, a lower number will give you more entries but less accurate results, bigger number will give less entries with more accuracy but with missed opportunities. 10 is a good starting point.
This strategy is also designed so you can use tight stop losses to prevent large losses. This is because the strategy typically catches trends on the way up/down, minimizing risk for reversal.
I use Heikin Ashi candles for a smoother chart to work with. I have not tested this strategy with normal candles.
DEMO this strategy before using it live and make sure you back-test and tune it before you start. This is written in PINE V3 SO IT WILL NOT REPAINT.
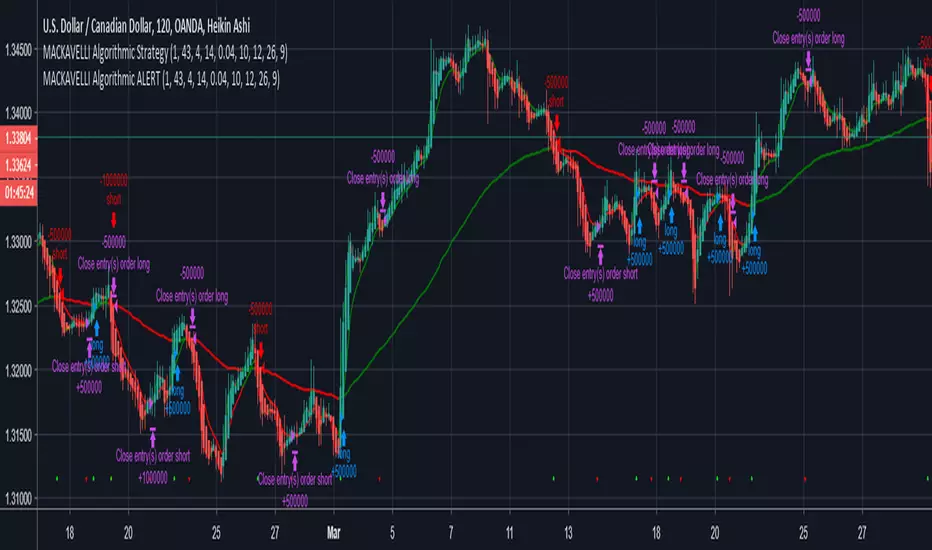
Trend-following Microprofit w/ Smart DCA + Profit Plot + AlertsThis alert script is oriented towards automated trading with Gunbot.
I call it "Options Galore" because of all the user-configurable settings it offers for up-trending and down-trending markets. (See: " Market Tone " study).
A strategy script for quantitative backtesting, smarter buy/sell indicator such as TSI or Stoch RSI, and stop loss/trailing stop are all in the pipeline. Please share any other suggestions in the comments!
Features:
Set backtesting range, or start forward testing from the current time. Historical Renko charts can lead to repainting, which is avoided by keeping the chart open in your browser and running with real time data.
Average protection: only buy if price drops by a certain % below your average price -- can be automatically toggled by market trender if we want to continue buying during an uptrend. This reduces net profit but increases gross profit.
Gain protection: only sell if price is a certain % above your average price -- can be automatically toggled by market trender. Wait for larger profits in an uptrend, but sell earlier in a down trend.
Minimum percent gain can also be set to a negative value to allow selling at a loss. This is not true stop loss behavior, we still need a sell signal from the indicator. This means we will try to get the best price above your price floor, but in some rare situations we may not sell before the price drops below your price floor.
Position plotter: plots average long position price relative to current price.
Plot loss level: plots average price - loss %. With pyramiding turned off, this can be used to find out where to set your stop loss.
This script is free to use, just comment or PM for access. It is mainly meant to showcase some new features, and is only safe to use in carefully selected markets such as USDT-BTC.
Stay posted for upcoming scripts with smarter signaling and additional features! If you would like to add these features to your own preferred strategy, please PM me.

Volatility-Dynamic Risk Manager MNQ [HERMAN]Title: Volatility-Dynamic Risk Manager MNQ
Description:
The Volatility-Dynamic Risk Manager is a dedicated risk management utility designed specifically for traders of Micro Nasdaq 100 Futures (MNQ).
Many traders struggle with position sizing because they use a fixed Stop Loss size regardless of market conditions. A 10-point stop might be safe in a slow market but easily stopped out in a high-volatility environment. This indicator solves that problem by monitoring real-time volatility (using ATR) and automatically suggesting the appropriate Stop Loss size and Position Size (Contracts) to keep your dollar risk constant.
Note: This tool is hardcoded for MNQ (Micro Nasdaq) with a tick value calculation of $2 per point.
📈 How It Works
-This script operates on a logical flow that adapts to market behavior:
-Volatility Measurement: It calculates the Average True Range (ATR) over a user-defined length (Default: 14) to gauge the current "speed" of the market.
-State Detection: Based on the current ATR, the script classifies the market into one of three states:
Low Volatility: The market is chopping or moving slowly.
Normal Volatility: Standard trading conditions.
High Volatility: The market is moving aggressively.
Dynamic Stop Loss Selection: Depending on the detected state, the script selects a pre-defined Stop Loss (in points) that you have configured for that specific environment.
Position Sizing Calculation: Finally, it calculates how many MNQ contracts you can trade so that if your Stop Loss is hit, you do not lose more than your defined "Max Risk per Trade."
🧮 Methodology & Calculations
Since this script handles risk management, transparency in calculation is vital.
Here is the exact math used:
ATR Calculation: Contracts = Max Risk / Risk Per Contract
⚙️ Settings
You can fully customize the behavior of the risk manager via the settings panel:
Risk Management
-Max Risk per Trade ($): The maximum amount of USD you are willing to lose on a single trade.
Volatility Thresholds (ATR)
-ATR Length: The lookback period for volatility calculation.
-Upper Limit for LOW Volatility: If ATR is below this number, the market is "Low Volatility."
-Lower Limit for HIGH Volatility: If ATR is above this number, the market is "High Volatility." (Anything between Low and High is considered "Normal").
Stop Loss Settings (Points)
-SL for Low/Normal/High: Define how wide your stop loss should be in points for each of the three market states.
Visual Settings
-Color Theme: Switch between Light and Dark modes.
-Panel Position: Move the dashboard to any corner or center of your chart.
-Panel Size: Adjust the scale (Tiny to Large) to fit your screen resolution.
📊 Dashboard Overview
-The on-screen panel provides a quick-glance summary for live execution:
-Market State: Color-coded status (Green = Low Vol, Orange = Normal, Red = High Vol).
-Current ATR: The live volatility reading.
-Suggested SL: The Stop Loss size you should enter in your execution platform.
-CONTRACTS: The calculated position size.
-Est. Loss: The actual dollar amount you will lose if the stop is hit (usually slightly less than your Max Risk due to rounding down).
Who is this for?
-Discretionary and systematic futures traders on MNQ (/MNQ or MES also works with small adjustments)
-Anyone who wants perfect risk consistency regardless of whether the market is asleep or exploding
-Traders who hate manual position-size calculations on every trade
No repainting
Works on any timeframe
Real-time updates on every bar
Overlay indicator (no signals, pure risk-management tool)
⚠️ Disclaimer
This tool is for informational and educational purposes only. It calculates mathematical position sizes based on user inputs. It does not execute trades, nor does it guarantee profits. Past performance (volatility) is not indicative of future results. Always manually verify your order size before executing trades on your broker platform.

TraderDemircan - Ultimate Fibonacci Suite (Bearish) v2.0-Overview
This indicator is a comprehensive Fibonacci-based trading tool specifically designed for identifying and trading bearish XABCD harmonic patterns. It combines classical Fibonacci retracement/extension levels with advanced harmonic pattern recognition, risk management calculations, and confluence zone detection to provide traders with a complete analytical framework for short positions.
-What Makes This Script Original
Unlike standard Fibonacci tools that simply draw static levels, this script:
Dynamically identifies swing highs and lows using lookback period analysis
Automatically detects and labels XABCD formation points (X, A, B, C, D) in real-time
Recognizes multiple harmonic patterns (Gartley, Butterfly, Bat, Crab, Shark) with customizable tolerance
Calculates and displays Potential Reversal Zones (PRZ) at point D
Provides integrated risk management with position sizing, stop loss, and multiple take profit levels
Identifies confluence zones where multiple Fibonacci levels intersect
Includes trend filter to validate pattern direction
Offers trading mode presets for scalpers, day traders, and swing traders
-How It Works
XABCD Pattern Detection (Bearish Version)
The script uses a bearish structure where:
Point X: The highest point (swing high) identified within the lookback period
Point A: The lowest point (swing low) that occurs after X
Point B: The retracement level from A back toward X (typically 0.382, 0.5, 0.618, or 0.786)
Point C: The projected target below B (calculated as B minus the X-A range)
Point D: The Potential Reversal Zone (PRZ) where the short position is recommended
The algorithm:
Scans the last N bars (user-defined) to find the highest point (X)
Identifies the lowest point after X (point A)
Monitors price retracement to determine point B
Projects point C and D targets based on Fibonacci extensions
Validates the formation against minimum swing size requirements
Optionally applies trend filter to confirm bearish bias
Fibonacci Levels
The script plots 14 customizable Fibonacci levels:
Retracement levels: 0.0 (X), 0.236, 0.382, 0.5, 0.618, 0.786, 1.0 (A)
Extension levels: 1.272, 1.414, 1.618, 2.0, 2.618, 3.618, 4.236
Each level is color-coded and can be individually toggled on/off. In the bearish version, these levels are calculated from the swing high (X) downward to the swing low (A) and beyond.
Harmonic Pattern Recognition
The indicator automatically detects five classic harmonic patterns when enabled:
Bearish Gartley (75% probability): B retracement at 0.618, D target at 0.786
Bearish Butterfly (70% probability): B retracement at 0.786, D target at 1.272
Bearish Bat (80% probability): B retracement at 0.382-0.5, D target at 0.886
Bearish Crab (85% probability): B retracement at 0.382-0.618, D target at 1.618
Bearish Shark (72% probability): B retracement at 0.382-0.618, D target at 1.13
Pattern detection uses a tolerance parameter (default 5%) to account for market imperfections. When a pattern is identified, it displays the pattern name and estimated success probability.
Risk Management System
The script includes a complete risk management framework:
Position Sizing: Calculates the appropriate position size based on:
Account size (user input)
Risk percentage per trade (user input)
Distance from entry to stop loss
Stop Loss: Automatically placed 0.5% above point X to protect against invalidation
Take Profit Levels:
TP1: 1.272 extension (customizable)
TP2: 1.618 extension (customizable)
TP3: 2.0 extension (customizable)
Risk/Reward Ratio: Displayed in the info panel, calculated as (Entry - TP3) / (Stop Loss - Entry)
Confluence Detection
When multiple Fibonacci levels converge within 0.5% of each other, the script highlights these zones with translucent boxes. These confluence zones often act as strong support/resistance areas and increase the probability of reversal.
Minimum confluence threshold is customizable (default: 2 levels).
Trend Filter
Optional moving average filter (default: 50-period SMA) helps validate that patterns are forming in the direction of the prevailing trend. When enabled with "Only Show Patterns in Trend Direction," the indicator will only display formations that align with a bearish trend (price below MA).
-How to Use
For Scalpers:
Select "Scalper" trading mode
Use lower timeframes (1m, 5m, 15m)
Focus on TP1 and TP2 levels
Tight stop loss above point X
For Day Traders:
Select "Day Trader" trading mode
Use medium timeframes (15m, 30m, 1H)
Target TP2 and TP3 levels
Monitor confluence zones for entry refinement
For Swing Traders:
Select "Swing Trader" trading mode
Use higher timeframes (4H, D)
Hold for TP3 or beyond
Use trend filter to confirm macro direction
Entry Strategy:
Wait for point D (PRZ) to be reached
Look for bearish confirmation (candlestick patterns, volume, momentum)
Enter short position at or near point D
Place stop loss above point X as indicated
Scale out at TP1, TP2, and TP3 levels
-Key Settings
General Settings:
Trading Mode: Presets optimized for different trading styles
Lookback Bars: Historical period for swing detection (10-200)
Min Swing Size: Minimum percentage move to validate formation (0.1-10%)
Fibonacci Levels:
Individual toggle and color customization for all 14 levels
Line thickness and style options (Solid/Dashed/Dotted)
Optional price and percentage labels
Left and right line extension
Harmonic Patterns:
Enable/disable specific pattern types
Pattern tolerance adjustment (1-15%)
Risk Management:
Account size input
Risk percentage per trade (0.5-10%)
Customizable TP level multipliers
Toggle stop loss and take profit displays
Display Options:
Show/hide XABCD lines
C target and D target (PRZ) visualization
Confluence zone highlights
Trend MA overlay
Information panel with trade statistics
Alert Settings:
Pattern completion alerts
C target hit notifications
Key Fibonacci level alerts
-Visual Features
Color-coded Fibonacci levels: Each level has a distinct color for easy identification
Dynamic XABCD lines: Yellow lines connect pattern formation points
Target projections: Magenta for C target, blue for D target (PRZ)
Risk management lines: Red for stop loss, green for take profits
Confluence boxes: Golden translucent boxes highlight key zones
Information panel: Top-right panel displays pattern type, entry, stop loss, TP3, R:R ratio, position size, and direction
Point labels: Clear X, A, B, C, D markers with hover tooltips showing exact prices
-Important Disclaimers
Risk Warning: Trading financial instruments involves substantial risk and may not be suitable for all investors. Past performance of any trading system or pattern is not necessarily indicative of future results.
No Repainting: This indicator does NOT repaint. All pattern detection and level calculations are based on confirmed price data at the close of each bar.
Backtesting Note: If used as a strategy with backtesting, ensure realistic parameters:
Use appropriate commission (0.1% or higher for most markets)
Include slippage (10+ ticks for liquid markets)
Risk no more than 2-5% of account per trade
Test on sufficient sample size (100+ trades minimum)
Manual Confirmation: This indicator is a tool to assist analysis, not a complete trading system. Always use additional confirmation from:
Price action analysis
Volume confirmation
Market context and news
Risk tolerance assessment
Harmonic Pattern Probabilities: The success rates shown (70-85%) are theoretical estimates based on historical studies and should not be interpreted as guarantees. Actual results will vary based on market conditions, execution timing, and individual risk management.
-Technical Details
Pine Script Version: v6 (latest)
Overlay: True (displays on price chart)
Maximum Objects: 500 lines, 500 labels, 500 boxes
Calculation Method: Swing high/low detection with percentage-based Fibonacci calculations
No Lookahead Bias: All calculations use confirmed historical data
Compatible Timeframes: All timeframes (1m to 1M), recommended 15m and above
-Differences from Bullish Version
This is the bearish version specifically designed for short positions:
X point is the swing HIGH (not low)
A point is the swing LOW (not high)
B retracement moves UP from A toward X
C target projects DOWN from B
D target (PRZ) is calculated ABOVE X for short entries
All Fibonacci levels are inverted for downward price movement
Pattern recognition logic adjusted for bearish structures
A companion bullish version is available separately for long position analysis.

Multi-Timeframe Smart Analysis [Abusuhil]الوصف بالعربي في الاسفل .
📊 Multi-Timeframe Smart Analysis
🇬🇧 ENGLISH DESCRIPTION
Overview
Multi-Timeframe Smart Analysis is a professional trading indicator designed for cryptocurrency and forex markets, combining RSI and MACD with multi-timeframe (MTF) confirmation to generate high-probability trading signals. The indicator provides clear entry points, automatic Fibonacci-based targets, and risk management levels.
Key Features
1. Multi-Timeframe Analysis (MTF)
Analyzes up to 3 higher timeframes simultaneously
Provides trend confirmation from HTF1, HTF2, and HTF3
Real-time dashboard showing current trend status
Optional: Can be disabled to trade based on current timeframe only
2. Smart Signal Generation
Buy Signals: Generated when MACD crosses above signal line with bullish RSI and HTF confirmation
Sell Signals: Generated when MACD crosses below signal line with bearish RSI and HTF confirmation
Anti-spam system: Minimum bars between signals (default: 10 bars)
Optional: Show only last signal to keep chart clean
3. Automatic Risk Management
Entry Line: Displays exact entry price
Stop Loss: Calculated using ATR (default: 1.5x ATR)
Take Profit Levels:
T1: 1.618x ATR (First target)
T2: 2.618x ATR (Second target)
T3: 4.236x ATR (Final target)
4. Visual Dashboard
Shows current timeframe RSI and MACD status
Displays HTF1 and HTF2 trend direction (BULL/BEAR)
Real-time signal status (🟢 BUY / 🔴 SELL / ⚪ WAIT)
Clean, professional interface in top-right corner
5. Customization Options
Multiple signal styles: Label, Triangle, Arrow, Circle
Adjustable signal size: Tiny, Small, Normal, Large
Customizable colors for buy/sell signals
Flexible target extension bars
Toggle all features on/off independently
📋 Recommended Settings by Timeframe
For 1-Minute Chart (Scalping)
HTF1: 5 minutes
HTF2: 15 minutes
HTF3: 1 hour
RSI Length: 14
MACD: 12/26/9
Stop Loss ATR: 1.0
Best for: High-frequency scalping on volatile pairs like BTC/USDT, ETH/USDT
For 5-Minute Chart (Day Trading)
HTF1: 15 minutes
HTF2: 1 hour
HTF3: 4 hours
RSI Length: 14
MACD: 12/26/9
Stop Loss ATR: 1.5
Best for: Intraday trading on major crypto pairs and forex
For 15-Minute Chart (Swing Trading)
HTF1: 1 hour
HTF2: 4 hours
HTF3: 1 day
RSI Length: 14
MACD: 12/26/9
Stop Loss ATR: 1.5
Best for: Short-term swing trades, ideal for crypto and forex
For 1-Hour Chart (Position Trading)
HTF1: 4 hours
HTF2: 1 day
HTF3: 3 days
RSI Length: 14
MACD: 12/26/9
Stop Loss ATR: 2.0
Best for: Medium-term positions, suitable for all markets
For 4-Hour Chart (Swing/Position)
HTF1: 1 day
HTF2: 3 days
HTF3: 1 week
RSI Length: 14
MACD: 12/26/9
Stop Loss ATR: 2.5
Best for: Swing trading with lower frequency, higher accuracy
For Daily Chart (Long-Term)
HTF1: 3 days
HTF2: 1 week
HTF3: 1 month
RSI Length: 14
MACD: 12/26/9
Stop Loss ATR: 3.0
Best for: Position trading and long-term investments
🎯 How to Trade with This Indicator
Entry Rules
For LONG (Buy) Entries:
Wait for 🟢 BUY signal to appear
Verify HTF1 and HTF2 show BULL trend in dashboard
Check RSI is below 70 (not overbought)
Enter at the displayed Entry Line price
Place stop loss at SL level
Set take profit at T1, T2, T3 (scale out)
For SHORT (Sell) Entries:
Wait for 🔴 SELL signal to appear
Verify HTF1 and HTF2 show BEAR trend in dashboard
Check RSI is above 30 (not oversold)
Enter at the displayed Entry Line price
Place stop loss at SL level
Set take profit at T1, T2, T3 (scale out)
Exit Strategy (Recommended)
Conservative Approach:
Close 50% position at T1
Move SL to breakeven
Close 30% at T2
Let 20% run to T3 with trailing stop
Aggressive Approach:
Hold full position to T2
Close 70% at T2
Trail remaining 30% to T3
Quick Scalp:
Close entire position at T1
Re-enter on next signal
⚙️ Settings Guide
Timeframe Settings
Enable Higher Timeframe Analysis: Toggle MTF confirmation on/off
HTF1, HTF2, HTF3: Set your desired higher timeframes
RSI Settings
RSI Length: Period for RSI calculation (default: 14)
RSI Overbought: Upper threshold (default: 70)
RSI Oversold: Lower threshold (default: 30)
Use RSI Filter: Enable/disable RSI confirmation
MACD Settings
Fast Length: Fast EMA period (default: 12)
Slow Length: Slow EMA period (default: 26)
Signal Length: Signal line period (default: 9)
Use MACD Filter: Enable/disable MACD confirmation
Target Settings
Show Price Targets: Toggle target lines on/off
Fib Target 1/2/3: Customize Fibonacci multipliers
Target Extension Bars: How far targets extend (default: 50)
Stop Loss ATR: Stop loss distance multiplier (default: 1.5)
Signal Settings
Show Buy/Sell Signals: Toggle signals independently
Show Only Last Signal: Hide previous signals, show only latest
Signal Style: Choose visual style (Label/Triangle/Arrow/Circle)
Minimum Bars Between Signals: Anti-spam filter (default: 10)
📌 Important Notes
Not a Holy Grail: This indicator is a tool, not a guarantee. Always use proper risk management
Backtest First: Test on historical data before live trading
Combine with Price Action: Use support/resistance levels for additional confirmation
Adjust to Market Conditions: Volatile markets may need wider stops, ranging markets need tighter targets
News Events: Avoid trading during major news releases
Risk Management: Never risk more than 1-2% of your capital per trade
🎓 Best Practices
Start Conservative: Begin with default settings
One Timeframe at a Time: Master one chart before expanding
Journal Your Trades: Track which settings work best for your style
Use Demo Account: Practice before risking real money
Stay Disciplined: Follow your trading plan strictly
🔔 Alert System
The indicator includes built-in alerts:
Buy Signal Alert: Notifies when long opportunity appears
Sell Signal Alert: Notifies when short opportunity appears
To activate alerts:
Click "Create Alert" in TradingView
Select "Multi-Timeframe Smart Analysis"
Choose "Buy Signal" or "Sell Signal"
Set notification preferences
💡 Pro Tips
Confluence Trading: Wait for signals that align with key S/R levels
Trend Trading: In strong trends, prioritize signals in trend direction
Multiple Timeframe Entries: Use HTF for bias, lower TF for precise entry
Partial Profits: Always secure some profit at T1
Trailing Stops: Move SL to breakeven after T1 is hit
⚠️ Risk Disclaimer
Trading cryptocurrencies, forex, and other financial instruments involves substantial risk of loss and is not suitable for all investors. Past performance is not indicative of future results. The indicator provides technical analysis only and should not be considered financial advice. You are solely responsible for your trading decisions. Always conduct your own research and consider consulting with a licensed financial advisor.
📞 Support & Updates
For questions, suggestions, or bug reports, please contact via TradingView messages.
Version: 1.0
Author: Abusuhil
Last Updated: December 2024
📊 التحليل الذكي متعدد الأطر الزمنية
🇸🇦 الوصف بالعربية
نظرة عامة
التحليل الذكي متعدد الأطر الزمنية هو مؤشر تداول احترافي مصمم لأسواق العملات الرقمية والفوركس، يجمع بين مؤشري RSI و MACD مع تأكيد من أطر زمنية أعلى لتوليد إشارات تداول عالية الاحتمالية. يوفر المؤشر نقاط دخول واضحة، أهداف تلقائية مبنية على فيبوناتشي، ومستويات إدارة المخاطر.
المزايا الرئيسية
1. التحليل متعدد الأطر الزمنية (MTF)
يحلل حتى 3 أطر زمنية أعلى في وقت واحد
يوفر تأكيد الاتجاه من HTF1، HTF2، و HTF3
لوحة معلومات فورية تظهر حالة الاتجاه الحالي
اختياري: يمكن تعطيله للتداول بناءً على الإطار الزمني الحالي فقط
2. توليد إشارات ذكية
إشارات الشراء: تُنشأ عندما يعبر MACD فوق خط الإشارة مع RSI صاعد وتأكيد HTF
إشارات البيع: تُنشأ عندما يعبر MACD تحت خط الإشارة مع RSI هابط وتأكيد HTF
نظام مضاد للإزعاج: حد أدنى من الشموع بين الإشارات (افتراضي: 10 شموع)
اختياري: إظهار آخر إشارة فقط للحفاظ على نظافة الشارت
3. إدارة تلقائية للمخاطر
خط الدخول: يعرض سعر الدخول الدقيق
وقف الخسارة: محسوب باستخدام ATR (افتراضي: 1.5x ATR)
مستويات جني الأرباح:
T1: 1.618x ATR (الهدف الأول)
T2: 2.618x ATR (الهدف الثاني)
T3: 4.236x ATR (الهدف النهائي)
4. لوحة معلومات مرئية
تعرض حالة RSI و MACD للإطار الزمني الحالي
تظهر اتجاه HTF1 و HTF2 (صاعد/هابط)
حالة الإشارة الفورية (🟢 شراء / 🔴 بيع / ⚪ انتظار)
واجهة نظيفة واحترافية في الزاوية العلوية اليمنى
5. خيارات التخصيص
أنماط إشارات متعددة: تسمية، مثلث، سهم، دائرة
حجم إشارة قابل للتعديل: صغير جداً، صغير، عادي، كبير
ألوان قابلة للتخصيص لإشارات الشراء/البيع
أشرطة تمديد الهدف مرنة
تبديل جميع الميزات تشغيل/إيقاف بشكل مستقل
📋 الإعدادات الموصى بها حسب الإطار الزمني
لشارت دقيقة واحدة (سكالبينج)
HTF1: 5 دقائق
HTF2: 15 دقيقة
HTF3: 1 ساعة
طول RSI: 14
MACD: 12/26/9
وقف الخسارة ATR: 1.0
الأفضل لـ: السكالبينج عالي التردد على الأزواج المتقلبة مثل BTC/USDT، ETH/USDT
لشارت 5 دقائق (التداول اليومي)
HTF1: 15 دقيقة
HTF2: 1 ساعة
HTF3: 4 ساعات
طول RSI: 14
MACD: 12/26/9
وقف الخسارة ATR: 1.5
الأفضل لـ: التداول اليومي على أزواج العملات الرقمية الرئيسية والفوركس
لشارت 15 دقيقة (التداول المتأرجح)
HTF1: 1 ساعة
HTF2: 4 ساعات
HTF3: 1 يوم
طول RSI: 14
MACD: 12/26/9
وقف الخسارة ATR: 1.5
الأفضل لـ: صفقات التأرجح قصيرة المدى، مثالي للعملات الرقمية والفوركس
لشارت ساعة واحدة (التداول بالمراكز)
HTF1: 4 ساعات
HTF2: 1 يوم
HTF3: 3 أيام
طول RSI: 14
MACD: 12/26/9
وقف الخسارة ATR: 2.0
الأفضل لـ: المراكز متوسطة المدى، مناسب لجميع الأسواق
لشارت 4 ساعات (التأرجح/المراكز)
HTF1: 1 يوم
HTF2: 3 أيام
HTF3: 1 أسبوع
طول RSI: 14
MACD: 12/26/9
وقف الخسارة ATR: 2.5
الأفضل لـ: التداول المتأرجح بتردد أقل ودقة أعلى
للشارت اليومي (طويل المدى)
HTF1: 3 أيام
HTF2: 1 أسبوع
HTF3: 1 شهر
طول RSI: 14
MACD: 12/26/9
وقف الخسارة ATR: 3.0
الأفضل لـ: تداول المراكز والاستثمارات طويلة المدى
🎯 كيفية التداول باستخدام هذا المؤشر
قواعد الدخول
لصفقات الشراء (LONG):
انتظر ظهور إشارة 🟢 شراء
تحقق من أن HTF1 و HTF2 تظهر اتجاه صاعد في لوحة المعلومات
تأكد من أن RSI أقل من 70 (ليس في منطقة التشبع الشرائي)
ادخل عند سعر خط الدخول المعروض
ضع وقف الخسارة عند مستوى SL
اضبط جني الأرباح عند T1، T2، T3 (اخرج تدريجياً)
لصفقات البيع (SHORT):
انتظر ظهور إشارة 🔴 بيع
تحقق من أن HTF1 و HTF2 تظهر اتجاه هابط في لوحة المعلومات
تأكد من أن RSI أعلى من 30 (ليس في منطقة التشبع البيعي)
ادخل عند سعر خط الدخول المعروض
ضع وقف الخسارة عند مستوى SL
اضبط جني الأرباح عند T1، T2، T3 (اخرج تدريجياً)
استراتيجية الخروج (موصى بها)
النهج المحافظ:
أغلق 50% من المركز عند T1
حرك وقف الخسارة إلى نقطة التعادل
أغلق 30% عند T2
دع 20% يعمل حتى T3 مع وقف خسارة متحرك
النهج العدواني:
احتفظ بالمركز الكامل حتى T2
أغلق 70% عند T2
تتبع الـ 30% المتبقية حتى T3
سكالبينج سريع:
أغلق المركز بالكامل عند T1
أعد الدخول عند الإشارة التالية
⚙️ دليل الإعدادات
إعدادات الإطار الزمني
تفعيل تحليل الإطار الزمني الأعلى: تبديل تأكيد MTF تشغيل/إيقاف
HTF1، HTF2، HTF3: اضبط الأطر الزمنية الأعلى المرغوبة
إعدادات RSI
طول RSI: فترة حساب RSI (افتراضي: 14)
RSI في التشبع الشرائي: العتبة العليا (افتراضي: 70)
RSI في التشبع البيعي: العتبة السفلى (افتراضي: 30)
استخدام فلتر RSI: تمكين/تعطيل تأكيد RSI
إعدادات MACD
الطول السريع: فترة المتوسط المتحرك السريع (افتراضي: 12)
الطول البطيء: فترة المتوسط المتحرك البطيء (افتراضي: 26)
طول الإشارة: فترة خط الإشارة (افتراضي: 9)
استخدام فلتر MACD: تمكين/تعطيل تأكيد MACD
إعدادات الأهداف
إظهار أهداف الأسعار: تبديل خطوط الأهداف تشغيل/إيقاف
هدف فيبوناتشي 1/2/3: تخصيص مضاعفات فيبوناتشي
أشرطة تمديد الأهداف: مدى امتداد الأهداف (افتراضي: 50)
وقف الخسارة ATR: مضاعف مسافة وقف الخسارة (افتراضي: 1.5)
إعدادات الإشارات
إظهار إشارات الشراء/البيع: تبديل الإشارات بشكل مستقل
إظهار آخر إشارة فقط: إخفاء الإشارات السابقة، إظهار الأحدث فقط
نمط الإشارة: اختر النمط المرئي (تسمية/مثلث/سهم/دائرة)
الحد الأدنى من الشموع بين الإشارات: فلتر مضاد للإزعاج (افتراضي: 10)
📌 ملاحظات مهمة
ليس الكأس المقدسة: هذا المؤشر أداة، وليس ضماناً. استخدم دائماً إدارة مخاطر مناسبة
اختبار رجعي أولاً: اختبر على البيانات التاريخية قبل التداول المباشر
ادمج مع حركة السعر: استخدم مستويات الدعم/المقاومة لتأكيد إضافي
تكيّف مع ظروف السوق: الأسواق المتقلبة قد تحتاج إلى وقف خسارة أوسع، الأسواق الجانبية تحتاج إلى أهداف أضيق
أحداث الأخبار: تجنب التداول أثناء إصدارات الأخبار الكبرى
إدارة المخاطر: لا تخاطر أبداً بأكثر من 1-2% من رأس مالك لكل صفقة
🎓 أفضل الممارسات
ابدأ بحذر: ابدأ بالإعدادات الافتراضية
إطار زمني واحد في كل مرة: أتقن شارت واحد قبل التوسع
سجل صفقاتك: تتبع أي الإعدادات تعمل بشكل أفضل لأسلوبك
استخدم حساب تجريبي: تدرب قبل المخاطرة بأموال حقيقية
التزم بالانضباط: اتبع خطة تداولك بصرامة
🔔 نظام التنبيهات
يتضمن المؤشر تنبيهات مدمجة:
تنبيه إشارة الشراء: يُعلمك عند ظهور فرصة شراء
تنبيه إشارة البيع: يُعلمك عند ظهور فرصة بيع
لتفعيل التنبيهات:
انقر على "إنشاء تنبيه" في TradingView
اختر "Multi-Timeframe Smart Analysis"
اختر "Buy Signal" أو "Sell Signal"
اضبط تفضيلات الإشعارات
💡 نصائح احترافية
تداول التقاء: انتظر الإشارات التي تتماشى مع مستويات الدعم والمقاومة الرئيسية
تداول الاتجاه: في الاتجاهات القوية، أعط الأولوية للإشارات في اتجاه الترند
مداخل الإطار الزمني المتعدد: استخدم HTF للتحيز، إطار زمني أقل للدخول الدقيق
أرباح جزئية: احفظ دائماً بعض الربح عند T1
وقف خسارة متحرك: حرك وقف الخسارة إلى التعادل بعد الوصول إلى T1
⚠️ إخلاء مسؤولية المخاطر
تداول العملات الرقمية والفوركس وغيرها من الأدوات المالية ينطوي على مخاطر كبيرة للخسارة وليس مناسباً لجميع المستثمرين. الأداء السابق لا يشير إلى النتائج المستقبلية. يوفر المؤشر التحليل الفني فقط ولا ينبغي اعتباره نصيحة مالية. أنت المسؤول الوحيد عن قرارات التداول الخاصة بك. قم دائماً بإجراء بحثك الخاص وفكر في استشارة مستشار مالي مرخص.
📞 الدعم والتحديثات
للأسئلة أو الاقتراحات أو الإبلاغ عن الأخطاء، يرجى التواصل عبر رسائل TradingView.
الإصدار: 1.0
المطور: Abusuhil
آخر تحديث: ديسمبر 2024

Premarket LevelsThis indicator tracks premarket high and low levels for day trading, providing statistical analysis on how often these levels get touched during regular trading hours (9:30 AM-4:00 PM EST). It combines real-time level tracking with historical probability analysis and precise timing statistics to help traders make data-driven decisions. I use 4:00 - 9:30 AM on SPY/QQQ etc and 18:00 - 9:30 on Futures ES/NQ etc
Core Features
1. Premarket Level Tracking
Automatically identifies and plots premarket high and low levels
Displays levels with customizable colors and line styles
Shows optional midpoint and percentage/fibonacci retracement levels
Tracks when levels are set during premarket session
2. Historical Touch Analysis
Calculates probability of PM high/low being touched during regular hours
Tracks "Both Levels" touched rate (how often both get hit same day)
Tracks "Either Level" touched rate (how often at least one gets hit)
Adjustable lookback period (1-250 days) for statistical analysis
3. Timing Intelligence
Average time when levels get touched
Earliest and latest touch times in historical data
Four customizable time buckets showing touch distribution throughout the day
First touch time displayed for current session
4. Range Analysis
Current PM range vs historical average (adjustable period)
Range percentile ranking (where today ranks in historical distribution)
Min/Max historical ranges for context
Large/small range detection with customizable thresholds
Background highlighting for unusual range days
5. Smart Signals & Alerts
Buy/Sell signals on level breakouts (adjustable sensitivity)
Level rejection detection (failed breakout patterns)
Proximity alerts when approaching levels
Touch markers (diamond shapes) when levels are tested
Multiple alert conditions for various scenarios
6. Risk Management Tools
Automatic stop loss suggestions (ATR-based, percentage-based, or fixed points)
Target projections based on range extension
Position tracking relative to PM range
Distance calculations to both levels
How To Use
For Day Traders:
Check the "Either Level" percentage - if 90%+, at least one level will likely be touched
Review time bucket statistics - most touches happen 9:30-10:00 AM
Monitor "Both Levels" rate - typically only 20-30%, meaning round trips are rare
Use range percentile to gauge if expansion or mean reversion is likely
For Scalpers:
Enable touch markers to see exact level tests
Use proximity alerts to prepare for potential bounces
Monitor first touch times - early touches often lead to continuations
Check rejection signals for quick reversal trades
For Swing Position Sizing:
Use historical touch rates to assess probability of level tests
Review range size vs average for stop placement guidance
Check timing analysis to avoid holding through low-probability windows
Use target projections for realistic profit targets
Settings Overview
Basic Settings:
Premarket session time (default 4:00-7:30 AM EST)
Signal sensitivity for breakout detection
Timezone selection for accurate time labels
Historical Analysis:
Lookback period for statistics (default 20 days, max 250)
Toggle touch tracking and markers
Enable/disable daily statistics display
Range Analysis:
Adjustable average period (default 20 days)
Large/small range threshold customization
Range percentile display toggle
Timing Analysis:
Three customizable time buckets (default: 10:00, 11:00, 12:00)
Fourth bucket automatically covers afternoon (12:00-4:00 PM)
Toggle time bucket statistics display
Visual Features:
Midpoint line display
Percentage (25%, 75%) or Fibonacci (23.6%, 38.2%, 61.8%, 78.6%) levels
Table position and size customization
Comprehensive color scheme customization (background, text, headers)
Smart Alerts:
Proximity alerts with adjustable threshold
Level rejection detection
Failed breakout detector
Time-of-day filter to avoid lunch chop
Risk Management:
Stop loss method selection (ATR, PM Range %, Fixed Points)
Adjustable ATR multiplier
Target projection display
Statistics Explained
Touch Rates:
Percentage of days where level was touched during RTH
Based only on FIRST touch per day (not multiple re-tests)
Binary metric: Yes/No for each day
Timing Stats:
All based on timestamp of FIRST touch each day
Average, Earliest, Latest provide distribution context
Time buckets show concentration of first touches
Range Metrics:
Current range compared to historical average
Percentile shows where today ranks (0-100%)
Min/Max provide extreme boundaries from history
Important Notes
First Touch Only: All statistics track only the first time a level is touched each day, not subsequent re-tests
RTH Focus: Touch tracking occurs only during regular trading hours (9:30 AM-4:00 PM EST)
Data Accumulation: Historical statistics build over time as indicator runs; requires specified lookback period to populate
Chart Timeframe: Works on any timeframe but recommended 3-5 minute charts for best premarket level precision
Memory Reset: Each new premarket session resets tracking for fresh daily analysis
Best Practices
Use 60-100 day lookback for statistical significance
Combine high touch rates (80%+) with time bucket data for highest probability setups
Small ranges (< 50% of average) often lead to expansion moves
Large ranges (> 150% of average) often consolidate or mean-revert
First 30 minutes typically contains 50%+ of all level touches
After 12:00 PM, probability of untouched levels being hit drops significantly
Performance Considerations
Optimized for real-time calculation with minimal lag
Uses efficient array management for historical data
Table updates only on bar close for performance
Maximum lookback of 250 days to prevent memory issues
This indicator is for educational and informational purposes only. It is NOT financial advice.
The buy/sell signals are algorithmic suggestions based on historical patterns and should NOT be followed blindly
Past performance and historical statistics do NOT guarantee future results
All trading involves substantial risk of loss
You are solely responsible for your own trading decisions
Always perform your own analysis and risk assessment before entering any trade
The creator of this indicator is not responsible for any trading losses incurred from its use
No representation is being made that any account will or is likely to achieve profits or losses similar to those discussed in the indicator statistics
By using this indicator, you acknowledge that you understand these risks and accept full responsibility for your trading decisions.

Nexural QWAPQWAP - Quantitative Weighted Average Price with True Order Flow Analysis
INTRODUCTION
This is legit one of the best indicators I can possibly make. Since I don't have access to tick data on tradingview I can't claim it's as accurate as possible but it is a very polished indicator for VWAP based trading and the bands are VERY useful for mean reverting trading.
QWAP Elite is an advanced Volume Weighted Average Price indicator that incorporates true order flow analysis through intrabar data decomposition. Unlike traditional VWAP indicators that simply calculate price multiplied by volume divided by total volume, this indicator attempts to identify the directional intent behind that volume by analyzing whether buying or selling pressure dominated each bar at a granular level.
The fundamental premise of this indicator is that not all volume is created equal. A bar with 10000 contracts where 8000 were aggressive buyers tells a very different story than a bar with 10000 contracts where 8000 were aggressive sellers, even if both bars close at the same price. Traditional VWAP treats these identically. QWAP attempts to weight the VWAP calculation based on this directional flow information.
This indicator was designed for traders who believe that institutional order flow leaves detectable footprints in price and volume data, and that identifying these footprints can provide an edge in determining likely future price direction. It is not a holy grail and it is not a replacement for proper risk management and trading discipline.
HOW THE INDICATOR WORKS
The True CVD Engine
The core of this indicator is its Cumulative Volume Delta calculation. Most indicators on TradingView approximate buying and selling volume by looking at whether a bar closed higher or lower than it opened. If the bar closed green, they assign all volume as buying volume. If it closed red, they assign all volume as selling volume. This is a crude approximation that misses significant nuance.
QWAP Elite uses the request security lower tf function to pull actual intrabar data. This means if you are on a 5 minute chart, the indicator is looking at the individual ticks or smaller timeframe bars that occurred within that 5 minute period. It then calculates how much volume occurred on up moves versus down moves within that bar, giving a much more accurate picture of whether buyers or sellers were more aggressive.
The Delta Ratio is calculated as the net delta divided by total volume, resulting in a value between negative one and positive one. A value of positive 0.6 means that 80 percent of volume was buying and 20 percent was selling. A value of negative 0.4 means that 70 percent was selling and 30 percent was buying. This ratio is then used to weight the VWAP calculation.
The intrabar precision is displayed in the dashboard as the number of bars analyzed. More bars means more granular data and theoretically more accurate delta calculation. The indicator automatically selects an appropriate lower timeframe based on your chart timeframe to balance accuracy with computational performance.
VIX Integration and Volatility Intelligence
The indicator pulls live VIX data and uses it to adjust its calculations dynamically. The VIX or CBOE Volatility Index represents the market expectation of 30 day forward looking volatility derived from SP500 option prices. When VIX is elevated, markets behave differently than when VIX is compressed.
Specifically, the indicator uses VIX to adjust the standard deviation bands around VWAP. In high volatility environments where VIX is above 25 or 30, the bands automatically widen to account for larger price swings. In low volatility environments where VIX is below 15, the bands tighten. This prevents false signals that would occur if static band widths were used across all market conditions.
The indicator also pulls VVIX which is the volatility of the VIX itself and VIX9D which is the 9 day VIX. By comparing VIX to VIX9D, the indicator can identify term structure conditions. When short term VIX is higher than longer term VIX, this is called backwardation and often indicates fear or stress in the market. When short term VIX is lower, this is contango and indicates complacency.
The VIX regime classification in the dashboard shows CALM when VIX is below 12, NORMAL between 12 and 20, ELEVATED between 20 and 30, and FEAR when above 30. Each regime suggests different trading approaches and position sizing considerations.
DETECTION SYSTEMS
Absorption Detection
Absorption occurs when large volume enters the market but price barely moves. This happens when one side is absorbing all the aggression from the other side. For example, if aggressive sellers are hitting the bid repeatedly but price is not dropping, it suggests there is a large buyer absorbing all that selling pressure. This often precedes reversals.
The indicator detects absorption by looking for bars with above average volume, below average range, and high wick ratios. A high wick ratio means the bar has long wicks relative to its body, indicating price moved but was pushed back. When these conditions coincide with strong delta in one direction, it suggests institutional absorption.
Liquidity Sweep Detection
Liquidity sweeps, also known as stop hunts, occur when price briefly exceeds a recent high or low to trigger stop losses, then reverses. Large traders need liquidity to fill their orders, and stops clustered above swing highs or below swing lows represent pools of liquidity they can tap into.
The indicator identifies sweeps by detecting when price exceeds the 5 or 20 bar high or low but closes back inside. A bull trap is identified when price sweeps above recent highs but closes below them, suggesting sellers trapped buyers who bought the breakout. A bear trap is the opposite, where price sweeps lows but closes above, trapping shorts.
Sweep detection is most useful when combined with delta analysis. A sweep with strong opposing delta, meaning price swept highs but delta was heavily negative, is a higher probability reversal signal than a sweep alone.
CVD Divergence Detection
Divergence between price and cumulative delta is one of the most reliable signals the indicator produces. When price is making higher highs but cumulative delta is making lower highs, it suggests that buying pressure is weakening even though price is still rising. This bearish divergence often precedes pullbacks or reversals.
Conversely, bullish divergence occurs when price makes lower lows but cumulative delta makes higher lows. This suggests that even though price is dropping, buying pressure is actually increasing, and sellers may be exhausted. These divergences are calculated over a 5 bar lookback period.
Stacked Imbalance Detection
Stacked imbalances occur when there are three or more consecutive bars with strong delta in the same direction. This represents sustained aggressive positioning by one side of the market. Three consecutive bars with delta above 0.5 suggests aggressive institutional buying. Three consecutive bars below negative 0.5 suggests aggressive institutional selling.
The count of consecutive imbalanced bars is displayed in the detection section. Four or more stacked imbalances is considered highly significant. This pattern often precedes continuation moves in the direction of the imbalance, as it suggests a committed directional player has entered the market.
Institutional Flow Detection
The indicator attempts to identify institutional activity by looking for the convergence of multiple factors. Specifically, it requires strong delta above 0.5 or below negative 0.5, volume persistence across multiple bars meaning above average volume for at least 2 to 3 bars in a row, and delta persistence meaning delta in the same direction for multiple consecutive bars.
When these factors align, the dashboard displays INST BUY or INST SELL instead of RETAIL. This classification should be viewed as a probability estimate rather than a certainty. Retail traders can produce similar patterns, and institutions can hide their activity. The designation is meant to highlight periods where the characteristics of flow are consistent with larger players.
ADAPTIVE WEIGHT SYSTEM
The indicator includes an adaptive system that automatically adjusts how much weight the CVD analysis has on the VWAP calculation. In quiet, low volatility markets, the CVD weight is reduced because the signal to noise ratio is lower. In active, high volatility markets with clear directional flow, the weight is increased.
The adaptation considers multiple factors including VIX regime, delta clarity meaning how strong and consistent the delta readings are, volume persistence, and time of day session weighting. The current adaptive weight is displayed in the dashboard and typically ranges from 0.05 to 0.50.
The adaptation speed setting controls how quickly the weight responds to changing conditions. A higher speed means faster adaptation but potentially more noise. A lower speed means smoother adaptation but potentially slower response to regime changes.
SESSION AWARENESS
Not all trading hours are equal. The indicator applies different weights to different trading sessions based on typical liquidity and reliability patterns. The open drive, which covers 9 30 to 10 30 AM Eastern time, receives a 1.4x weight multiplier because this is typically the highest volume and most directionally significant period of the day.
Power hour from 3 00 to 4 00 PM Eastern receives a 1.3x multiplier as institutional traders often execute their daily positioning in this final hour. The lunch hour from 11 00 AM to 2 00 PM receives a 0.9x multiplier due to typically lower volume and more choppy price action. Premarket receives 0.7x and after hours receives 0.5x due to thin liquidity and unreliable signals.
The current session is displayed in the dashboard header. Traders should consider reducing position sizes and widening stops during lower weight sessions, particularly premarket and after hours where the indicator readings are less reliable.
COMPOSITE SCORES
Bias Score
The Bias Score ranges from negative 100 to positive 100 and represents the indicators overall directional lean. It synthesizes delta analysis, VWAP momentum, and multi-timeframe confluence into a single number. A score above 50 indicates strong bullish bias. A score below negative 50 indicates strong bearish bias. Scores between negative 20 and positive 20 are considered neutral.
The visual bias meter in the dashboard shows this score as a bar that leans left for bearish or right for bullish. This provides an at a glance summary of the indicators current directional reading without needing to interpret multiple individual metrics.
Setup Quality Score
The Setup Quality Score ranges from 0 to 100 and measures how many factors are aligning to support a potential trade. It awards points for strong delta readings, volume persistence, multi-timeframe confluence, detection events like absorption or divergence, and favorable session timing. A score above 60 suggests multiple factors are confirming. A score below 30 suggests the setup lacks confirmation.
This score is designed to help traders filter trades. Rather than acting on every signal, traders can set a minimum quality threshold. For example, only taking trades when quality is above 50 will filter out lower probability setups. Higher thresholds mean fewer trades but potentially higher win rates.
Heat Score
The Heat Score measures overall market activity intensity and ranges from 0 to 100. It combines volume heat meaning how elevated current volume is relative to average, volatility heat based on ATR expansion or VIX levels, delta heat meaning how strong the current delta reading is, and deviation heat meaning how far price is from VWAP.
Markets with heat above 75 are classified as EXTREME and typically represent high opportunity but also high risk environments. Heat between 50 and 75 is ACTIVE and represents good trading conditions. Heat between 25 and 50 is NORMAL. Heat below 25 is QUIET and suggests range bound conditions where mean reversion strategies may outperform trend following.
DASHBOARD GUIDE
Header Row
The header row displays QWAP with a lightning bolt icon, the current session abbreviation like OPEN or POWER or LUNCH, the current regime classification, and VIX status with a colored indicator. Green indicates low VIX and favorable conditions. Yellow indicates elevated VIX. Red indicates high VIX or that VIX data is unavailable.
Signal Row
The signal row is the largest and most prominent element. It displays the primary signal which will be LONG, SHORT, REVERSAL, or WAIT. LONG appears when bias is strongly bullish and quality is high. SHORT appears when bias is strongly bearish and quality is high. REVERSAL appears when divergence or absorption is detected at an extreme sigma level. WAIT appears when conditions do not meet the threshold for a signal.
Next to the signal is the quality score displayed as Q followed by a number out of 100. This helps traders quickly assess how confirmed the signal is. A LONG signal with Q 72 is more compelling than a LONG signal with Q 45.
Order Flow Section
The delta row shows the current delta direction as BUY or SELL, the percentage strength, a visual indicator of strength with filled or empty circles, and an arrow indicating whether delta is accelerating or decelerating. The flow row shows whether activity is classified as INST BUY, INST SELL, or RETAIL, along with the number of intrabar data points used in the calculation.
Market Section
The heat row displays the heat score as a visual bar and numeric value. The vol row shows volatility state as EXPAND, COMPRESS, or NORMAL along with relative volume. The dist row shows distance from VWAP in sigmas and percentage, plus momentum direction.
Detection Section
This section only appears when detections are active. It displays warning icons next to detection types like BUY ABS, SELL ABS, BULL TRAP, BEAR TRAP, BULL DIV, BEAR DIV, BUY STACK, or SELL STACK. Each detection includes a score representing its strength or significance.
HOW TO USE THIS INDICATOR
Recommended Workflow
First, check the regime and session. If VIX is in FEAR mode or you are in premarket or after hours, consider reduced position sizing or waiting for better conditions.
Second, look at the primary signal and quality score. Signals with quality below 40 are low conviction. Consider requiring quality above 50 or 60 before acting.
Third, check the bias meter for overall directional lean. Ensure it aligns with your intended trade direction.
Fourth, review active detections. Absorption and divergence near VWAP bands increase reversal probability. Stacked imbalances support continuation.
Fifth, use VWAP and sigma bands for entry, stop, and target placement. The bands provide natural support and resistance levels based on statistical distribution.
Sixth, monitor for changes in delta and flow classification. Institutional activity transitioning to retail or delta reversing direction are warning signs.
TRADE EXAMPLES
Mean Reversion Setup
Price extended to 2.5 sigma above VWAP. Signal shows REVERSAL. Quality is 55. Absorption detected with BUY ABS showing score of 2.3. Delta is showing SELL at 45 percent despite price being elevated. This suggests buyers are being absorbed and a pullback to VWAP is likely. Enter short with stop above the 3 sigma band and target at VWAP or 1 sigma band.
Trend Continuation Setup
Signal shows LONG with quality 68. Bias meter shows STRONG BULL. BUY STACK detected with 4 consecutive imbalanced bars. Flow shows INST BUY. Price has pulled back to VWAP and is finding support. Heat is at 62 indicating ACTIVE conditions. Enter long on VWAP touch with stop below 1 sigma band and target at 2 sigma band.
Liquidity Sweep Setup
BEAR TRAP detected with score of 1.8. Price swept below recent lows but closed back above. Delta is showing BUY at 52 percent on the sweep bar. BULL DIV also active as price made lower low but delta made higher low. Signal shows REVERSAL with quality 58. Enter long with stop below the sweep low and target at VWAP.
HONEST ASSESSMENT OF STRENGTHS AND WEAKNESSES
Strengths
True CVD calculation using intrabar data is significantly more accurate than close greater than open approximations used by most indicators. This provides genuine insight into buying versus selling pressure.
VIX integration with term structure analysis is institutional grade thinking applied to a retail tool. Dynamic band adjustment prevents false signals in different volatility regimes.
Multiple detection systems provide different perspectives on the same market. Absorption, sweeps, divergence, and imbalances each capture different footprints of institutional activity.
Composite scores synthesize complex information into actionable numbers. Traders do not need to mentally integrate 15 different metrics. The quality score and bias score do this automatically.
Session awareness prevents trading during low quality periods. The automatic weighting helps filter out noise from premarket, after hours, and lunch periods.
Adaptive system self adjusts to market conditions. Traders do not need to manually tune parameters as volatility and activity change.
Weaknesses and Limitations
Intrabar data is still an approximation of true tick level order flow. Without actual tick data showing individual trades hitting bid versus lifting offer, even this calculation has error bars. Professional platforms like Sierra Chart or Quantower with direct exchange feeds will always have more accurate delta.
The indicator is computationally heavy. Users may experience slower chart loading particularly on lower end hardware or when viewing many bars. The optimization features help but cannot eliminate this cost entirely.
Institutional detection is probabilistic not definitive. Retail traders in aggregate can produce patterns that look institutional. Institutions can and do hide their activity. The INST BUY and INST SELL labels should be viewed as probability shifts not certainties.
The indicator works best on liquid instruments with significant volume. On thinly traded stocks or during illiquid periods, delta calculations become noisy and unreliable. The indicator is optimized for ES, NQ, SPY, QQQ, and similar high volume instruments.
VIX integration only works for US equity index products. If trading forex, crypto, or other asset classes, the VIX data is not directly applicable and should be disabled.
No indicator can predict the future. Order flow analysis shows what happened and what is happening. It cannot guarantee what will happen next. Large players can and do reverse their positioning. News events can invalidate any technical setup instantly.
The complexity of the indicator means there is a learning curve. New users may be overwhelmed by the number of metrics displayed. It takes time to develop intuition for what combinations of readings are significant.
The indicator does not include automated backtesting or historical performance statistics. Users cannot easily quantify the win rate or expected value of following its signals without manual journaling and analysis.
RISK MANAGEMENT GUIDELINES
This indicator is a tool not a trading system. It provides information that may help inform trading decisions but it does not make those decisions for you. Proper risk management is essential regardless of how compelling the indicator readings appear.
Position Sizing
Never risk more than 1 to 2 percent of your account on any single trade regardless of how high the quality score is. High quality setups still fail regularly. A setup with 70 percent win rate still loses 30 percent of the time, and those losses can come in clusters.
Consider reducing position size when VIX is in ELEVATED or FEAR regime, when trading during premarket or after hours sessions, when quality score is below 50, and when multiple detection systems are conflicting with each other.
Stop Loss Placement
The sigma bands provide natural levels for stop placement. For mean reversion trades, stops should typically be placed beyond the next sigma level. For example, if entering short at 2 sigma, place stop beyond 3 sigma. For trend trades entering at VWAP, consider stops beyond 1 sigma in the opposite direction.
Stops should also respect market structure. If there is a recent swing high or low near your calculated stop level, extend the stop beyond that swing point. Placing stops at obvious levels invites stop hunting.
In high VIX environments, consider wider stops. The VIX band multiplier automatically widens the sigma bands, and your stops should reflect this increased volatility. A stop that works in a 15 VIX environment may be too tight when VIX is 30.
Taking Profits
The sigma bands also provide natural profit targets. For mean reversion trades, VWAP itself is often the first target with the opposite 1 sigma band as an extended target. For trend trades, each sigma band can serve as a scaling point.
Pay attention to delta and flow changes as price approaches targets. If delta is weakening or flow classification shifts from institutional to retail, consider taking profits early. Conversely, if delta is strengthening into the target, consider holding for extension.
When to Avoid Trading
Consider sitting out when the signal shows WAIT and quality is below 30. In these conditions, the indicator is essentially saying there is no clear edge. Trading anyway is gambling not trading.
Avoid trading during major news events. The indicator cannot account for sudden information shocks. Economic releases, Fed announcements, earnings reports, and geopolitical events can invalidate any technical setup instantly.
Consider avoiding the first and last 5 minutes of regular trading hours. These periods often have erratic price action and unreliable delta calculations due to order imbalances at open and close.
SETTINGS REFERENCE
Core Engine Settings
VWAP Source determines what price is used for the VWAP calculation. The default HLC3 uses the average of high, low, and close which provides a balanced representation. HL2 uses just high and low average. Close uses only the closing price. Most traders should leave this at HLC3.
True CVD Engine should remain enabled for accurate order flow analysis. Disabling it falls back to close greater than open estimation which is significantly less accurate. Only disable if you are experiencing performance issues.
CVD Impact controls how much the delta analysis affects the VWAP calculation. Higher values mean delta has more influence. The default 0.2 provides a balance. Increase toward 0.5 if you want delta to have stronger effect. Decrease toward 0.1 if you want something closer to traditional VWAP.
Detection Sensitivity offers three presets. Conservative produces fewer signals but higher confidence. Balanced is the default middle ground. Aggressive produces more signals but with more false positives. New users should start with Balanced and adjust based on experience.
VIX Settings
VIX Integration should be enabled when trading US equity index products like ES, NQ, SPY, or QQQ. Disable it when trading forex, crypto, commodities, or individual stocks where VIX is not directly applicable.
VIX Symbol allows selection between VIX for SP500 volatility, VXN for Nasdaq volatility, and RVX for Russell 2000 volatility. Choose the one most relevant to your trading instrument.
VIX Baseline sets the historical average VIX level used for normalization. The default 16 represents the long term average. If trading in a persistently higher or lower VIX environment, adjusting this can help calibrate the regime classifications.
Display Settings
Dashboard Style offers three options. Compact shows only the signal and bias meter for minimal screen footprint. Elite adds order flow and market sections for balanced information. Full adds VIX details, detections, and adaptive system information for complete visibility.
FREQUENTLY ASKED QUESTIONS
Why does the indicator sometimes show WAIT when there is an obvious trend
The signal system is designed to identify high probability entry points not to constantly indicate trend direction. A strong uptrend may show WAIT because price is extended from VWAP and a pullback is likely before continuation. The indicator is trying to prevent you from buying the top of an impulse move.
Why is my delta reading different from another order flow tool
Different platforms calculate delta differently. Some use tick data. Some use time based aggregation. Some use volume based aggregation. The timeframe being analyzed matters as well. QWAP uses intrabar data which is more accurate than close versus open approximations but less accurate than true tick data from professional platforms.
Can I use this indicator for scalping
The indicator can be used on lower timeframes but becomes less reliable. On 1 minute charts, the intrabar decomposition has fewer data points to work with. For scalping, consider using 3 to 5 minute charts as a minimum. Also note that the session weighting and detection systems are calibrated for swing and intraday trading, not ultra short term scalping.
Does this indicator repaint
The VWAP line and sigma bands can adjust slightly as intrabar data comes in during a live bar. Once a bar closes, those values are fixed. The signals and detections are calculated on closed bars and do not repaint. For live trading, wait for bar close confirmation before acting on signals.
What markets does this work best on
The indicator is optimized for high liquidity US equity index products including ES, NQ, SPY, QQQ, IWM, and DIA. It can work on other liquid instruments but the VIX integration should be disabled for non equity products. Avoid using on low volume stocks or illiquid markets where delta calculations will be noisy.
DISCLAIMER
This indicator is provided for educational and informational purposes only. It is not financial advice. Past performance of any trading methodology is not indicative of future results. Trading futures, options, and other derivatives involves substantial risk of loss and is not suitable for all investors.
The creator of this indicator makes no guarantees about its accuracy or profitability. All trading decisions are the sole responsibility of the user. Before trading with real money, thoroughly test any strategy in simulation and ensure you understand the risks involved.
Order flow analysis provides information about market microstructure but cannot predict future price movements with certainty. Markets are complex adaptive systems influenced by countless variables including news events, economic data, central bank policy, geopolitical developments, and collective human psychology. No indicator can fully capture this complexity.
Use this tool as one input among many in your trading process. Combine it with sound risk management, proper position sizing, and continuous education. The best traders are those who remain humble about what they do not know and disciplined about protecting their capital.