Cerca negli script per "trend"

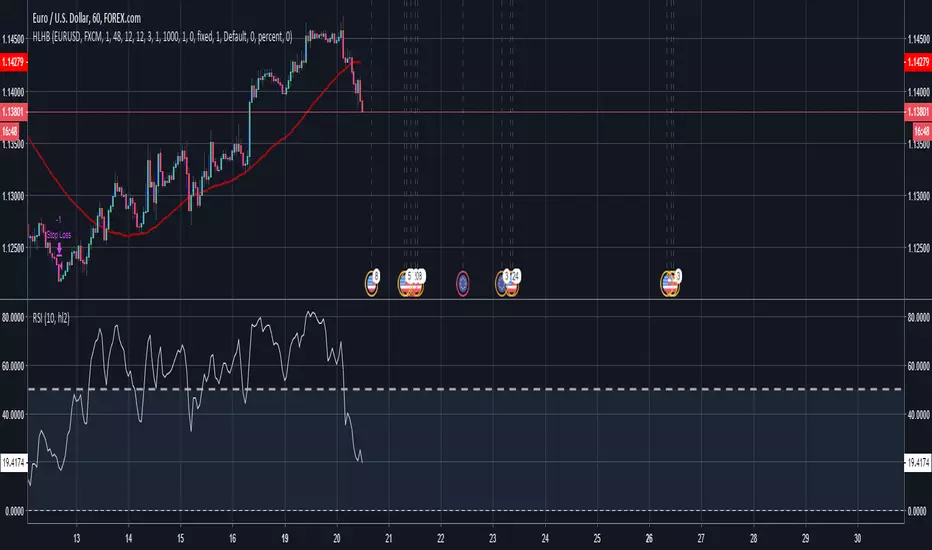
(Coming Soon) HLHB Trend-Catcher System from BabyPips.comThis is the HLHB Trend-Catcher System from BabyPips.com. Learn More about here: www.babypips.com
This version also has the November Update Learn More about it here: www.babypips.com
I would suggest using a 1 hour chart or 4 hour chart and some common sense.
I am not affiliated with BabyPips.com nor do I know the author who came up with this system. I have been using it for a little while know and like it. Feel free to tweak the code.
TREND Index -STOCHRSIIt is combination of my TREND Index indicator and STOCH RSI
You can reach more strategies in my profile
www.tradingview.com

Trend-Reverse Strategy
Trend-Reverse Strategy is a combination of these 2 scripts to use 5 min candle.


Noro's Trend MAs Strategy v2.3Don't use on pairs of type "crypto/crypto"!
Only for pairs like "crypto/fiat" ("BTC/USD", "BTC/CNY", "ETH/USD", "ETH/CNY", etc)
Trade strategy which uses only 2 MA.
The slow MA (blue) is used for definition of a trend
The fast MA (red) is used for an entrance to the transaction
For:
- For H1
- For crypto/fiat
- Good for "BTC/USD", "ETH/USD"
Recomended:
Long = true (if it is profitable as a result of backtests)
Short = true (if it is profitable as a result of backtests)
Stops = false
Stop, % = any
Use Fast MA = true
Fast MA Period = 5
Slow MA Period = 21
Bars Q = (2 for "bitcoin/fiat" or 1 for "crypto/fiat")
Extreme = true (if "crypto/fiat")
In the new version 2.3
+ Dates

Kama and HMA trend followerThis strategy is meant to be used to follow trending markets. Use of other methodologies to define or anticipatetrends will greatly enhance profits. Enjoy!

Noro's Trend MAs Strategy v1.7Trade strategy which uses only 2 MA.
The slow MA (blue) is used for definition of a trend
The fast MA (red) is used for an entrance to the transaction
For:
- For H1
- For crypto/fiat
Recomended:
Long = true (if it is profitable as a result of backtests)
Short = true (if it is profitable as a result of backtests)
Stops = false
Stop, % = any
Type of slow MA = 7 (only for Crypto/Fiat)
Source of slow MA = close or OHLC4
Use Fast MA = true
Fast MA Period = 5
Slow MA Period = 20
Bars Q = (2 for "BitCoin/Fiat" or 1 for "Fork/Fiat")
In the new version 1.7
+ stoporders
+ entry arrow (black)
Types of slow MA:
1 = SMA = Simple Moving Average
2 = EMA = Exponential Moving Average
3 = VWMA = Volume-Weighted Moving Average
4 = DEMA = Double Exponential Moving Average
5 = TEMA = Triple Exponential Moving Average
6 = KAMA = Kaufman's Adaptive Moving Average
7 = Price Channel

Noro's Trend MAs Strategy 1.5Trade strategy which uses only 2 MA .
The slow MA (blue) is used for definition of a trend
The fast MA (red) is used for an entrance to the transaction
For:
- For H1
- For crypto/fiat
Recomended:
Long = true (if it is profitable as a result of backtests)
Short = true (if it is profitable as a result of backtests)
Type of slow MA = 7 (only for Crypto/Fiat)
Source of slow MA = clole or OHLC4
Use Fast MA = true
Fast MA Period = 5
Slow MA Period = 20
Bars Q = (2 for "BitCoin/Fiat" or 1 for "Fork/Fiat")
In the new version 1.5
+ Source
+ Types of slow MA
Types of slow MA:
1 = SMA = Simple Moving Average
2 = EMA = Exponential Moving Average
3 = VWMA = Volume-Weighted Moving Average
4 = DEMA = Double Exponential Moving Average
5 = TEMA = Triple Exponential Moving Average
6 = KAMA = Kaufman's Adaptive Moving Average
7 = Price Channel
PS: 100000000%, because of use of a piramiding have turned out

Noro's Trend SMA Strategy v1.4Trade strategy which uses only 2 SMA .
The slow SMA (blue) is used for definition of a trend
The fast SMA (red) is used for an entrance to the transaction
Recomended:
For H1
For crypto/fiat
Long = true (if it is profitable as a result of backtests)
Short = true (if it is profitable as a result of backtests)
Use Fast SMA = true
Fast SMA Period = 5
Slow SMA Period = 20
Bars = (2 for "BitCoin/Fiat" or 1 for "Fork/Fiat")
In the new version 1.4
- Parameters are added
Russian:
Перевожу на понятный. В новой версии 1.4 ничего не поменялось в логике, работает так же. Но добавлены новые параметры, можно поэкспериментировать с настройками, убедиться как что выгоднее.
Есть галка лонг и шорт. По умолчанию обе включены. Если убрать галку лонг, то исчезнут лонги вообще, если убрать шорт, то соответственно исчезнут шорты. По идее галку надо будет снимать если стратегия создает убыточные шорты, то их можно отключить. Смотреть в сводке показателей тестера стратегий профитны они или нет. По идее почти на всех парах крипто/фиат лучше ставить обе галки. Или убирайте галку шорт если не хотите шортить из религиозных соображений.
Добавлена галка отключающая быструю SMA. То есть если галку убрать то стратегия будет её игнорировать. Таким образом, параметр Fast SMA (который 5) перестанет влиять на результаты. Однако, скорее всего без этой галки станет только хуже. Но можете проверить. Позволяет убедиться что входить в сделку по быстрой SMA в среднем немного профитнее, чем входить где попало.
"Bars" - количество свечек одного цвета после после которых будет открываться сделка. По умолчанию 2. Можно от 0 до 3 ставить. Если 0 то цвет свечек игнорируется. Если 3, значит будет ждать 3 красных свечи подряд чтобы открыть лонг. Так же и с зелеными свечами для шорта. 2 - оптимально для пар типа биткойн/фиат. А для пар типа форк/фиат лучше ставить 1 свеча в параметре "Bars".

Trend Shift Indicator (Strategy)Trend Shift Indicator Strategy
This strategy provides a means for testing the underlying algorithm contained in
Default is set such that the input is simple buy/sell, all/nothing, 1/0 shares.
I'm always happy to answer any questions you have (see contact information in my profile: www.tradingview.com
Any feedback is appreciated . Please let me know how this did in comparison to your favorite strategy!

BuyHighSellLow - Pivot pointsAnother version of buy-high sell-low strategy. This time using pivot points.
Strategy is simple:
Buy when price closes above R1 of pivot point level
Sell when price closes below S2 of pivot point level.
Use Resolution parameter to define pivot points. Higher the resolution, longer the trade time will be. If resolution is set to same as symbol, strategy will consider Higher Timeframe Multiplier to derive pivot point resolution.
Uncheck HideBands to see bands created from pivot points.
Another Buy-High Sell-Low strategy published is using donchian channel (Link below)

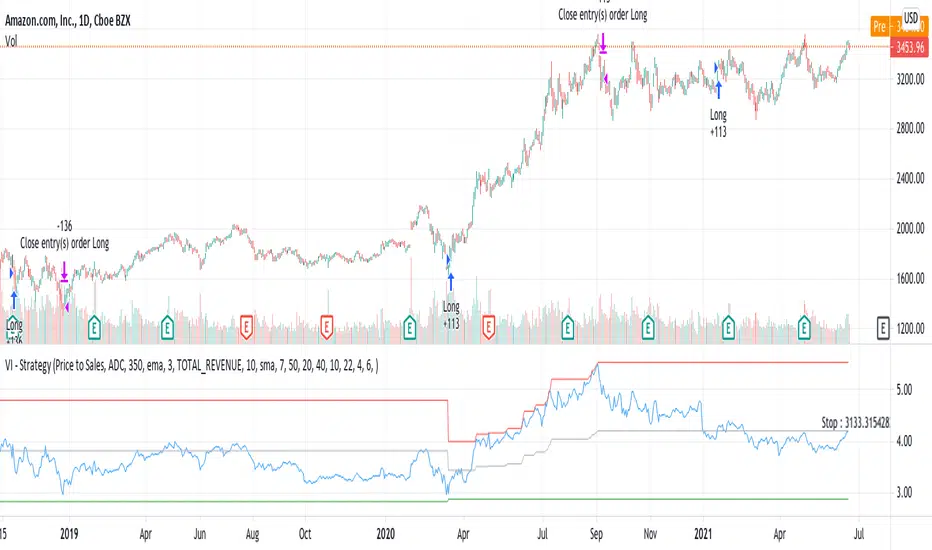
Value Investing StrategySimple fundamental investing strategy based on two factors - Value and Growth
Look for value factor at its 6 months lowest. (Change Length to alter this. Each unit represents 3 months)
Verify that selected growth factor is increasing. (Compare with moving average)
Optionally consider stocks only if Piotrovski-F-Score is above PfScoreLimit
Exit Strategy include:
Reversal - Sell when value factor is at 6 months peak.
Trailing - Trail with 2 ATR. Can be changed in settings.
Combined - Keep reducing upon value factor reaching 6 months high. But full exit happens when stop loss is hit.
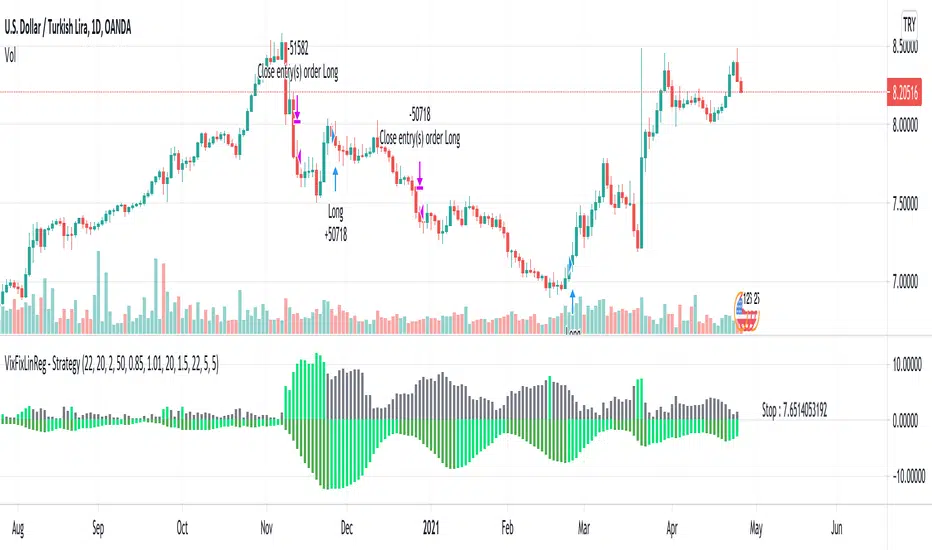
VixFixLinReg-StrategyThis idea came up while discussing about strategies with one of the trading enthusiast from tradingview community.
Strategy basically uses existing script of Vix Fix by Chris Moody:
VixFix is a great indicator for finding the market bottoms. But, sometimes it generates signal too early. But, we can apply linear regression on vix fix to find vix fix top to make timing much better.
Entry condition:
Wait for Vix fix bar to turn lime.
Once vix fix is turned lime, then wait for linear regression (shown below 0) to turn lime from green. This indicates VIX-Fix has started declining.
Go long once above two conditions are satisfied
Exit Condition:
ATR Based Stop
Applied only if linear regression is green - which means VixFix rising.
Note: This is ideal for identifying market bottom. May not yield good results on individual stocks.
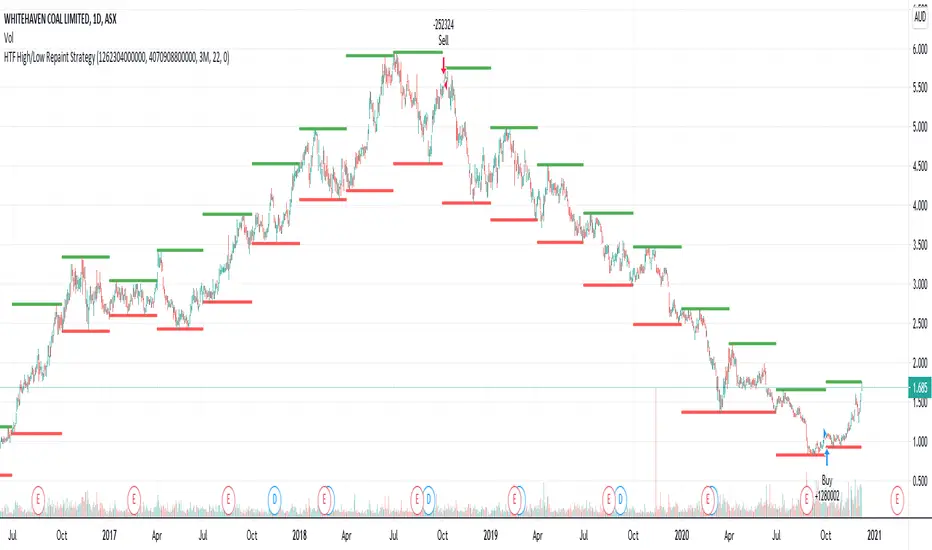
HTF High/Low Repaint StrategyHere is an another attempt to demonstrate repainting and how to avoid them. It happened few times to me that I develop a strategy which is giving immense returns - only to realize after few forward testing that it is repainting. Sometimes, it is well disguised even during forward testing.
In this simple strategy, conditions are as below:
Buy : When a 3M bar produces high and low higher than it's previous 3M bar high, low
Sell : When a 3M bar produces high and low lower than its previous 3M bar high, low.
Default setting is : lookahead = on and offset = 0
This means current 3M bar high low is plotted for all the daily bars within this month. Which means, strategy looks ahead of time to see this 3M bar high is higher than previous 3M bar high during the start of the first daily bar. Hence, this combination leads to massive repaint.
For example, trade made on October 2nd 2018 already knows well ahead of time that price is going to go down in next 3 months:
Similarly, after 2 years on October 2nd 2020 - the strategy already knows that last 3M high is going to be breached on 7th December 2020
Solution: If you are using security for higher timeframes, safer option is always to use offset 1. Further details in the trading view script:
BUT
It may still repaint if we are passing function to security.
For example:
f_secureSecurity(_symbol, _res, _src) => security(_symbol, _res, _src , lookahead = barmerge.lookahead
This function will likely avoid any repainting with Higher timeframe if we are passing in built variables such as high, low, close, open etc. But, if we try to pass supertrend, this will not produce right results. This is because supertrend calculation in turn uses high/low/close values which do not consider the offset while calculating. Hence, even with offset 1, this will still produce issues.
Hence, the call:
= f_secureSecurity(syminfo.tickerid, derivedResolution, supertrend(3,10), offset) will again lead to massive repainting. Solution to this is to implement supertrend function and use high, low, close values derived from secureSecurity.
Quick tips to identify or be suspicious about repainting
Unbelievable results on all timeframes and all instruments with both long and short trades
Lower timeframes giving significantly higher returns on backtest when compared to higher timeframe
If these things happen, be wary about repainting and do a through check of all security function usage in your strategy.
All the best :)
PS: Apply 3-5 days resolution and see the fun. Also, WHC is one hell of a Christmas tree. Could have made immense profit in the same strategy even without repainting.
Higher TF - Repainting + Limiting backtest resultsThis strategy is for illustration purpose only. Do not use this as there is massive repainting.
As usual, I was experimenting with adding different entry/exit filters to my main strategy. Thought of adding higher frame filter, picked the code for getting higher time frame supertrend from someone else's script and copied it without thinking much about it.
security(syminfo.tickerid, f_multiple_resolution(HTFMultiplier), supertrend(SupertrendMult, SupertrendPd), lookahead = true, gaps=true)
Started getting better results with this result. I was very much impressed and while trying to enhance further, I started disabling my other entry and exit filters which I generally use.
That worked pretty well without any of my other filters. Hence, thought I will forward test this on a smaller timeframe.
To my surprise, even in forward testing, i was not able to notice repainting very much. It also appeared that smaller timeframes yielded better results. (This wasn't the case with any of my strategies)
Which then prompted me to study the security function and lookahead and gap parameters. Learned that lookahead and gap when set to true will lead to massive repainting - specially if you are using higher timeframes. Hence, these parameters are not advisable to use in strategies.
Further information here: www.tradingview.com
I added three repaint options to further illustrate how security function will work:
Yes : Use security with lookahead and merge set to true
No - set lookahead false : Use security with lookahead and merge set to false
No - do not use security : Falls back to original command on current timeframe. Switch timeframe to HTF resolution to compare the difference.
Conclusion : Always set lookahead and gaps to false when using security function in strategies.
PS: Script also contains code to limit backtesting to certain days/months/years. This can be used as is in other scripts.

BuyTheDipWell, I often had arguments in online forum with a guy who claimed to time the market perfectly without any technical analysis or prior experience. He often claimed that technical analysis does not work and it only works when you trade on other's emotions. He also argued that algorithmic trading isn't profitable - if so, everyone would do that. Hence, I thought I will convert his idea to algorithm.
In his own words, the strategy is as below:
Chose an instrument which is in full uptrend.
Wait for the panic sell and buy the dip
Once market recovers back exit immediately
It seems to do just fine with indexes. But, not so good when it comes to stocks.

AlignedMA and Cumulative HighLow StrategyCombining the indicators:
1. Aligned Moving Average Index :
2. Cumulative High Low Index :
3. Supertrend
Works best in long only for crypto and precious metals.
My scenario is to present how much you can earn by investing 1000 for full 10 years. Hence, I am using fixed 1000 initial deposit and 100% equity per trade without any pyramiding. This allows us to compare gains to buy and hold.

Trend ShotBTCUSD -- 5 min or 15 min (recommended)
BUY POSITION
1 : Ema 50 must be above ema 200
2 : The macd should show a buy sign
3 : Multiple RSI should show a buy sign
4 : Multiple fast EMA should show a sign of buy
SELL POSITION
1 : Ema 50 must be below ema 200
2 : The macd should show a sell sign
3 : Multiple RSI should show a sell sign
4 : Multiple fast EMA should show a sell sign

[strategy] XBT Stable Max Profit Swing StrategyTrend following strategy indicators through trend analysis.
Minimized loss trading when the price is going sideway, which is a disadvantage of the trend following strategy.
Optimized for XBTUSD 4H.
This indicator is never repainted like other fake indicators.
For replaying to check this indicator repaints or not,
2-day trial period is provided.
* description about the setting factors
- A factors (trend detecting lengths)
A-Factor1: short term checking period
A-Factor2: mid term checking period
A-Factor3: long term checking period
- B factors (factors of detecting trend changing)
B-Factor1: determine detection of trend changing periods
B-Factors2: strength on short trend changing
B-Factors3: strength on long trend changing
- C factors (detecting divergence factors)
C-Factor1: total long divergence value for detecting long signal
C-Factor2: numeric value of each long divergence
C-Factor3:total short divergence value for detecting short signal
C-Factor4:numeric value of each short divergence
* The default setting is recommended, but it is also possible to optimize by setting the details of the three category settings.
(Trade points of settings A, B, and C factors are displayed in the transaction history to help tuning)
* For detailed backtesting, a backtesting period can be set.
* Note: Backtesting results do not guarantee future results.
* This indicator is an invite only indicator.
* If you want to use this indicator, contact with my information below.

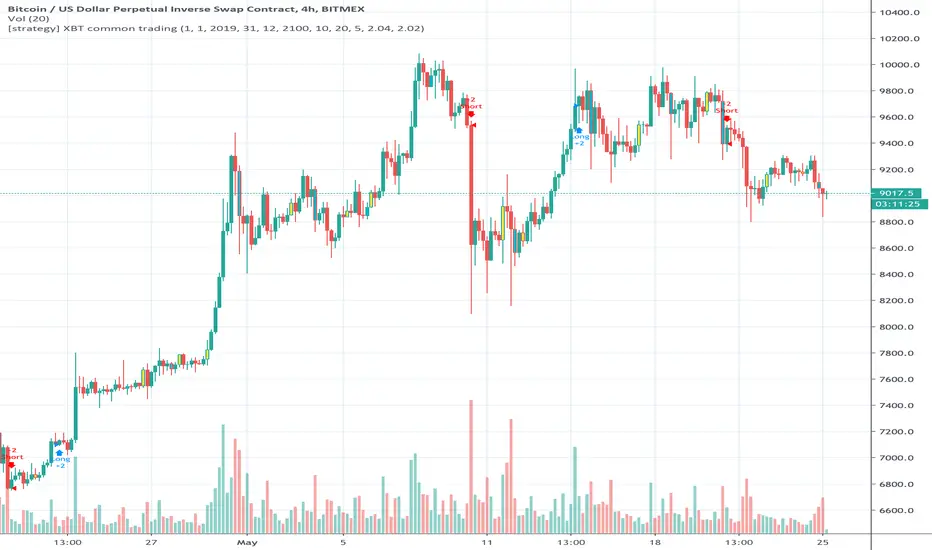
[strategy] XBT common tradingTrend following strategy for XBTUSD .
Optimized for XBTUSD 4H chart
* Description of indicator setting
Trend Channel Length: determine trend channel length (bars)
Trend Average Length: determine length of measuring average price (bars)
Trend Period: period of detecting trend changing
Strength Short: exceeding strength of trend changing (short)
Strength Long: exceeding strength of trend changing (long)
* default setting is recommended, but you can optimize or change trading pattern by changing setting values
* backtesting results do not guarantee future results.
If you want to use this strategy, contact me with my profile information below.
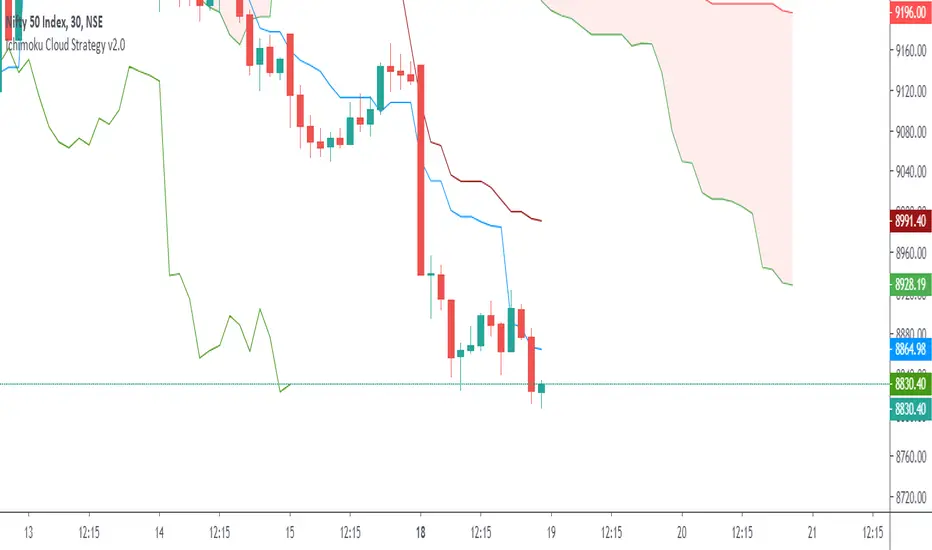
Ichimoku Cloud Strategy v2.0Trend following trading strategy “Ichimoku Crossover” is a popular Ichimoku trading strategy that uses the cloud and crossover of two base lines to define the market reverse point. Ichimoku crossover trading strategy has appeared to be a profitable trading strategy.
The indicator has 5 base lines and to read Ichimoku indicator it is required to understand the meaning of these lines first of all:
Tenkan-Sen line, also called the Conversion Line, represents the midpoint of the last 9 candlesticks . It is calculated with the following Ichimoku formula: .
Kijun-Sen line, also called the Base Line, represents the midpoint of the last 26 candlesticks . It is calculated with the following formula: .
Chiou Span, also called the Lagging Span, lags behind the price (as the name suggests). The Lagging Span is plotted 26 periods back.
Senkou Span A, also called the Leading Span A, represents one of the two Cloud boundaries and it’s the midpoint between the Conversion Line and the Base Line: . This value is plotted 26 periods into the future and it’s the faster Cloud boundary.
Senkou Span B, or the Leading Span B, represents the second Cloud boundaries and it’s the midpoint of the last 52 price bars: . This value is plotted 52 periods into the future and it is the slower Cloud boundary.
Trading with Ichimoku is very simple.
The Conversion Line needs to break above the Base Line. This will be a buy signal.
For a bearish (sell) signal a trader should wait for the Conversion line crosses the Base line downwards it is a sell signal.
RS BreakoutsTrend breakout/following strategy
this strategy is ALWAYS IN THE MARKET
you will have drawdown during sideways price action
Works on virtually all markets/assets that like to trend (mainly crypto and stocks) - higher timeframes over 1H only!
