Cerca negli script per "trend"

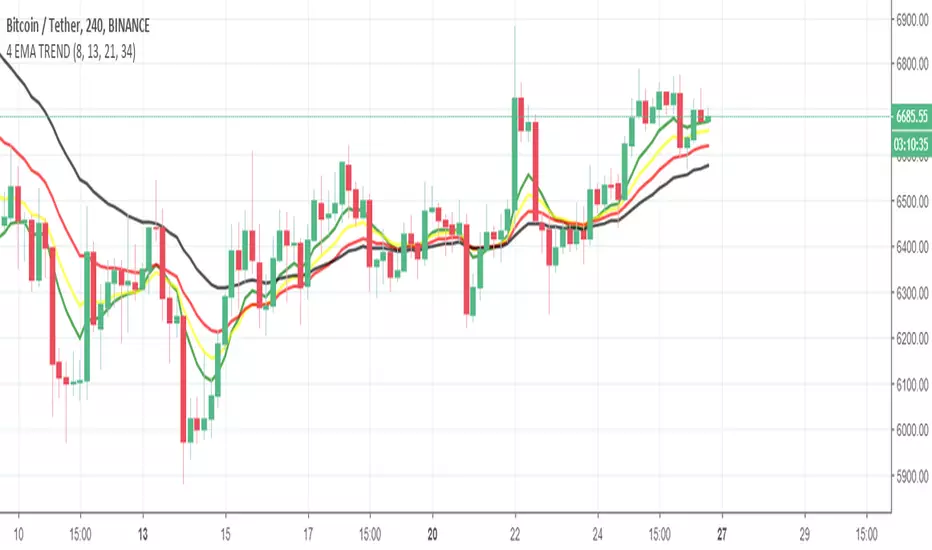
4 EMA TREND INDICATORİf GREEN > YELLOW > RED > BLACK
UPWARD TREND
If BLACK > RED > YELLOW > GREEN
DOWNWARD TREND
In upward trend , if green(fastest ema) crossunder YELLOW or RED or both of them , you can close the position . Dont wait the Downward Trend.
Lengths of EMAs are based on Fibonacci numbers ( 8,13,21,34) , if you want, you can change it based on your strategy.
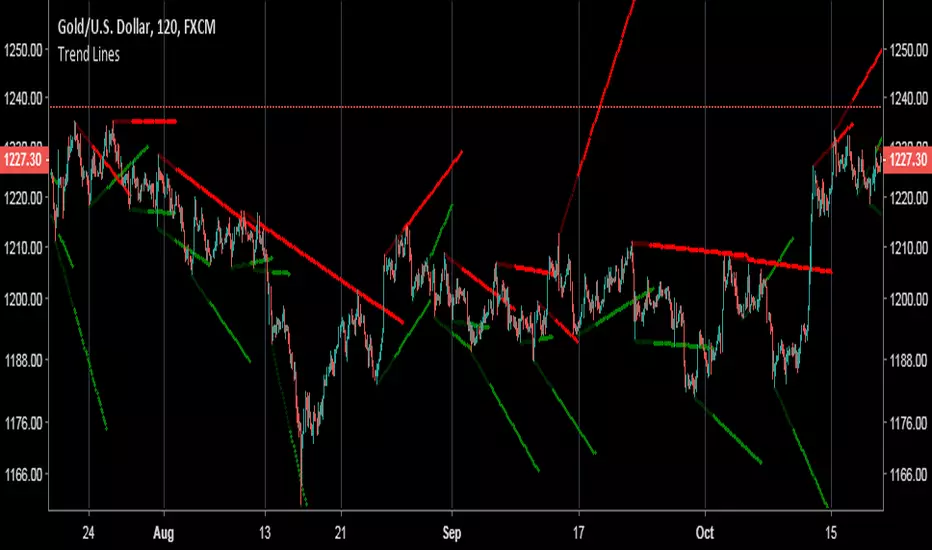
Free Trend Lines Tool/IndicatorI don't trade much with trend lines, but I was bored so made this hopefully someone will make use of it or program a strategy with it or something like that. It finds the highs and lows, works out the distance in time and price, then uses that to calculate the angle of the trend which can be used to pain the trend line. If you have any questions on how to implement it into a strategy feel free to ask. It is written in quite a messy wayt so sorry about that.
120/60 Trend ModelCombination of 120 & 60 EMAs used to determine entries as well as the over all trend.
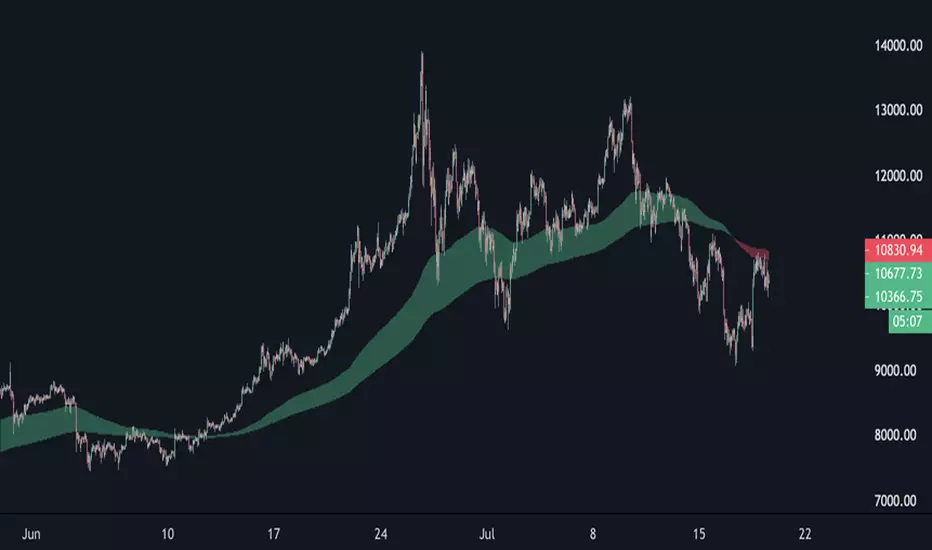
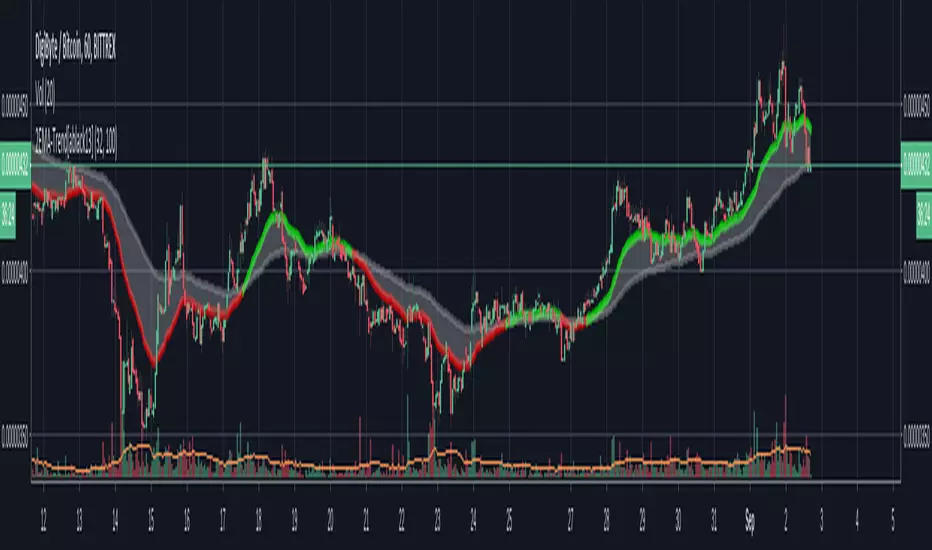
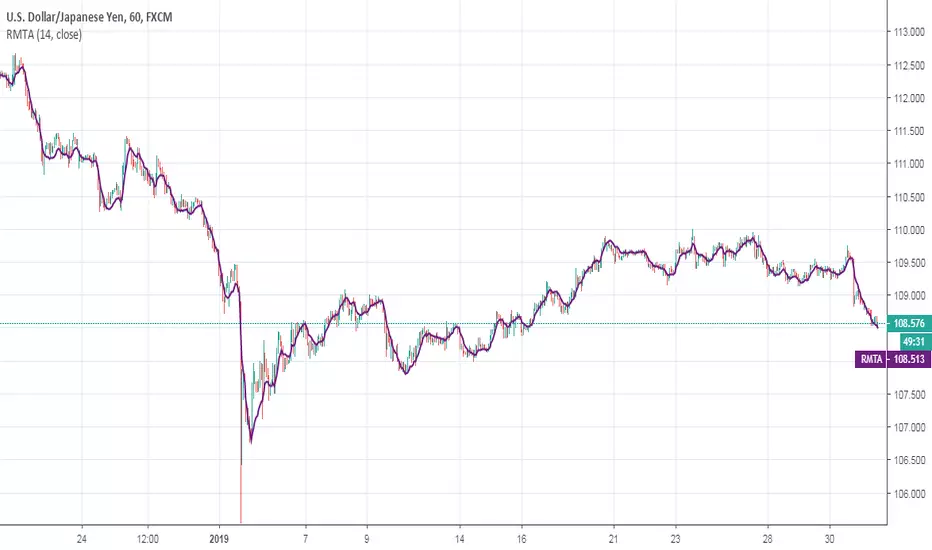
Recursive Moving Trend AverageRecursive Moving Trend Average indicator script.
This indicator was originally developed by Dennis Meyers (Stocks & Commodities V.16:12, The Yen, Recursed).
Noro's Trend MAs Strategy v2.3Don't use on pairs of type "crypto/crypto"!
Only for pairs like "crypto/fiat" ("BTC/USD", "BTC/CNY", "ETH/USD", "ETH/CNY", etc)
Trade strategy which uses only 2 MA.
The slow MA (blue) is used for definition of a trend
The fast MA (red) is used for an entrance to the transaction
For:
- For H1
- For crypto/fiat
- Good for "BTC/USD", "ETH/USD"
Recomended:
Long = true (if it is profitable as a result of backtests)
Short = true (if it is profitable as a result of backtests)
Stops = false
Stop, % = any
Use Fast MA = true
Fast MA Period = 5
Slow MA Period = 21
Bars Q = (2 for "bitcoin/fiat" or 1 for "crypto/fiat")
Extreme = true (if "crypto/fiat")
In the new version 2.3
+ Dates

Kama and HMA trend followerThis strategy is meant to be used to follow trending markets. Use of other methodologies to define or anticipatetrends will greatly enhance profits. Enjoy!


Ichimoku Cloud (Log-Space) - perfect trend areaLog space ichimoku cloud which display perfect bearish trend and perfect bullish trend.
Noro's Trend MAs Strategy v1.7Trade strategy which uses only 2 MA.
The slow MA (blue) is used for definition of a trend
The fast MA (red) is used for an entrance to the transaction
For:
- For H1
- For crypto/fiat
Recomended:
Long = true (if it is profitable as a result of backtests)
Short = true (if it is profitable as a result of backtests)
Stops = false
Stop, % = any
Type of slow MA = 7 (only for Crypto/Fiat)
Source of slow MA = close or OHLC4
Use Fast MA = true
Fast MA Period = 5
Slow MA Period = 20
Bars Q = (2 for "BitCoin/Fiat" or 1 for "Fork/Fiat")
In the new version 1.7
+ stoporders
+ entry arrow (black)
Types of slow MA:
1 = SMA = Simple Moving Average
2 = EMA = Exponential Moving Average
3 = VWMA = Volume-Weighted Moving Average
4 = DEMA = Double Exponential Moving Average
5 = TEMA = Triple Exponential Moving Average
6 = KAMA = Kaufman's Adaptive Moving Average
7 = Price Channel

Noro's Trend MAs Strategy 1.5Trade strategy which uses only 2 MA .
The slow MA (blue) is used for definition of a trend
The fast MA (red) is used for an entrance to the transaction
For:
- For H1
- For crypto/fiat
Recomended:
Long = true (if it is profitable as a result of backtests)
Short = true (if it is profitable as a result of backtests)
Type of slow MA = 7 (only for Crypto/Fiat)
Source of slow MA = clole or OHLC4
Use Fast MA = true
Fast MA Period = 5
Slow MA Period = 20
Bars Q = (2 for "BitCoin/Fiat" or 1 for "Fork/Fiat")
In the new version 1.5
+ Source
+ Types of slow MA
Types of slow MA:
1 = SMA = Simple Moving Average
2 = EMA = Exponential Moving Average
3 = VWMA = Volume-Weighted Moving Average
4 = DEMA = Double Exponential Moving Average
5 = TEMA = Triple Exponential Moving Average
6 = KAMA = Kaufman's Adaptive Moving Average
7 = Price Channel
PS: 100000000%, because of use of a piramiding have turned out

Noro's Trend SMA Strategy v1.4Trade strategy which uses only 2 SMA .
The slow SMA (blue) is used for definition of a trend
The fast SMA (red) is used for an entrance to the transaction
Recomended:
For H1
For crypto/fiat
Long = true (if it is profitable as a result of backtests)
Short = true (if it is profitable as a result of backtests)
Use Fast SMA = true
Fast SMA Period = 5
Slow SMA Period = 20
Bars = (2 for "BitCoin/Fiat" or 1 for "Fork/Fiat")
In the new version 1.4
- Parameters are added
Russian:
Перевожу на понятный. В новой версии 1.4 ничего не поменялось в логике, работает так же. Но добавлены новые параметры, можно поэкспериментировать с настройками, убедиться как что выгоднее.
Есть галка лонг и шорт. По умолчанию обе включены. Если убрать галку лонг, то исчезнут лонги вообще, если убрать шорт, то соответственно исчезнут шорты. По идее галку надо будет снимать если стратегия создает убыточные шорты, то их можно отключить. Смотреть в сводке показателей тестера стратегий профитны они или нет. По идее почти на всех парах крипто/фиат лучше ставить обе галки. Или убирайте галку шорт если не хотите шортить из религиозных соображений.
Добавлена галка отключающая быструю SMA. То есть если галку убрать то стратегия будет её игнорировать. Таким образом, параметр Fast SMA (который 5) перестанет влиять на результаты. Однако, скорее всего без этой галки станет только хуже. Но можете проверить. Позволяет убедиться что входить в сделку по быстрой SMA в среднем немного профитнее, чем входить где попало.
"Bars" - количество свечек одного цвета после после которых будет открываться сделка. По умолчанию 2. Можно от 0 до 3 ставить. Если 0 то цвет свечек игнорируется. Если 3, значит будет ждать 3 красных свечи подряд чтобы открыть лонг. Так же и с зелеными свечами для шорта. 2 - оптимально для пар типа биткойн/фиат. А для пар типа форк/фиат лучше ставить 1 свеча в параметре "Bars".

Angular Trend [DW]This is an experimental study designed to outline the trend of a security based on the average angular change of price.
New lines are drawn whenever the source's angle of change is equal to zero.
Trend Strength IndicatorThis indicator uses Heiken Ashi candle data to plot trend strength signals to your chart.
Bright Green: Heiken Ashi candle data is still putting in higher lows and higher highs, and the price closed above the previous low.
Dark Green: Heiken Ashi candle closed green, but had a lower low or lower high (trend weakening).
Bright Red: Heiken Ashi candle data is still putting in lower lows and lower highs, and the price closed below the previous high.
Dark Red: Heiken Ashi candle closed red, but had a higher low or higher high (trend weakening).
Optional: I included a setting for allowing high RSI values to overrule Heiken Ashi values (disabled by default).
This kind of indicator is best used for managing open positions rather than entering trades. It works on all timeframes and instruments.
Feel free to contact me if you have any questions :)
Regards,
- Matt
PS. Here's a snapshot of it against a Heiken Ashi chart for reference:
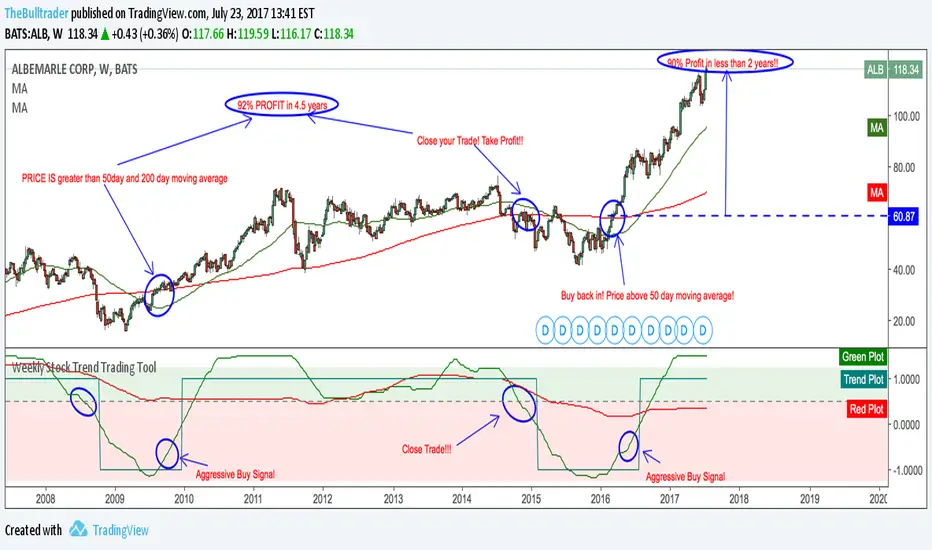
Weekly Stock Trend Trading Tool// Created by TheBullTrader, 2017.
// Hi everyone, welcome to my Weekly Trend Trading Tool with the 50 day and 200 day moving averages
// This indicator scores each stock/ index individually and scores them on a simple scale -1.5 to +1.5
// This indicator has 2 zones: green zone = bullish, and red zone = bearish
// There are 3 plots: green = 50 day sma, red = 200 day sma, and trend signal= teal
// Buying Signal is when the green plot crosses teal plot or AGGRESSIVE Buy = green plot beginning to curve up from bearish zone.
// Sell Signal is when the green plot enters the RED ZONE
// By using this indicator as described, it will help you pick stock bottoms and COULD GET YOU OUT OF A STOCK CRASH!
// Recommendations is to scan this indicator against the top 100 US stocks with a long stock history greater than 10 years.
// I usually find 5-10 really good deals every few months. Slow and Easy way to build wealth. **Thanks for reading**
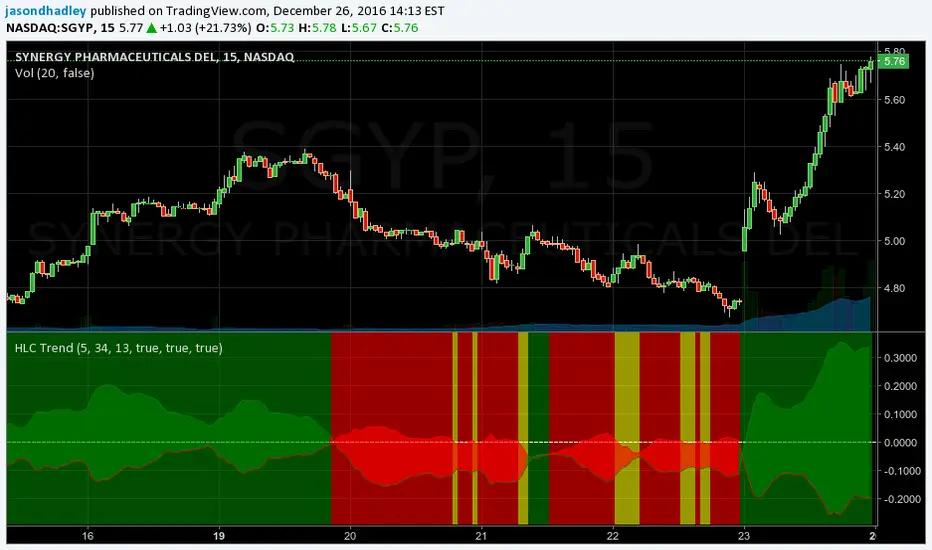
HLC Trend IdentifierIdentifies trends based on a comparison of a High, Low, and Close moving average.
Optionable: By default the Moving Average type is set to EMA but is switchable to a SMA instead.
Optionable: By default it shows cloud coloring of Green or Red based on crossover points.
Optionable: By default it colors the indicator background:
- Green = uptrend
- Red = downtrend
- Yellow = neutral
Romi Trend and Momentum Oscillator
Great oscillator which determines trend and momentum. So accurate it could be used as a stand alone indicator.

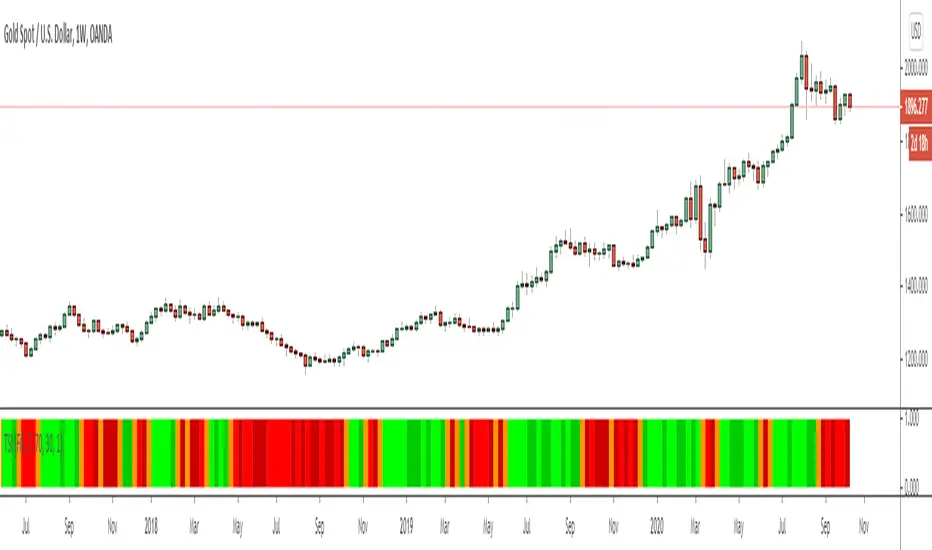
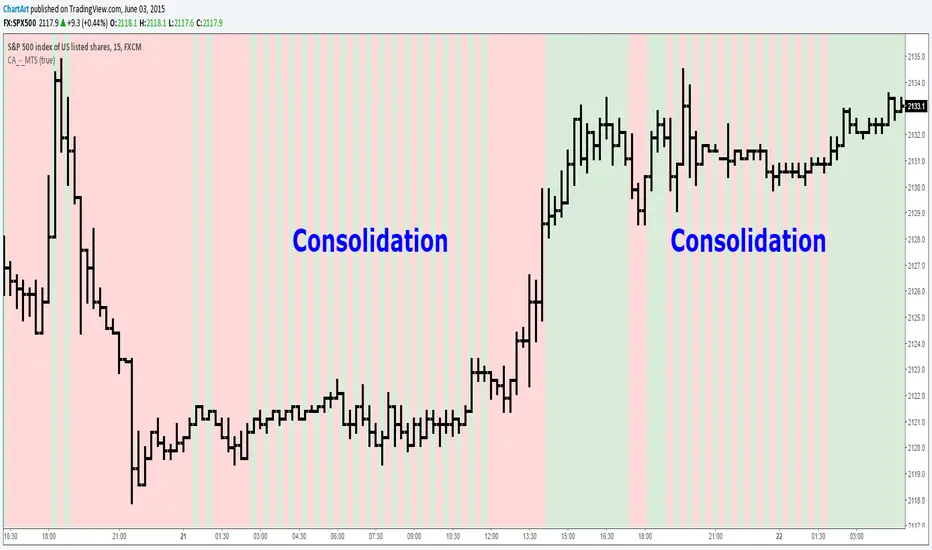
Market Trend Strength (MTS) (by ChartArt)See the current trend strength of the market. An additional filter makes trend consolidation areas visible. The color changes there each bar back and forth between green and red.
This area was interesting. Would have been a better example:
If the filter is deactivated the indicator shows the last measured price trend (green for up and down for red).
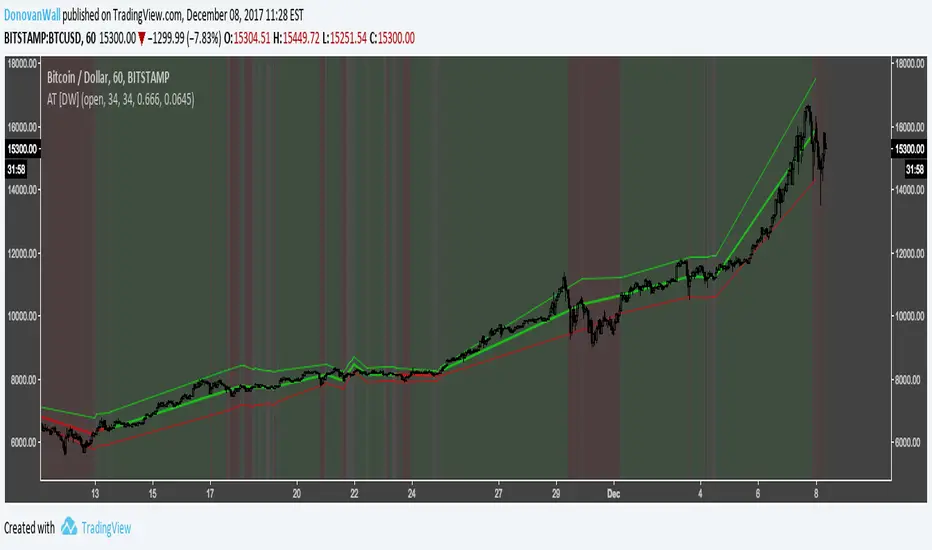
Trend Trader Strategy This is plots the indicator developed by Andrew Abraham
in the Trading the Trend article of TASC September 1998

BuyHighSellLow - Pivot pointsAnother version of buy-high sell-low strategy. This time using pivot points.
Strategy is simple:
Buy when price closes above R1 of pivot point level
Sell when price closes below S2 of pivot point level.
Use Resolution parameter to define pivot points. Higher the resolution, longer the trade time will be. If resolution is set to same as symbol, strategy will consider Higher Timeframe Multiplier to derive pivot point resolution.
Uncheck HideBands to see bands created from pivot points.
Another Buy-High Sell-Low strategy published is using donchian channel (Link below)

Historical Range (Using eStrategy library)⬜ The script is intended to cover few things.
▶ Strategy testing framework based on eStrategy library
▶ Using historicalrange of values for identifying better entry and exits.
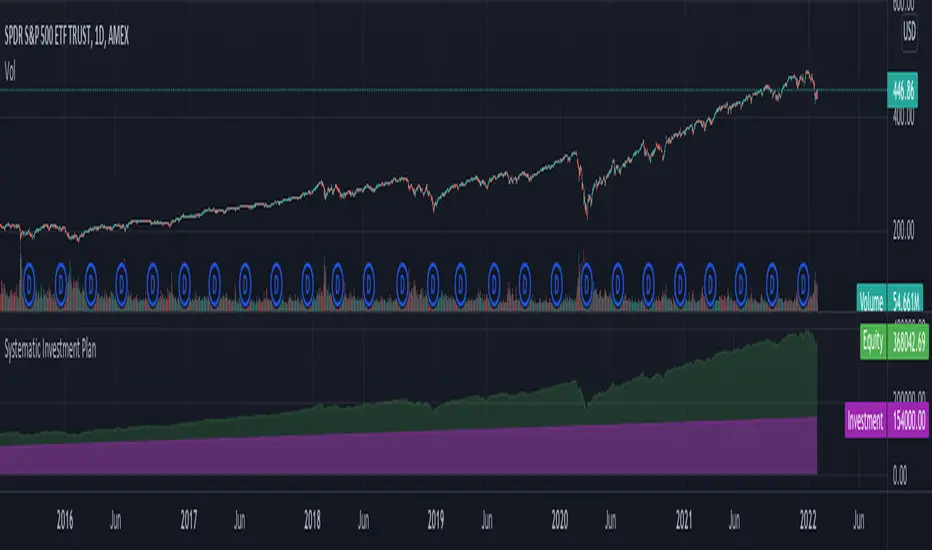
This is also built on top of the Systematic Investment Plan script published here
⬜ Strategy testing framework
Strategy testing framework is different from tradingview default strategy testing from few ways to suit the needs of systematic investments.
▶ Supports recurring investment on top of initial investment to emulate adding further funds to the investment bucket on regular basis.
▶ Better calculation of drawdowns based on daily equity rather than drawdown calculated only on close of trade.
▶ Provides better control over how much strategy can reduce and reload
Having said that, this framework is not intended as replacement for tradingview strategy framework. It is not as comprehensive as tradingview strategy framework. But, created to address few specific styles of strategy.
▶ No detailed trade stats on individual trades. But, this can be implemented in future versions
▶ At present only facilitates long positions.
▶ UI features such as plotting trades on chart are not available.
▶ Does not take into consideration of slippage and brokerage - this is not an issue because the framework is not meant for short term trades. It is only made for daily timeframes.
▶ No pyramiding or leverage possible.
And many more...
Framework can be used for similar strategies based on market timing with few small changes.
⬜ Historical Range Strategy
Concept here is, instead of taking indicators such as oscillators as is, use historical percentile to derive better oversold and overbought conditions. Strategy provides different options to base historical range. This can either be based on
▶ Band percent
▶ Oscillator
Different choices of bands and oscillators are also available to chose. However, have not done extensive testing on all the combinations.
⬜ Settings
▶ Initial and recurring investment settings (As confirm inputs)
▶ Buy and hold and strategy specific settings to be used for stat calculation
▶ Band and oscillator parameters
These are straightforward parameters which is used for defining the base of either bands or oscillators.
▶ Percentile moving average parameter
Percentile MA is used with Percentile to find entry and exit signals based on crossover and crossunder.
Feedbacks and suggestions welcome.

Systematic Investment PlanTradingview default strategy tester has few limitations. To name some:
Tradingview default strategy tester does not have option for periodic investment.
Does not allow reduce and refill kind of operations.
Comparison to buy and hold equity does not take into consideration on number of days invested
Hence, I created this as base for my further experiments with respect to strategies involving market timing.
Settings are quite simple and self explanatory.