OPEN-SOURCE SCRIPT
Aggiornato Trend Strength Indicator
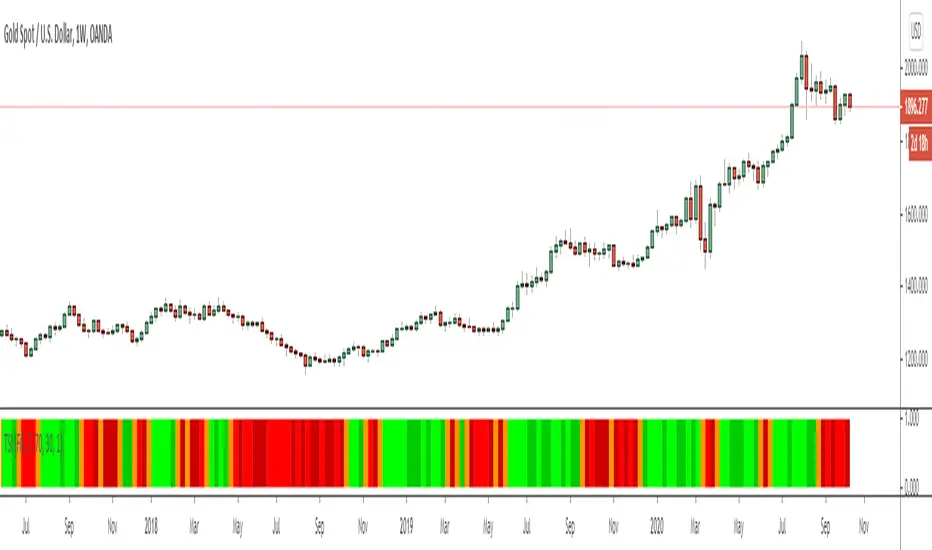
This indicator uses Heiken Ashi candle data to plot trend strength signals to your chart.
Bright Green: Heiken Ashi candle data is still putting in higher lows and higher highs, and the price closed above the previous low.
Dark Green: Heiken Ashi candle closed green, but had a lower low or lower high (trend weakening).
Bright Red: Heiken Ashi candle data is still putting in lower lows and lower highs, and the price closed below the previous high.
Dark Red: Heiken Ashi candle closed red, but had a higher low or higher high (trend weakening).
Optional: I included a setting for allowing high RSI values to overrule Heiken Ashi values (disabled by default).
This kind of indicator is best used for managing open positions rather than entering trades. It works on all timeframes and instruments.
Feel free to contact me if you have any questions :)
Regards,
- Matt
PS. Here's a snapshot of it against a Heiken Ashi chart for reference:
Note di rilascio
Added -1 offset value to trend strength bars so that they align properly with candles.Note di rilascio
- Turned RSI override on by default to improve trend strength signal accuracy.Note di rilascio
Added ability to reference higher timeframeNote di rilascio
Removed HTF functionality as repainting issues were creating problems.Indicator no longer repaints, and only uses the current timeframe data for signals.
Note di rilascio
-- Converted to Pine Script version 4
- Several minor code improvements & optimizations
- Added candle offset (0 = use current bar data, 1 = use previous bar data)
Note di rilascio
Updated to Pine Script v5Note di rilascio
Updated to pine script v6Script open-source
In pieno spirito TradingView, il creatore di questo script lo ha reso open-source, in modo che i trader possano esaminarlo e verificarne la funzionalità. Complimenti all'autore! Sebbene sia possibile utilizzarlo gratuitamente, ricorda che la ripubblicazione del codice è soggetta al nostro Regolamento.
My Resources Hub: theartoftrading.com
FREE YouTube Lessons: rebrand.ly/zyt
FREE Pine Script Basics Course: rebrand.ly/zpsbc
Pine Script MASTERY Course: rebrand.ly/zpsmc
My Indicators & Strategies: rebrand.ly/zmisc
FREE YouTube Lessons: rebrand.ly/zyt
FREE Pine Script Basics Course: rebrand.ly/zpsbc
Pine Script MASTERY Course: rebrand.ly/zpsmc
My Indicators & Strategies: rebrand.ly/zmisc
Declinazione di responsabilità
Le informazioni ed i contenuti pubblicati non costituiscono in alcun modo una sollecitazione ad investire o ad operare nei mercati finanziari. Non sono inoltre fornite o supportate da TradingView. Maggiori dettagli nelle Condizioni d'uso.
Script open-source
In pieno spirito TradingView, il creatore di questo script lo ha reso open-source, in modo che i trader possano esaminarlo e verificarne la funzionalità. Complimenti all'autore! Sebbene sia possibile utilizzarlo gratuitamente, ricorda che la ripubblicazione del codice è soggetta al nostro Regolamento.
My Resources Hub: theartoftrading.com
FREE YouTube Lessons: rebrand.ly/zyt
FREE Pine Script Basics Course: rebrand.ly/zpsbc
Pine Script MASTERY Course: rebrand.ly/zpsmc
My Indicators & Strategies: rebrand.ly/zmisc
FREE YouTube Lessons: rebrand.ly/zyt
FREE Pine Script Basics Course: rebrand.ly/zpsbc
Pine Script MASTERY Course: rebrand.ly/zpsmc
My Indicators & Strategies: rebrand.ly/zmisc
Declinazione di responsabilità
Le informazioni ed i contenuti pubblicati non costituiscono in alcun modo una sollecitazione ad investire o ad operare nei mercati finanziari. Non sono inoltre fornite o supportate da TradingView. Maggiori dettagli nelle Condizioni d'uso.