Volume-rsi-wmaThis indicatr give all the best on Volume study
RSI Volume (blue line)
vWMA (black line)
and V volume
MA volume (in bars)
have fun
Cerca negli script per "volume"

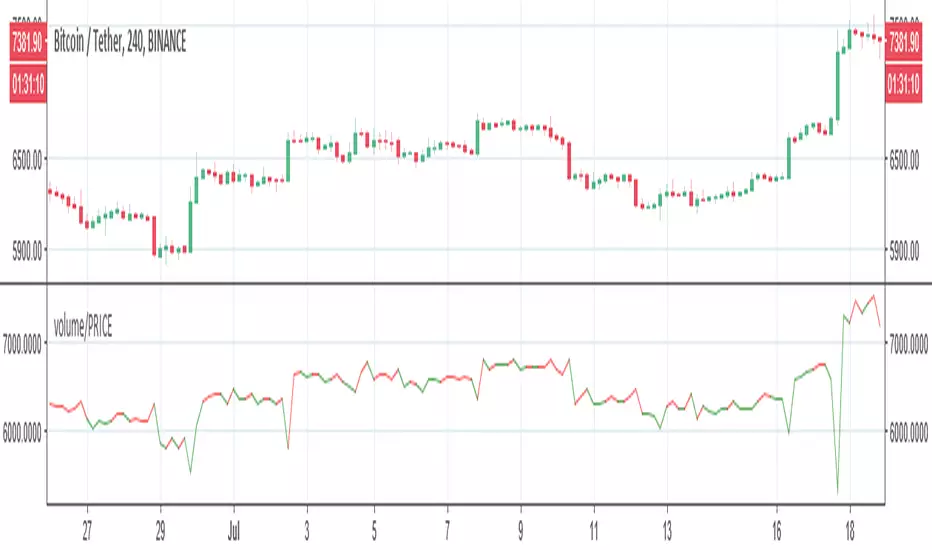
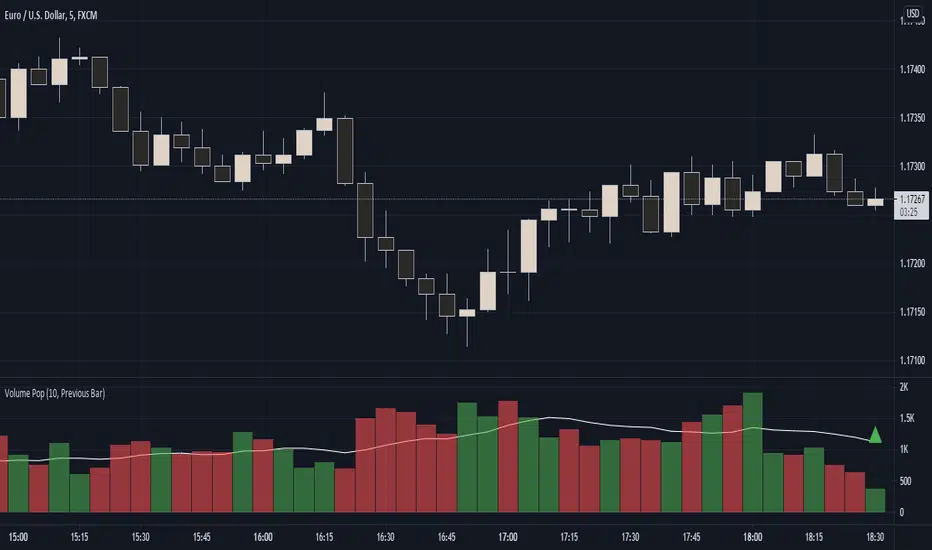
Volume/Pricethis is simple volume indicator by price
see the following trend- when the candle is red there is spike in volume before the rise up and next green candle. the indicator will deflect down with green -the stronger the volume the stronger the down deflection, the next bar will be green and strong up.
with down it will be opposite
Volume w/ Threshold and Editable MA PeriodJust a simple script that tweaks the original Volume one.
The purpose is creating a threshold which we'll use to put an alert on. This way, we can be notified whether Volume pumps.
Useful for spotting breakouts, breakdowns and pumps.
Threshold is simply a coeff * ma(volume,period). Coeff is editable as well.
Hope this helps!

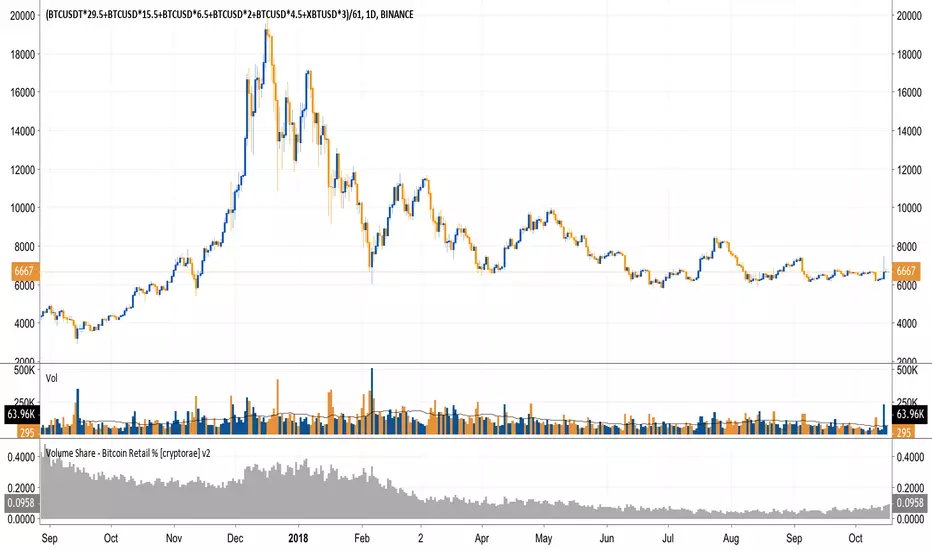
Volume Share - Bitcoin Retail % [cryptorae]I've been keeping my eyes on retail BTC trading volume as a % of total BTC trading volume (charted).
It's the single best chart showing the death of sentiment in this bear market. Retail fell to as low as 5.6% on 6/8. The good news is that the % has stabilized at these levels.
I think retail interest will need to trend higher in tandem with higher price moves for us to break through key resistance levels.
To know why, let's look closer at the anatomy of the recent bull and bear market.
In the 2017 bull market:
- Retail interest trended higher or sideways with each drive up
- Average retail volume share was ~46%
In other words, price movements were dominated by infusions of new money.
In the 2018 bear market:
- Retail interest trended LOWER with each recovery in price
- Average retail volume share was ~15%
In other words, price movements were dominated by money exchanging through the hands of traders.
Open thoughts:
- If the bear market persists and prices reach critical levels, I think that retail % would spike as some finally rush for the exit and new investors happily jump in
- If prices recover w/o a sustained increase in retail %, I'd not be so quick to call a bull market
Things I classify as "retail":
- Bitflyer
- Bithumb
- Coinbase
- Bistamp
- Kraken
Things classified as "non-retail"
- Bitmex
- Bitfinex
The formula is retail / (retail + non-retail)
The script is open for you to modify if you disagree. Let me know your thoughts/tweaks.
Quote asset VolumeVolume expressed in quote asset units. For pair DOGE/BTC the volume is shown in BTC, instead of DOGE.
Values are imprecise, because each candle's price is calculated as (O+H+L+C)/4, instead of a weighted average one, which I couldn't obtain.
Volume in BTC v2I made this indicator to display the volume in BTC in the top left. I find it useful to quickly get the idea of how much BTC is being traded in each pair. It also showing the 7 candle moving average volume in BTC. This is configurable tho.
Please note, this is my first script, and after activating it you will get two annoying lines on your chart. You will have to open the indicators setting and disable those lines manually until i figure out how to do it in the script. Anyway, its a minor issue. I hope you will still enjoy the indicator. Have a nice day.

Volume in BTCThis is an experimental script i made for tracking volume in BTC on poloniex pairs. I am not a developer, i hardly even know how to code, so im sure there is a better way! I shared the script on request from someone else. I made the line 100% transparant because i only want the number in the top left. Have a nice day.

Volume SpikesPlots volume the same as the built-in indicator. However, this indicator colors the column according to its change relative to the previous column. In other words, this indicator displays a green column on increased volume and a red bar on decreased volume.

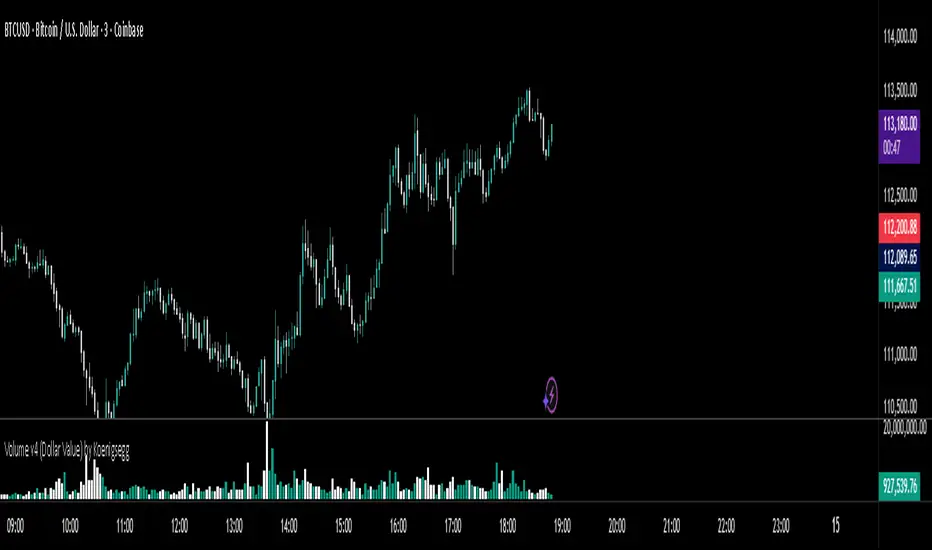
Volume v4 (Dollar Value) by Koenigsegg📊 Volume v3 (Dollar Value) by Koenigsegg
🎯 Purpose:
Volume v3 (Dollar Value) by Koenigsegg transforms traditional raw-unit volume into dollar-denominated volume, revealing how much money actually flows through each candle.
Instead of measuring how many coins or contracts were traded, this version calculates the total traded value = volume × average price (hlc3), allowing traders to visually assess capital intensity and market participation within each move.
⚙️ Core Features
- Converts raw volume into USD-based traded value for each candle.
- Color-coded bars show bullish (green/teal) vs. bearish (red) activity.
- Built-in SMA and SMMA overlays highlight sustained shifts in value flow.
- Designed for visual clarity to support momentum, exhaustion, and divergence studies.
📖 How to Read It
Rising Dollar Volume — indicates growing market participation and strong capital flow, often aligning with impulsive waves in trend direction.
Falling Dollar Volume — signals waning interest or reduced participation, potentially hinting at correction or exhaustion phases.
Comparing Legs — when price makes new highs/lows but dollar volume weakens, it can reveal divergences between price movement and actual capital commitment.
SMA / SMMA Lines — use them to identify longer-term accumulation or depletion of market activity, separating short bursts from sustained inflows or outflows.
The goal is to visualize the strength of market moves in terms of capital energy, not just tick activity. This distinction helps traders interpret whether a trend is being driven by genuine money flow or low-liquidity drift.
⚠️ Disclaimer
This script is provided for research and educational purposes only.
It does not constitute financial advice, investment recommendations, or trading signals.
Always conduct your own analysis and manage your own risk when trading live markets.
The author accepts no liability for financial losses incurred from use of this tool.
🧠 Credits
Developed and published by Koenigsegg.
Written in Pine Script® v6, fully compliant with TradingView’s House Rules for Pine Scripts.
Licensed under the Mozilla Public License 2.0.
Volume Weighted Average Price Dynamic Slope [sgbpulse]VWAP Dynamic Slope: A Comprehensive Indicator for Trend Identification and Smart Trading
Introducing VWAP Dynamic Slope, an innovative TradingView indicator that harnesses the power of Volume Weighted Average Price (VWAP) and enhances it with immediate visual feedback. The indicator colors the VWAP line based on its slope, allowing you to quickly and easily identify the direction and strength of the current trend for the asset, providing advanced tools for in-depth analysis.
What is VWAP and Why is it so Important?
VWAP (Volume Weighted Average Price) is an indicator that represents the average price at which an asset has traded, weighted by the volume traded at each price level. Unlike a simple moving average, VWAP gives greater weight to trades executed with high volume, making it a reliable measure of the asset's "true" or "fair" price within a given period. Many institutional traders use VWAP as a central reference point for evaluating the effectiveness of entries and exits. An asset trading above its VWAP is considered to have bullish momentum, and below it – bearish momentum.
How it Works: Dynamic VWAP Slope Analysis
VWAP Dynamic Slope analyzes the inclination of the VWAP line and displays it using an intuitive color scheme:
Positive Slope (Uptrend): When the VWAP points upwards, signaling positive momentum, the default color will be green.
Negative Slope (Downtrend): When the VWAP points downwards, signaling negative momentum, the default color will be orange.
Trend Change (CHG): When a change in the VWAP's trend direction occurs, a "CHG" label will be displayed. The label's color will be green if the change is to an uptrend, and orange if the change is to a downtrend.
Identifying Steep Slopes for Increased Momentum:
The indicator's uniqueness lies in its ability to identify "steep" slopes – rapid and particularly strong changes in the VWAP's direction. This indicates exceptionally strong momentum:
Steep Positive Slope: The VWAP color will change to dark green, indicating significant buying pressure.
Steep Negative Slope: The VWAP color will change to dark red, indicating significant selling pressure.
Dynamic Momentum Strength Label: In situations of steep slope (positive or negative), a dynamic label will be displayed with the change value of the VWAP at that point. This label allows you to monitor momentum strength, intensification, or weakening in real-time.
Advanced Analytical Tools for Complete Control
VWAP Dynamic Slope provides you with unprecedented flexibility through a variety of customizable tools:
Multiple VWAP Anchors and Visual Marking:
Common Time Anchors: Choose whether the VWAP resets at the beginning of each Session (daily), Week, Month, Quarter, Year, Decade, or Century.
Advanced Intraday Anchors: Within the Session, you can choose to calculate VWAP specifically for Pre-Market, Regular Hours, and Post-Market hours. This option is particularly crucial for intraday traders.
Important Event Anchors: The indicator allows for VWAP resets at significant milestones such as Earnings, Dividends, and Splits, for analyzing the market's immediate reaction.
Visual Anchor Marking: To enhance clarity and orientation, a Label ⚓ can be displayed at each selected anchor point, helping to immediately identify the start point of the VWAP calculation in the chosen context.
Customizable Bands (Up to Three on Each Side):
Add up to three Bands above and below the VWAP to identify areas of deviation and excursion from the average price. You have two calculation options:
Standard Deviation: Based on volatility and statistical distance from the VWAP.
Percentage: Defines fixed percentage-based bands from the VWAP.
Key Pre-Market Levels (Pre-Market High/Low):
Display the Pre-Market High and Low levels as separate lines on the chart. These lines often serve as important psychological support and resistance zones, allowing you to see how the VWAP behaves near them.
Full Customization and Precise Control:
VWAP Source Selection: Determine which price data type will be used for the VWAP calculation. The default is HLC3 (average of High, Low, and Close), but any other relevant data source available in TradingView can be selected.
Offset: Set an offset for the VWAP line, allowing you to shift it left or right on the time axis by a chosen number of bars.
Customizable Colors: Choose your preferred colors for each slope state, Pre-Market High/Low lines, and Bands.
Setting the "Steepness" Threshold (Per-mille Price Change Per Minute ‱/min with Auto-Adjustment): Determine the sensitivity for identifying a steep slope by setting the required change threshold in VWAP in terms of per-mille price change per minute (‱/min). The indicator performs smart adjustment for any timeframe you select on the chart (e.g., 30 seconds, 1 minute, 5 minutes, 10 minutes, etc.), ensuring that the "steepness" setting maintains consistency and relevance.
Examples for Setting the Steepness Threshold:
Suppose you set the steepness threshold to 0.3‱/min (per-mille price change per minute).
On a 30-second chart: The indicator will check if the VWAP changed by 0.15 ‱/min (half of the per-minute threshold) within a single bar. If so, the slope will be considered steep. Explanation: Since 30 seconds is half a minute, the indicator looks for a change that is half of the threshold set for a full minute.
On a 1-minute chart: The indicator will check if the VWAP changed by 0.3 ‱/min (the full per-minute threshold) within a single bar. If so, the slope will be considered steep. Explanation: Here, the bar represents a full minute, so we check the full threshold.
On a 5-minute chart: The indicator will check if the VWAP changed by 1.5 ‱/min (5 times the per-minute threshold) within a single bar. If so, the slope will be considered steep. Explanation: A 5-minute bar contains 5 minutes, so the cumulative change in VWAP needs to be 5 times greater to be considered "steep" on the same scale.
In summary, this setting allows you to precisely and uniformly control the sensitivity of steep slope detection across all timeframes, providing immense flexibility in analyzing the asset's momentum.
Advantages of Using Per-mille Price Change Per Minute (‱/min)
Using per-mille price change per minute (‱/min) offers several key advantages for your indicator:
Normalized and Objective Measurement: It provides a uniform scale for the VWAP's rate of change, regardless of the asset's price or nominal value. A 0.1 per-mille change per minute always carries the same relative significance.
Comparison Across Different Asset Prices: Using per-mille allows for direct comparison of VWAP movement strength between assets trading at very different prices (e.g., a $100 asset versus a $1 asset), enabling an understanding of true momentum without bias from the nominal price.
Smart Timeframe Agnostic Adjustment: This is a critical capability. The indicator automatically adjusts the per-mille per minute threshold you set to any chart timeframe (30 seconds, 1 minute, 5 minutes, etc.), maintaining consistency in "steepness" detection without manual recalibration.
Precise Momentum Identification: This measurement precisely identifies when the VWAP's rate of change becomes significant, and when momentum strengthens or weakens, contributing to more informed trading decisions.
In short, per-mille change per minute (‱/min) provides accuracy, consistency, and flexibility in identifying VWAP momentum changes, with smart adaptation across all timeframes.
Who is this Indicator For?
VWAP Dynamic Slope is a powerful tool for:
Intraday Traders: For quick identification of intraday trend directions and momentum across any timeframe, with specific consideration for Pre-Market, Regular Hours, or Post-Market VWAP, and incorporating key pre-market levels.
Swing Traders and Long-Term Investors: For analyzing longer-term trends based on periodic and event-driven VWAP anchors.
Beginner Traders: As an excellent visual aid for understanding the relationship between price, volume, and trend direction, and how different anchor points, pre-market levels, and data sources influence price behavior.
Experienced Traders: For integration with existing strategies, gaining additional confirmation for trend strength identification, and highly precise and flexible parameter calibration.
VWAP Dynamic Slope provides a rich, multi-dimensional layer of information about the VWAP, helping you make more informed trading decisions in real-time, within the context of your chosen asset.

Volume-Time Imbalance (VTI)Volume-Time Imbalance (VTI) – Indicator Description
This indicator measures the imbalance between traded volume and the time elapsed between bars to identify unusual spikes in volume per second (volume per unit of time). Its purpose is to highlight volume movements that may indicate moments of strong interest, acceleration, or reversal in the market.
How it works:
It calculates the traded volume divided by the time (in seconds) elapsed since the previous bar — thus obtaining the volume per second.
An EMA (exponential moving average) of this volume per second is calculated to smooth the data.
The VTI value is the ratio between the current volume per second and this moving average, showing if the current volume is above what is expected for that pace.
The higher the VTI, the greater the imbalance between volume and time, indicating possible bursts of activity.
Settings:
VTI Moving Average Length: The period of the moving average used to smooth the volume per second (default is 20).
Alert Thresholds: Alert levels to identify moderate and high imbalances (defaults are 1.5 and 2.0).
Show VTI Histogram: Displays the VTI histogram in the indicator window.
Color Background: Colors the indicator background based on the strength of the imbalance (orange for moderate, red for high).
Show Alert Arrows: Shows arrows below the chart when a strong volume spike occurs (high alert).
Interpretation:
VTI values above the moderate level (1.5) indicate an unusual increase in volume relative to time.
Values above the high level (2.0) signal strong spikes that may anticipate significant moves or trend changes.
Use the colors and arrows as visual confirmations to quickly identify these moments.

Volume Delta Imbalance Index [PhenLabs]📊 Volume Delta Imbalance Index (VDII)
Version: PineScript™ v6
Description
The Volume Delta Imbalance Index is an advanced technical analysis tool that combines volume profile analysis with price movement dynamics to identify significant market imbalances. It features a sophisticated analysis system that weighs recent versus historical volume delta imbalance patterns, providing traders with insights into potential market reversals and trend continuation scenarios.
Points of Innovation:
Custom volume delta calculation incorporating price and volume relationships
Adaptive smoothing system based on market volatility
Multi-component analysis combining flow, acceleration, and strength metrics
Real-time volume profile integration with historical context
🔧 Core Components
Volume Profile Analysis: Dynamic volume delta imbalance distribution assessment
Flow Imbalance Detection: Buy/sell pressure evaluation
Strength Analysis: Composite market strength measurement
Acceleration Framework: Volume movement dynamics
Statistical Bands: Adaptive threshold system
🚨 Key Features 🚨
The indicator provides comprehensive analysis through:
Volume Delta: Up to date volume imbalance measurement
Market Structure: Support/resistance level identification
Flow Analysis: Buy/sell pressure visualization
Acceleration Signals: Movement momentum detection
Adaptive Bands: Dynamic overbought/oversold levels
📈 Visualization
Color-coded Columns: Shows direction and strength of imbalance
Signal Lines: Strong buy/sell level indicators
Statistical Bands: Shows normal trading ranges
Gradient Fills: Indicates extreme market conditions
Dynamic Opacity: Reflects trend strength
📌 Usage Guidelines
The indicator offers several customization options:
Basic Settings:
Lookback Period: Analysis timeframe adjustment
Sensitivity Level: Signal response calibration
History Depth: Historical context range
Memory Setting: Recent vs. historical data weight
Visual Settings:
Color Scheme: Bullish/bearish signal colors
Signal Levels: Strong buy/sell thresholds
Band Display: Statistical range visualization
✅ Best Use Cases / Things To Look For:
Wait for establishment in the initial trend when the VDII comes back towards zero and the color of the volume becomes more faint
Once this is established and the VDII pushes through to the other side look for small retracements above the zero line on the VDII leading you to believe it is a likely area for price to retrace and continue in its prior direction
Make sure you see the volume bars become more faint in color to give yo further confluence price will continue in its priorly established direction
⚠️ Limitations
Requires sufficient volume data
Most effective in liquid markets
Historical depth affects calculation speed
Possible lag in highly volatile conditions
What Makes This Unique
Composite Volume Analysis: Combines multiple volume metrics
Adaptive Calculation: Adjusts to market volatility
Profile Integration: Incorporates volume profile analysis
Multi-component Scoring: Weighted analysis system
Memory-efficient Design: Optimized for real-time analysis
🔧 How It Works
The indicator processes market data through four main components:
1. Volume Profile Analysis:
Creates dynamic volume delta distribution profiles
Weights recent versus historical data
Identifies significant price levels
2. Flow Imbalance Detection:
Analyzes buying versus selling pressure
Calculates normalized flow ratios
Determines market bias
3. Strength Analysis:
Measures composite market strength
Incorporates volume-weighted movements
Provides trend strength indication
4. Final Score Calculation:
Combines all components with weighted importance
Applies volatility-based smoothing
Generates final signal output
5. VDII Potential Reversal Confluences
Bars between signal confluence is default set to 10 but you can change it to whatever you’d prefer
Signals are a compiled look at the indicator as a whole determining where it think reversals or retracements are likely
💡 Note:
The indicator performs best in markets with consistent volume and clear trending or ranging conditions. Its sophisticated volume analysis provides valuable insights into market dynamics beyond traditional price-based indicators.

Volume Highlighter in main by RSUThis indicator is displayed in the main picture, which saves the space of a picture indicator.
Volume is highlighted to allow you to focus more on the above-average volume , and if it is greater than 4 times standard deviation it is marked as a huge volume in yellow. There will be support and resistance at this level.
There is a switch to show the turnover.

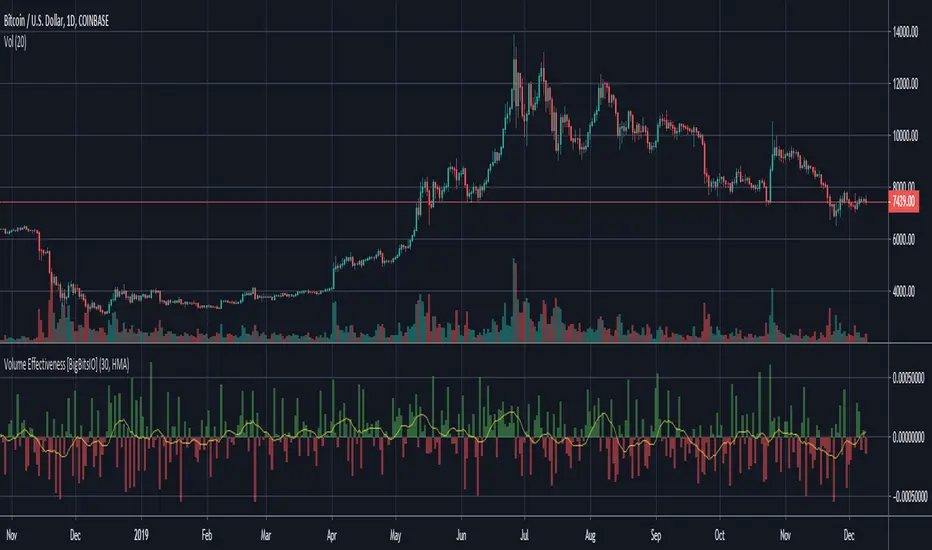
Volume Effectiveness [BigBitsIO]This Volume Effectiveness indicator is designed to allow users to try and identify how effective volume is on each candle, and smoothing those values over time to try to find trends.
Volume Effectiveness is the % change in price for each single unit of volume on the associated candle. The value can be positive or negative, but there is an option to just monitor an absolute value.
Features:
- Volume Effectiveness
- Toggle if Volume Effectiveness should be an absolute value
- Toggle visibility of bars
- Smoothed moving average of Volume Effectiveness
- Adjustable period on the smoothed moving average
- Several moving average types available to use for the smoothed moving average
- Toggle visibility of smoothed moving average
Volume, Relative Volume HighlightThe indicator plots regular volume bars.
The highlight is given by the current cumulative volume for the day, compared to a custom average (standard 20 periods). The stronger the color, the higher the relative volume is. Stocks moving of higher relative volume have higher chances of making predictable moves.

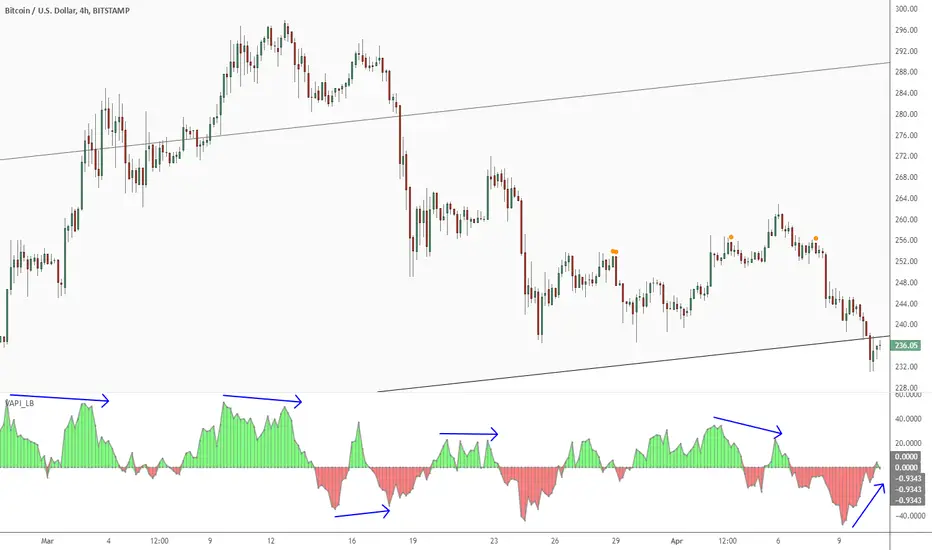
Volume Accumulation Percentage Indicator [LazyBear]Volume Accumulation Percentage Indicator (VAPI) is a variation of the classic volume-accumulation indicators. It uses volume the same way as OBV except that it assigns volume weights based on intraday volatility.
In a positive trend, if the stock price is close to a (local) new high, the VAPI should be at its maximum as well (and vice versa for a negative trend). If the market is looking for a direction, if the price is in the bottom side of his current trading range and if, at the same moment the VAPI osc slopes up, there is accumulation on the stock and that the prices should start to climb. The SELL signal is given when the VAPI decreases (distribution). Divergences are usually very effective too.
Tuning the "length" parameter may be needed for your instrument (default is 10), do let me know if you find a different value to be optimal for majority of instruments.
List of my public indicators: bit.ly
List of my app-store indicators: blog.tradingview.com
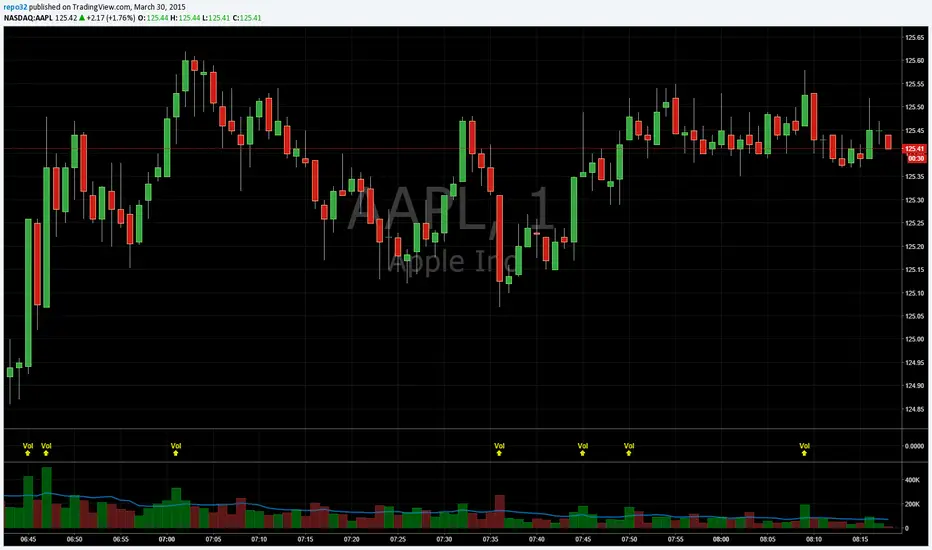
Volume BombI am republishing to use a clean chart. Previous one had too much of a mess. Idea for TradingView: Please allow us to change out the charts after publishing.
I like to know when volume spikes (only when it spikes). I am not interested in seeing the rest of the volume bars. I created this indicator to show me when it explodes (i.e. the name "Volume Bomb" , plus it sounds cool).
This indicator only shows you when volume exceeds the EMA of volume by whatever multiplier you set.
Default settings are the current volume with 10 EMA. Yellow arrowup will appear when volume is at 1.5x the 10 EMA.
Adjust it to your liking and particular stock.
Volume BombI like to know when volume spikes (only when it spikes). I am not interested in seeing the rest of the volume bars. I created this indicator to show me when it explodes (i.e. the name "Volume Bomb" , plus it sounds cool).
This indicator only shows you when volume exceeds the EMA of volume by whatever multiplier you set.
Default settings are the current volume with 10 EMA. Yellow arrowup will appear when volume is at 1.5x the 10 EMA.
Adjust it to your liking and particular stock.

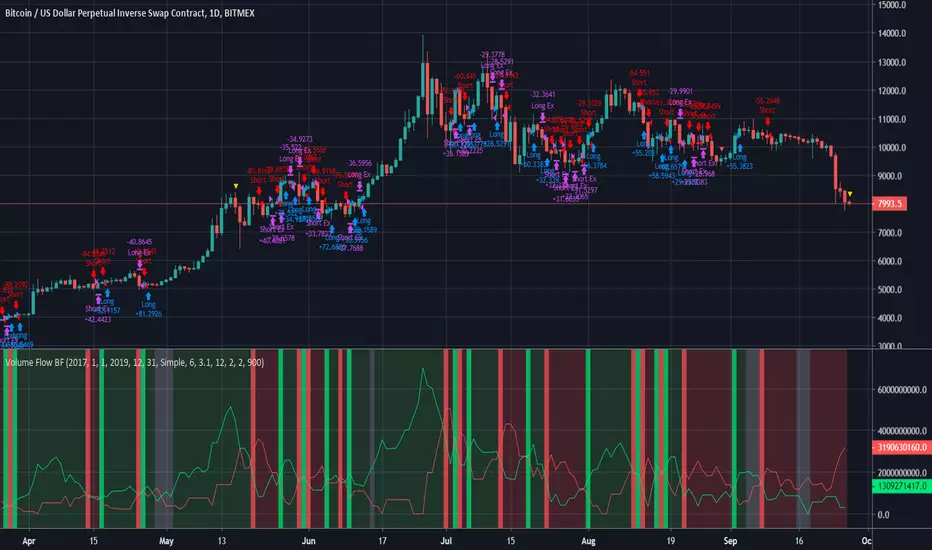
Volume Flow BFBased on code by oh92 and kiasaki.
Measures volume to indicate Bull vs Bear.
Go long when green, short when red, wait patiently when white.
Volume Weighted Bollinger (Final, cleaned up visuals)Volume-weighted bollinger (normal stats application of weighting mean) with cleaned up visualization. Shaded area represents1sd-2sd move size for trailing 20 period average on timeframe for individual candles.
Volume - Moving Sum (Quote Currency)This indicator shows a MOVING SUM of the QUOTE CURRENCY of the pair.
I made this because I wanted to be able to see how the 24HR volume looked on 1-Minute charts (which is why the default period is 1440, as there are 1440 minutes in a day.)
