Daily Anchored VWAPAnchors VWAP to whatever time you want instead of the usual start of session. I use it for BTC so that I can anchor around NY open instead of the night before.
Cerca negli script per "vwap"

Volume Weighted Average Price - 6 band by buckstrdrstandard VWAP improved to allow 6 bands as standard

AnAn Master: VWAP + EMA9/21 + Volume Spike ArrowsAnAn Master: VWAP + EMA9/21 + Volume Spike Arrows to help with spikes

Sniper BB + VWAP System (with SMT Divergence Arrows)STEP 1: Load two correlated futures charts.
Example: CL + RB/SI+GC/ NQ+ES
STEP 2: Add Bollinger Bands (20, 2.0) on both.
Optional add (20, 3.0).
STEP 3: Watch for a BB tag on one chart but not the other.
STEP 4: Wait for a reclaim candle back inside the band.
STEP 5: Enter with stop below/above the wick + 3.0 BB.
STEP 6: Scale out midline, then opposite band.
STEP 7: Hold partials when both pairs confirm trend.
*You can take the vwap bands off the chart if it is too cluttered.

TFU Multi-Symbol Screener + VWAP + Table Size Option + Blank RowTFU Multi-Symbol Screener + VWAP + Table Size Option + Blank Row

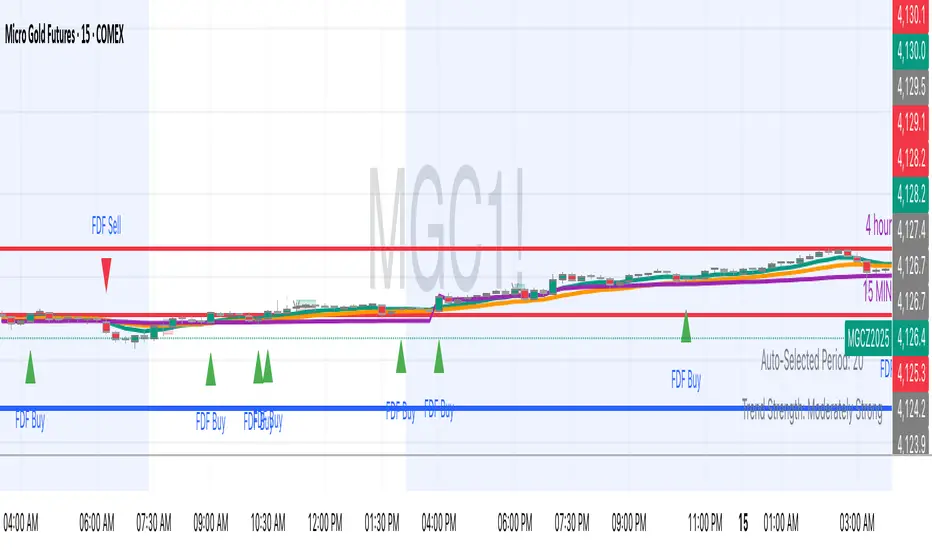
FDF — EMAs+VWAP with setup & entry (stable scale)the 9 and 21, vwap - and support an restianst, marking each entry when it pulling in our out to the 21. used 90% of the candle over the 21
Rolling VWAP x3editable rolling vwap, 3 lines, simple, can edit all 3, preset to 7/30/90 day. Just made it to declutter indicators, good luck.

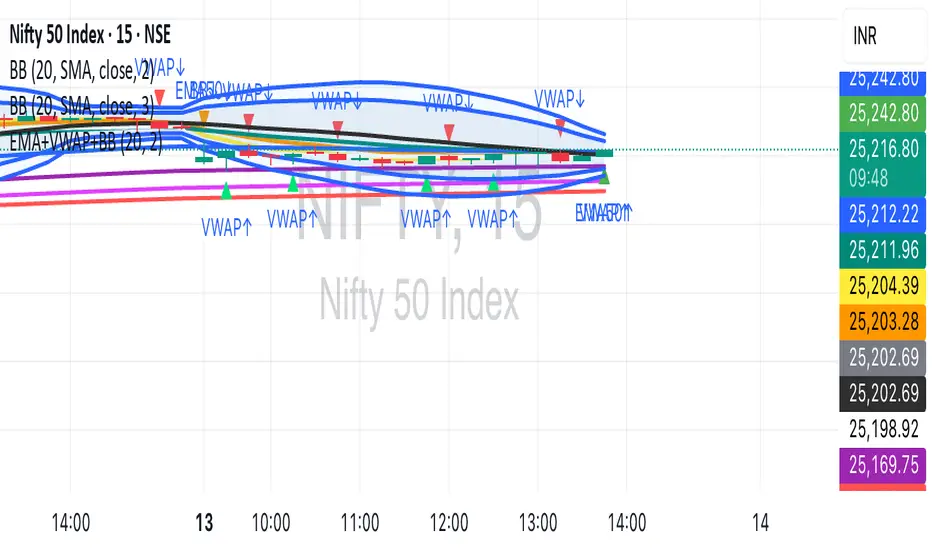
EMA (5, 10, 20, 50, 100, 150, 200)+VWAP+BBEMA Cluster + VWAP + Bollinger Bands + Alerts + Visual Signals (Fixed)
Santhosh VWAP + 3 EMA + Buy Sell AlertI have combined VWAP and EMA , along with this generated buy and sell alert based on ATR . Best for Scalping
TWAP + VWAP ConvergenceThis script:
Plots VWAP and TWAP
Detects intersections
Highlights candles where they cross beneath price
Optional: Alert condition when intersection occurs


Howard Intraday Edge (JH Edge) - (VWAP + EMA9/EMA21 + RSI)Howard Intraday Edge (JH Edge)
A disciplined intraday trading system by J. Howard.
Uses VWAP, EMA 9/21, RSI, and Optional EMA 200 to confirm trends and momentum.
Automatically plots Clean stop-loss and take profit levels. Built for SPY 0DTE-5DTE options, but works on other liquid tickers.
Focus: 1-3 high probability trades/day with tight risk control.
Best used on 1 or 3 minute timeframes.

OPEN = LOW + VWAP + Volume SurgeTradingView Pine Script that scans for OPEN = LOW, confirms VWAP support, and checks for volume surge — tailored for your intraday breakout strategy

Turnover & RVOL with MA & VWAP This scrip shows
Turnover for the day
Relative Volume
VWAP
Moving Averages
Special : Just hover the cursor over the historic bars to see the values at that point of time instead of using replay option.

Advanced Trend & Volatility Indicator (VWAP & EMA360)Bollinger band with adjustable NO TRADE tool. green buy and red sell signals for 20 moving average added 360 moving average for micro trading. Has VWAP and additional EMA defaulted to 9 (adjust to your style). For confluence use this along with an RSI over bought and over sold WMA with similar green buy and red sell signals.


Multi Time Frame Supporting Candles (with EMA/VWAP)Overview
This script provides a clean and, most importantly, correctly-scaled Multi-Time-Frame (MTF) analysis panel. It displays the candles of a higher timeframe (e.g., 1-hour candles while you are on a 5-minute chart) in a separate pane below your main chart.
Crucially, it solves a common Pine Script scaling issue, allowing you to plot indicators like EMA and VWAP from the higher timeframe alongside the candles without distorting the display. This tool is essential for traders who practice Multi-Time-Frame Analysis, helping you stay aware of the larger trend context while executing trades on a lower timeframe.

Auto AVWAP (Anchored-VWAP) with Breakout ScreenerAuto AVWAP (Anchored-VWAP) with Breakout Screener. fINAL VERSION

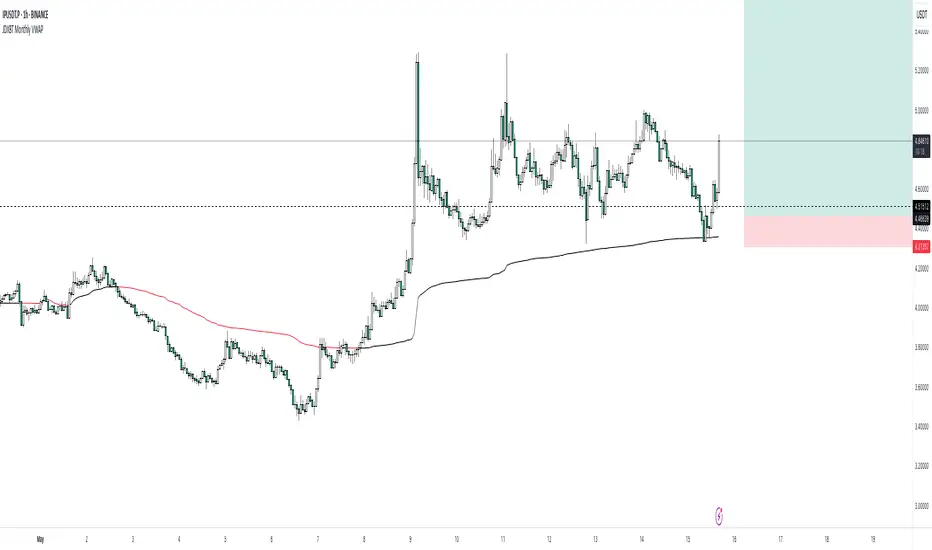
JDXBT Monthly VWAPIt calculates the average price for each month, weighted by trading volume, and automatically resets the calculation at the start of each new month. The VWAP line changes colour based on direction: black if rising, fuchsia if falling — helping traders quickly identify monthly price trends with volume context. It’s a useful tool for spotting key levels and momentum shifts on a monthly basis.
Moving Volume-Weighted Avg Price, % Channel, BBsThis script includes:
- Moving Volume-Weighted Average Price line.
- User-defined % band above and below, very useful for "breakout" signals, and mentally adjusting to the magnitude of price swings when viewing an automatic scale on the price axis.
- Volume-Weighted Bollinger Bands, which are more sensitive to volume.
More detail:
- This is like TV's basic VWAP in concept, except the major flaw in that is that it has reset periods that you can't override, and the volume is cumulative until the next hard reset. The 'reset' is OK for securities trading, that resets every day anyway. But not for crypto - and not if/when securities trading goes 24/7. Also, the denominator accumulating over the entire period is also *not* OK, because then what is shown means something different as the day progresses - which kind of makes it useless. In other words, it starts out very sensitive to volume, and gets progressively more numb to it as they day progresses, and starts flattening out.
- This fixes both problems, by using a user-definable moving window for the average. Essentially combining SMA with volume-weighting.
- You may also find an invaluable trading aid, in the % bands above and below.
- What can optionally be shown is standard deviation bands, aka Bollinger bands. The advantage over regular BB is that it's volume-weighted. Since it is already calculated on a moving average, the period for the standard deviation has been shortened by default, and the magnitude increased, to better approximate regular Bollinger Bands - but it's still more responsive to volume.

Stochastic and RSI2 entriesStochastic and RSI2 entries, v1.0
This indicator combines Stochastic and RSI to facilitate "RSI2" entry signals. Buy signals will be shown at the bottom.
The default configuration uses non-standard settings for the underlying indicators to tailor it for this type of entry strategy.
This is an entry strategy that tries to find entries close to "the dip".
A combination of Stochastic crossovers, VWAP, daily SMA50 and daily SMA200 are used to verify buy signals.
This indicator is written for bullish signals and aims to find the start of short trends or cheap entries for longer positions.
Like with any strategy, some signals will be false, and the user is advised to do some own research before using the buy signals for actual entries.
Happy trading!
