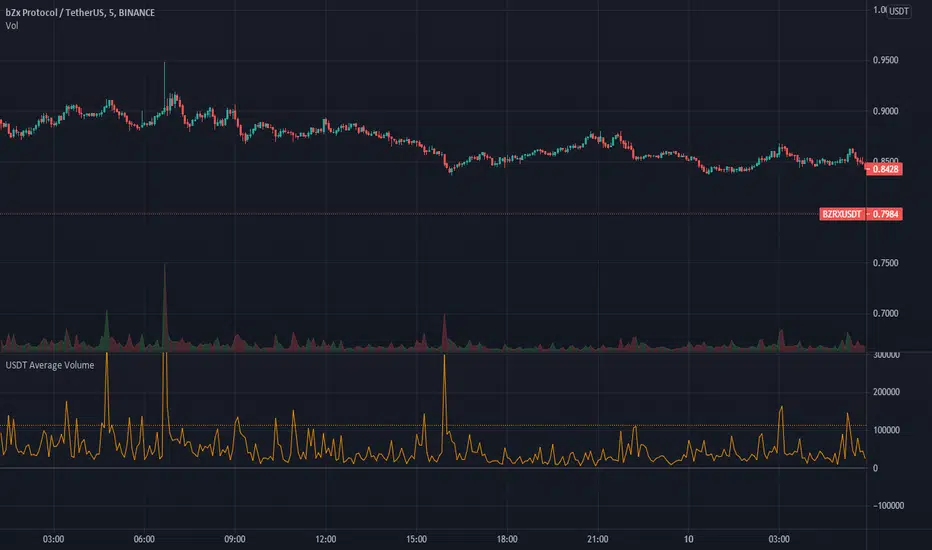
USDT Average VolumeThis is showing the Volume multiplied by the VWAP to give a better visual of how much USD (or whatever currency you use) is traded per candle.
I use this on a 5min chart to see if trading on that coin could be useful with higher amounts.
Cerca negli script per "vwap"
Matrix Series and Vix Fix with VWAP CCI and QQE SignalsBased on @ChrisMoody Williams_VIX_Fix and @glaz Matrix Series .
This indicator identify potential zone of reversal according to momentum and volatility.
Includes VWAP CCI and QQE Signals.


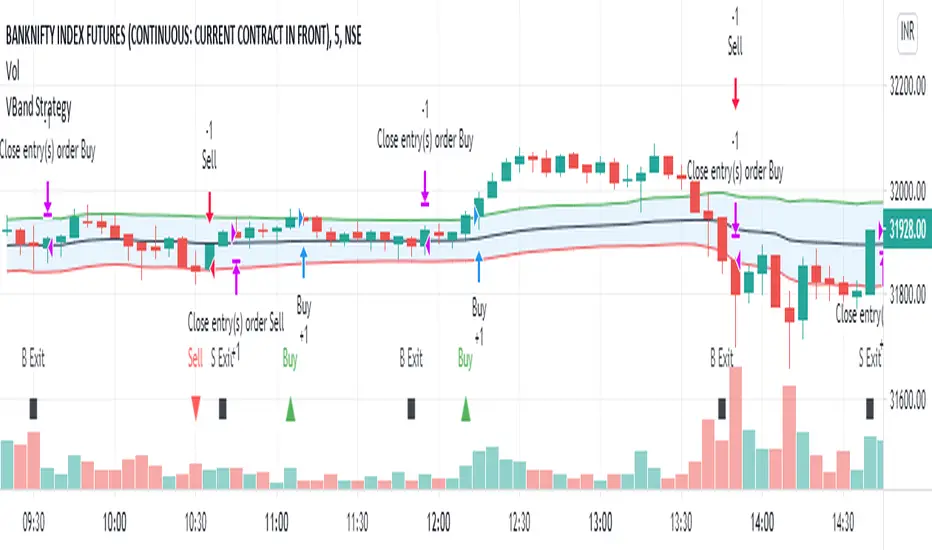
VBand StrategyVBand Strategy is simply used Vwap funcation and atr 14 for find the entry and exit points. This simple Strategy.
Asif Multi VwapMulti Time frame Vwap in One Script to identify Trend & identify supports & resistance.
Thanks

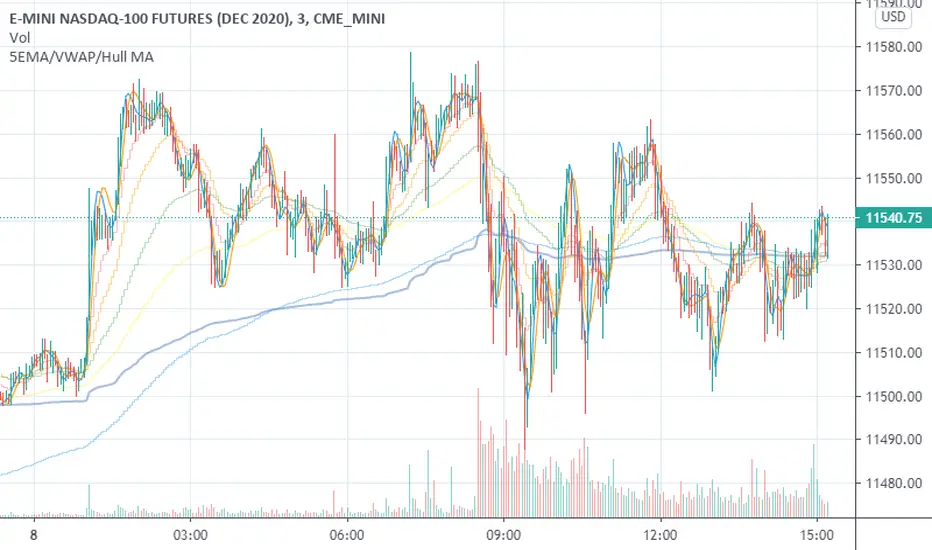
5EMA/VWAP/Hull MAThis is a straightforward combination of indicators including up to 5 EMA's, VWAP and 2 Hull Moving Averages.
Hancock - VWAPSuper simple custom VWAP bands of two lengths fast and short. When in a trending market dips into this band looks to be a good time to add to a position. To be used in conjunction with other indicators to avoid ranging markets.
Colored:
Green - Up trend
Red - Down trend
Happy trading
Hancock

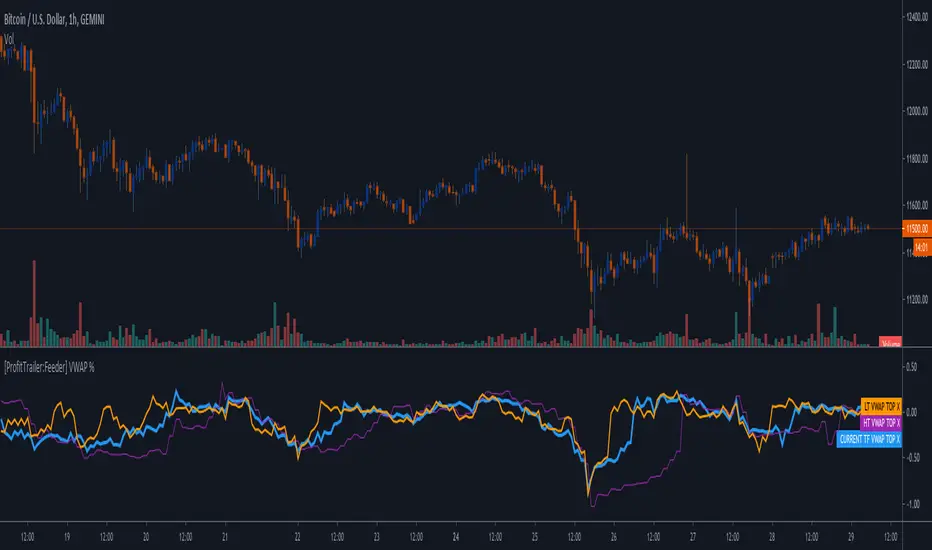
[ProfitTrailer:Feeder] VWAP %This script will help you create a strategy bases on VWAP % on BaseCoin & Top xx coin settings.
Enjoy & Like and follow if you like this kind of content.
Fibonacci and Pivot Point ,vwap and Average to Determine Trend Script has Current day Pivot Point with Central Pivot Range,vwap and Average to Determine Trend , and a day Back Projection of Fibonacci.
Its Very easy to see the Support and Resistance and even can set your Target based on that ..
i will clean it more after that and Update same ..
Thank You
If any one has any Modification to do its Code is open to Use.

Price Action Movements by RPThis is the Indicator which will enhance finding Buying and Selling opportunity on any market.
Mostly suited for day Trading and some indicator can be used for signalling stock on longer time frame.
Indicators used to create this strategy is as follows:
- Exponential Moving Average (EMA)
- Supertrend
- Volume Weighted Average Price (VWAP)
- Exponential Moving Average of Volume Weighted Average Price (MVWAP)
- Previous Day Volume Weighted Average Price (PVWAP)
- Previous Day High, Low and Close (PDH, PDL, PDC)
- And Current Day Support and Resistance points based on Previous day Price Movement.
This will indicate where to buy and Sell with Indicator based on Following criteria,
Buy Signal given,
- When Close is above Exponential Moving Average 9
- When Close is above Exponential Moving Average 21
- RSI above 55
- Supertrend is positive
- Volume is above 300 moving Average
- Close is above Volume Weighted Average Price
Sell Signal given,
- When Close is below Exponential Moving Average 9
- When Close is below Exponential Moving Average 21
- RSI below 45
- Supertrend is negative
- Volume is above 300 moving Average
- Close is below Volume Weighted Average Price
Trades can use this Study according to their need of the Indicator.
Users can Tick the indicator which they want to add on Charts to study.
Only Exponential Moving Average indicator can be used.
Only Supertrend can be used.
Volume Weighted Average Price, Previous Day Volume Weighted Average Price, Exponential Moving Average of Volume Weighted Average Price and Previous Day High, Low and Close can be used as a particular study.
Support and Resistance can be used along with Previous Day High and Previous Day Low as a particular study.
This is multipurpose Study which will help Trading Society immensely.
Thank You.

Volume Weighted DeviationsVolume !weighted!
deviations.
Important: I don't really know how people generally compute deviations from VWAP/VWMA, but smth tells me generally it's just a Av Dev/St Dev based on mean, not on appropriate basis, like volume weighted mean in our case. This version is mathematically correct, it first calculates weighted mean, than utilizes this weighted in mean in AvDev & StDef functions modified to take into account weights.


EMA,SMA,VWAPSMA EMA and VWAP all in one for you free accounters out there! The ultimate chart inspired by RizeSenpai created by Bitcorns-trader aka FACE aka ( ͡° ͜ʖ ͡°)

SPY Expected Move by VIXThis indicator shows 1 and 2 standard deviation price move from the VWAP based on VIX. Implied Volatility (IV) is being used extensively in the Option world to project the Expected Move for the underlying instrument. VIX is used as a proxy for SPY's IV for 30 days.
This indicator is meaningful only for SPY but can be used in any other instrument which has a strong correlation to SPY.

(JS) Multi-Time Frame Pivot Point Detector 2.0So here's an updated version of my automatic Pivot Point detector.
If you don't like having a bunch of Pivots on your chart at once, or having to cycle through various resolutions to see different ones, this is for you!
What does this indicator do? It automatically detects the nearest daily, weekly, and monthly pivot points both above and below the current price and automatically plots them for you. It's really just as simple as that.
You select how far back you want it to plot with the "Pivot Point Look Back Period" option.
I also have transparency options for each type of pivot so its easy to find the opacity you prefer and save it as a default setting.
With "Turn Off Each Pivot Point On All Time Frames" turned on, as an example, if you were to uncheck "S1/R1" then it turns S1/R1 plots off across all 3 pivot resolutions. By default however, I have it set where you can pick and choose each one individually.
I also added the default "VWAP Periodic" script from TradingView in there with it (not in prior version). This works identical to the built in indicator (because it is identical).
Trading algorithms like to target pivot points and liquidity, so I figured they would pair together nicely for active trading.


Single Custom Period VWAPThis script creates a vwap of a period of your choosing. You can select the timeframe in the indicator settings.

Momentum 4 Ways Smoothed [Salty]This is an enhance version of Momentum 4 Ways that shows 4 ways to calculate momentum and display each one along with their combined average value.
This study was created to compare 4 different momentum values against their combined average using different display styles to allow the user to experiment with different views of momentum.
- Added the ability to smooth the Average Momentum value. Default Smoothing value is 5.
- Added the ability to use different average calculations. Default is WMA.
- Added the ability to select the number of momentum values to average (1-4). Default is 4.
- Added the ability to use VWAP instead of price as the input.
The Smoothed Average Momentum line is color coded so that it is green when it is moving in the bullish direction and red when it is moving in the bearish direction.

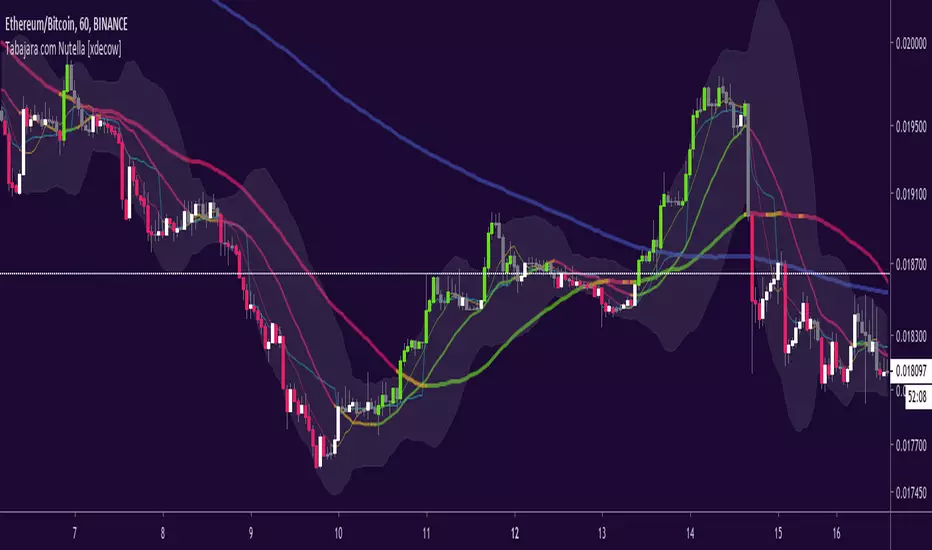
Tabajara com Nutella [xdecow]Tabajara setup from André Machado
-ma 8
-ma 20
-ma 50
-ma 200 (blue)
-vwap (aqua)
-bollinger bands
-barcolor based on tabajara rules
VWMA VWAP RibbonsPrimarily this script visually represents the differential between the volume weighted moving averages and the SMA. This is shown in the VWMA-SMA ribbons: green 20, yellow 50, red 200.
The VWAP ribbon is purple and is calculated separately from VWMA ribbons mentioned above.
300,400,500 SMA are shown in grey.
Brighter means more recent.