Sinusoidal High Pass Filter (SHPF)Sinusoidal High Pass Filter
This script implements a sinusoidal high pass filter, which is a type of digital filter that is used to remove low frequency components from a signal. The filter is defined by a series of weights that are applied to the input data, with the weights being determined by a sinusoidal function. The resulting filtered signal is then plotted on a chart, allowing the user to visualize the effect of the filter on the original signal.
The script begins by defining the sinusoidal_hpf function, which takes three arguments: _series, _period, and _phase_shift. The _series argument is the input data series that will be filtered, and the _period argument determines the length of the filter. The _phase_shift argument is an optional parameter that allows the user to adjust the phase of the sinusoidal function that is used to calculate the filter weights.
The function then initializes a variable ma to 0.0, and loops through each data point in the input series, starting from the most recent and going back in time for the specified _period number of points. For each data point, the function calculates a weight using a sinusoidal function, and adds the weighted data point to the ma variable. Finally, the function returns the average of the weighted data points by dividing ma by the _period.
The script also includes user input fields for the Length and Phase Shift parameters, which allows the user to customize the filter according to their specific needs. The filtered signal is then plotted on a chart, along with a reference line at 0.
Overall, this script provides a useful tool for analyzing and processing financial data, and can be easily customized to fit the needs of the user.
Cerca negli script per "wave"

Musashi_Fractal_Dimension === Musashi-Fractal-Dimension ===
This tool is part of my research on the fractal nature of the markets and understanding the relation between fractal dimension and chaos theory.
To take full advantage of this indicator, you need to incorporate some principles and concepts:
- Traditional Technical Analysis is linear and Euclidean, which makes very difficult its modeling.
- Linear techniques cannot quantify non-linear behavior
- Is it possible to measure accurately a wave or the surface of a mountain with a simple ruler?
- Fractals quantify what Euclidean Geometry can’t, they measure chaos, as they identify order in apparent randomness.
- Remember: Chaos is order disguised as randomness.
- Chaos is the study of unstable aperiodic behavior in deterministic non-linear dynamic systems
- Order and randomness can coexist, allowing predictability.
- There is a reason why Fractal Dimension was invented, we had no way of measuring fractal-based structures.
- Benoit Mandelbrot used to explain it by asking: How do we measure the coast of Great Britain?
- An easy way of getting the need of a dimension in between is looking at the Koch snowflake.
- Market prices tend to seek natural levels of ranges of balance. These levels can be described as attractors and are determinant.
Fractal Dimension Index ('FDI')
Determines the persistence or anti-persistence of a market.
- A persistent market follows a market trend. An anti-persistent market results in substantial volatility around the trend (with a low r2), and is more vulnerable to price reversals
- An easy way to see this is to think that fractal dimension measures what is in between mainstream dimensions. These are:
- One dimension: a line
- Two dimensions: a square
- Three dimensions: a cube.
--> This will hint you that at certain moment, if the market has a Fractal Dimension of 1.25 (which is low), the market is behaving more “line-like”, while if the market has a high Fractal Dimension, it could be interpreted as “square-like”.
- 'FDI' is trend agnostic, which means that doesn't consider trend. This makes it super useful as gives you clean information about the market without trying to include trend stuff.
Question: If we have a game where you must choose between two options.
1. a horizontal line
2. a vertical line.
Each iteration a Horizontal Line or a Square will appear as continuation of a figure. If it that iteration shows a square and you bet vertical you win, same as if it is horizontal and it is a line.
- Wouldn’t be useful to know that Fractal dimension is 1.8? This will hint square. In the markets you can use 'FD' to filter mean-reversal signals like Bollinger bands, stochastics, Regular RSI divergences, etc.
- Wouldn’t be useful to know that Fractal dimension is 1.2? This will hint Line. In the markets you can use 'FD' to confirm trend following strategies like Moving averages, MACD, Hidden RSI divergences.
Calculation method:
Fractal dimension is obtained from the ‘hurst exponent’.
'FDI' = 2 - 'Hurst Exponent'
Musashi version of the Classic 'OG' Fractal Dimension Index ('FDI')
- By default, you get 3 fast 'FDI's (11,12,13) + 1 Slow 'FDI' (21), their interaction gives useful information.
- Fast 'FDI' cross will give you gray or red dots while Slow 'FDI' cross with the slowest of the fast 'FDI's will give white and orange dots. This are great to early spot trend beginnings or trend ends.
- A baseline (purple) is also provided, this is calculated using a 21 period Bollinger bands with 1.618 'SD', once calculated, you just take midpoint, this is the 'TDI's (Traders Dynamic Index) way. The indicator will print purple dots when Slow 'FDI' and baseline crosses, I see them as Short-Term cycle changes.
- Negative slope 'FDI' means trending asset.
- Positive most of the times hints correction, but if it got overextended it might hint a rocket-shot.
TDI Ranges:
- 'FDI' between 1.0≤ 'FDI' ≤1.4 will confirm trend following continuation signals.
- 'FDI' between 1.6≥ 'FDI' ≥2.0 will confirm reversal signals.
- 'FDI' == 1.5 hints a random unpredictable market.
Fractal Attractors
- As you must know, fractals tend orbit certain spots, this are named Attractors, this happens with any fractal behavior. The market of course also shows them, in form of Support & Resistance, Supply Demand, etc. It’s obvious they are there, but now we understand that they’re not linear, as the market is fractal, so simple trendline might not be the best tool to model this.
- I’ve noticed that when the Musashi version of the 'FDI' indicator start making a cluster of multicolor dots, this end up being an attractor, I tend to draw a rectangle as that area as price tend to come back (I still researching here).
Extra useful stuff
- Momentum / speed: Included by checking RSI Study in the indicator properties. This will add two RSI’s (9 and a 7 periods) plus a baseline calculated same way as explained for 'FDI'. This gives accurate short-term trends. It also includes RSI divergences (regular and hidden), deactivate with a simple check in the RSI section of the properties.
- BBWP (Bollinger Bands with Percentile): Efficient way of visualizing volatility as the percentile of Bollinger bands expansion. This line varies color from Iced blue when low volatility and magma red when high. By default, comes with the High vols deactivated for better view of 'FDI' and RSI while all studies are included. DDWP is trend agnostic, just like 'FDI', which make it very clean at providing information.
- Ultra Slow 'FDI': I noticed that while using BBWP and RSI, the indicator gets overcrowded, so there is the possibility of adding only one 'FDI' + its baseline.
Final Note: I’ve shown you few ways of using this indicator, please backtest before using in real trading. As you know trading is more about risk and trade management than the strategy used. This still a work in progress, I really hope you find value out of it. I use it combination with a tool named “Musashi_Katana” (also found in TradingView).
Best!
Musashi

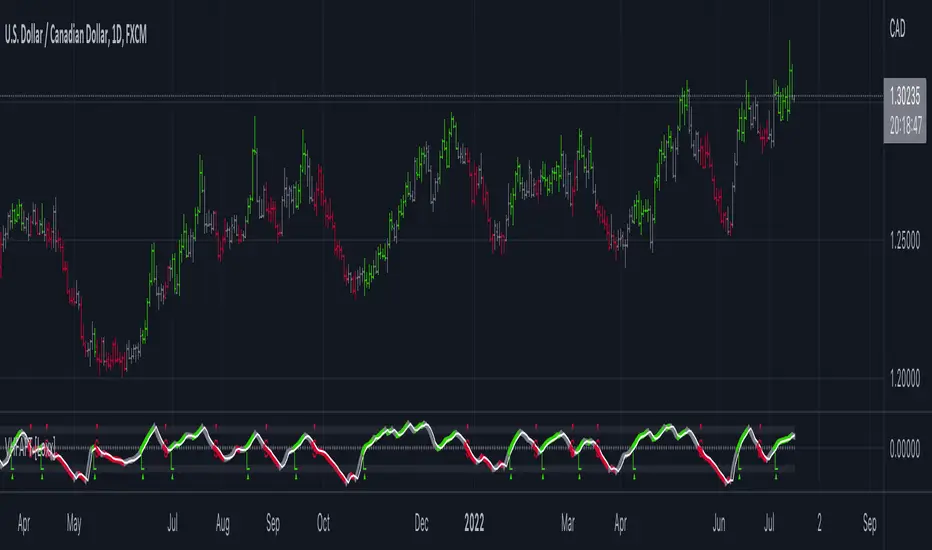
Volatility Trackerhi there, fellows.
this is a very simple and quite straightforward indicator.
so far the simplest we've built.
on what it does
in regard to current chart and timeframe it plots
a. Open - Close as a percentage of the Open (we regard open as more relevant than close, for as you can use latest estimates in current candle) in daily change coloring (so one may have an idea if there is a trend or sideways move unfolding)
b. High - Low as a percentage of the Open, so one may compare extreme moves with final ones in the period
c. Volume as a percentage distance from its WMA200 (always this one, a way better reference for normalcy). (e. g. a positive value x means Volume is x% above its WMA200)
on what it means
to the best of our imperfect and incomplete understanding, we believe that low volatility periods lead to high volatility periods, so one might want to enter the market in low volatility periods to enjoy wild rides afterwards. such a trade of course would be, for the sake of making sense, a long volatility one.
the timing for entrance could be once that the volatility waves fades to chart minimums.
we're open to critics, suggestions and comments.
best regards.

TheMas7er scalp (US equity) 5min [promuckaj]This indicator was created according to TheMas7er's trading setup, that he reveal after 18 years of working in the industry. Claims is that this setup should give you good probability to predict the price movement for US equity.
This trading setup is only for New York equity trading session from 09:30 until 4pm. The market in which you should use it are the S&P 500 , Dow Jones, and Nasdaq. Perhaps it will work on some other but for those are good according to tests. It should not used on days with high-impact news, like CPI , FOMC, NFP and so on. The model can still work there but the probability on these days is way lower.
What is the base of this indicator, it marks what is called "The Defining Range"("DR"). This defining range is from 09:30am until 10:30am New York local time, it takes those 12 candles in the 5min chart. Indicator will mark the high and low of this range, including wicks. This will help you to already know at 10:30am, with possible good probability the high or low of the day.
There is also the "Implied Defining Range"("iDR") lines inside the "DR" range, which mark the highest body and the lowest body in the "DR" range.
*The rules (it is very simple to follow):
Chart must be set in 5min timeframe.
At 10:30am you still don't know which one will be the real high or low of the day, but only one will be true.
If price is closing on 5min chart above the "DR" it should give you good probability that the low of the "DR" is the low of the day, and vice versa - if price is closing below the "DR" it should give you good probability that the high of the "DR" is the high of the day.
"iDR" gives you an early indication about what high or low of the day should be. If price is closing above "iDR" you will have an early indication that the low of the "DR" should be the low of the day, and vice versa.
Note that about closing means really closing above or below, not just wicks.
Now, after this you can realize the magnitude of possibility.
You can use any entry model you prefer to trade, it doesn't matter if you use ICT concepts, smart money concepts, volume profile , eliot waves, braking the structure concept or whatever. There are so many possibilities for trading within this rule.
Enjoy!

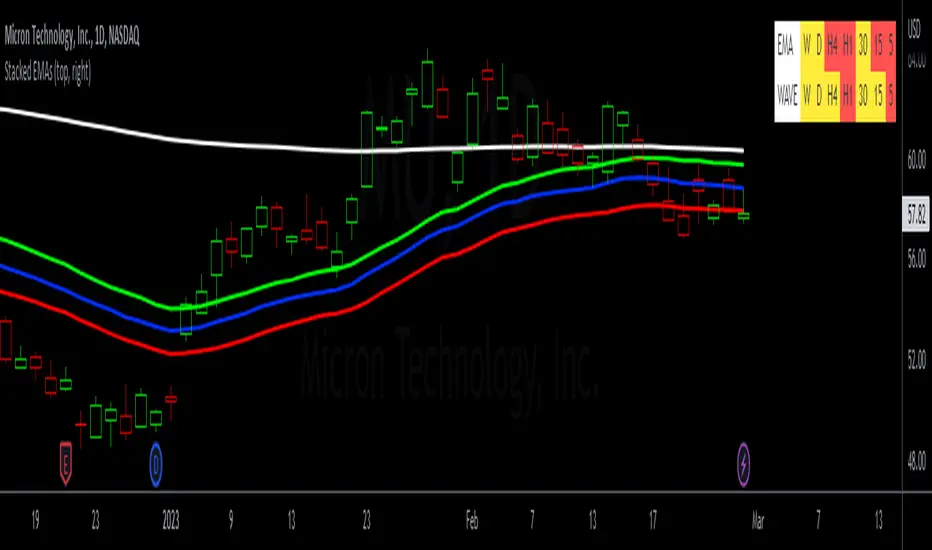
Sembang Kari Traders - EMA & Wave Stacked Labels + EMA 34 LinesThis script is 2 in 1 indicator.
1. Multi Timeframe EMA Labels
- This label indicator shows labels for EMA stacked up or EMA stacked down or EMA in sideway trend.
- EMA used in this script is EMA 8, EMA 21, EMA 34 and EMA 55.
- If the EMA 8 line is above EMA 21 line, and EMA 21 line is above EMA 34 line, and EMA 34 line is above EMA 55 line ( EMA STACKED UP) = the trend is BULLISH and the label will colored to GREEN on that timeframe.
- If the EMA 8 line is below EMA 21 line, and EMA 21 line is below EMA 34 line, and EMA 34 line is below EMA 55 line ( EMA STACKED DOWN) = the trend is BEARISH and the label will colored to RED on that timeframe.
- If either 1 of the EMA 8, or EMA 21, or EMA 34, or EMA 55 is NOT STACKED = the trend is SIDEWAY and the label will colored to YELLOW on that timeframe.
- Timeframe shows in label is Daily, 4 hours, 1 hour, 15 minutes and 5 minutes.
- This indicator labels will be useful to identifying trend in others timeframe without to look or open that other timeframe. Example, if u in 5 minutes timeframe chart, then u see that "D" is colored to GREEN, then straight will know that EMA 8, EMA 21, EMA 34 and EMA 55 is STACKED UP which means BULLISH without to look or open that Daily timeframe .
2. EMA 34 Lines
- This is indicator shows 3 exponential moving average line which is EMA 34 lines.
- This indicator will shows 3 lines which is GREEN, BLUE, and RED.
- The GREEN line is EMA 34 HIGH
- The BLUE line is EMA 34 CLOSE
- The RED line is EMA 34 BLUE
Trade Idea
- The idea using this indicator is we want to take an entry setup when the candle pull back to EMA 34 lines and at the same time using the EMA labels to be confirmation as label will indicates trends in multiple timeframe.
- When price moved far away from EMA 34 lines, then wait till price pullback to EMA lines and confirmed it by trend labels provided to take take a entry setup.
- this indicator can be used on all tickers
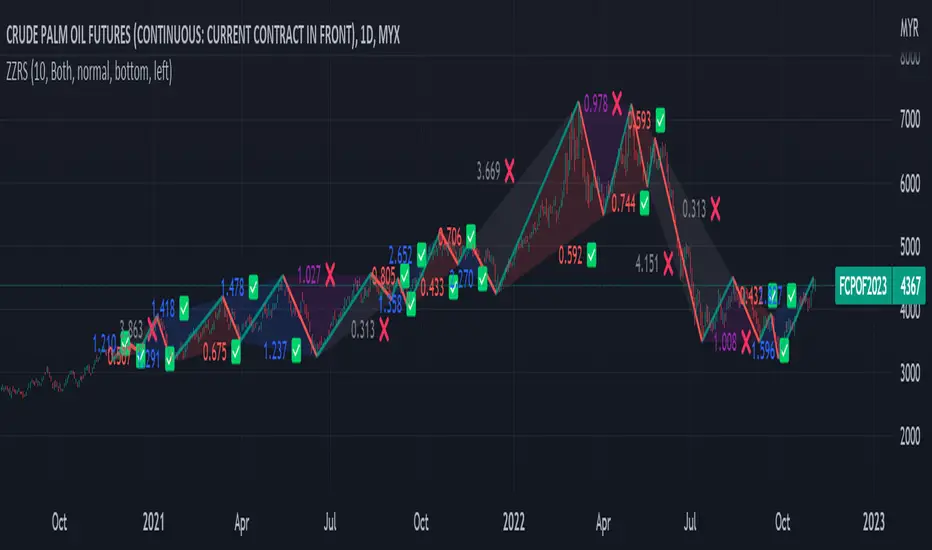
Zig Zag Ratio Simplified█ OVERVIEW
This indicator was to show ratio between zig zag. Ideally to find Fibonacci Retracement / Projection, Harmonic Patterns, ABCD, Elliot Wave and etc.
█ CREDITS
LonesomeTheBlue
█ FEATURES
Table can positioned by any position and font size can be resized.
█ USAGE / TIPS EXAMPLES (Description explained in each image)
My exponential moving averages - Suri's EMAs
It's not an indication of anything here, it's just part of my operating in a simple and summarized way, I hope it helps someone.
Suri's EMA's indicator is nothing more than a set of exponential moving averages (EMA). They are 12, 26, 50 and 200.
Attention to the use of the indicator, it is just an INDICATOR, it should not be taken as the main point of your entry, but to guide you in your entries in favor of the trend, whether intra-day or swing.
Created for clear, monochrome screens. Make your adjustments.
Color condition, candles turn green when their close is above EMA 12 and 26.
Color condition, candles turn red when their close is below EMA 12 and 26.
Condition for colors, MME12,26,50 and 200 will turn green with price working above it.
Condition for colors, MME12, 26, 50 and 200 will turn red with price working below it.
Indication for use in time-frames = 5m, 15m, 60m, 240m. (higher hit rates)
How to use the indicator, MME 12 and 26, are the most important and led you to more entries, but we should not only consider them, we have to analyze the whole context to then make a decision.
Indicator was nicknamed by me by "Pullback Pick", it works in a simple way:
In an uptrend or downtrend, the price usually tends to return in the averages or the averages go up to the price, that being said, it is easy to observe that where the price returns would be a pullback from the last movement, so when returning to the averages, the candle that shows strength in favor of this trend, in the EMA's region, becomes a possible entry, with its stop below or above this "pullback" formed, because the stop goes there, because usually when the price returns on the EMAs they tend to to hold and replay the price in favor of the trend.
My observations:
I like to enter when the price returns to the averages smoothly, without much movement, when it touches the average 12 or 26 it is an entry, but an entry without confirmation, the gain is greater, but the chance of being stopped is higher, I like it when the price is close to the 12 and 26 averages and leaves a small candle or doji on this pullback, my entry goes to the breakout of this candle and the stop behind the candle.
THERE IS NO MIRACLE, THERE IS NO 100% HIT RATE, SO USE STOP.
Aaaaaaaaaa I was forgetting.... and the target???
As it is a trend following setup, it is cool to leave a trailing stop or update the stop as new bottoms or tops are formed.
Targeting in 1v1 is good, setup pays a lot!
Targeting in 2x1 is too good, setup pays well!
Making a target in 3x1 is more than good, setup pays sometimes, then from now on, it depends on where you are entering this "PULLBACK", if it is in the first wave, in the second, if you are going to lateralize, the market is SOVEREIGN, put in the pocket that is no longer on the market, oh it's yours!
That's it, doubts, send it there, suggestion, opinion, whatever you want.
Added a symbol at the crossing of the 12 and 26 moving averages.
I am so sorry, but i dont speak english, use google translate.
Português.
Não se trata de indicação de nada aqui, é apenas parte do meu operacional de maneira simples e resumida, espero que ajude alguém.
Indicador Suri's EMA's, nada mais é do que um conjunto de médias móveis exponenciais(MME). São elas 12, 26, 50 e 200.
Atenção para o uso do indicador, ele é apenas um INDICADOR, não deve ser tomado como o ponto principal de sua entrada, mas sim de te balizar nas suas entradas a favor da tendência, seja ela intra-day ou swing.
Criado para telas claras e monocromáticas. Façam seus ajustes.
Condição para as cores, candles ficam verdes quando o fechamento dele é acima das MME 12 e 26.
Condição para as cores, candles ficam vermelhos quando o fechamento dele é abaixo das MME 12 e 26.
Condição para as cores, MME12,26,50 e 200 ficará verde com preço trabalhando acima dela.
Condição para as cores, MME12, 26, 50 e 200 ficará vermelho com preço trabalhando abaixo dela.
Indicação para uso nos time-frame = 5m, 15m, 60m, 240m.(taxas de acerto maior)
Como utilizar o indicador, MME 12 e 26, são as mais importantes e te levaram a mais entradas, porém não devemos levar apenas elas em consideração, temos que analisar todo o contexto para então tomar decisão.
Indicador foi apelidado por mim por " Pega Pullback", ele funciona de uma maneira simples:
Em tendência de alta ou de baixa, o preço geralmente tende a retornar nas médias ou as médias irem até o preço, dito isso é fácil de se observar que onde o preço retorna seria um pullback do último movimento, portanto ao retornar nas médias, o candle que mostra força a favor dessa tendência, na região das EMA's, se torna uma possível entrada, com o seu stop abaixo ou acima desse "pullback" formado, porque o stop vai nesse local, porque geralmente quando o preço retorna nas EMAs elas tendem a segurar e voltar a jogar o preço a favor da tendência.
Minhas observações:
Eu gosto de entrar quando o preço retorna nas médias de maneira suave, sem muito movimento, quando toca na média 12 ou 26 é uma entrada, porém uma entrada sem confirmação, o ganho é maior, porém a chance de ser stopado é mais alta, eu gosto quando o preço fica perto das médias 12 e 26 e deixa um candle pequeno ou doji nesse pullback, minha entrada vai no rompimento desse candle e o stop atrás do candle.
Não existe MILAGRE, NÃO EXISTE TAXA DE ACERTO DE 100%, POR ISSO USE STOP.
Aaaaaaaaaa ia me esquecendo.... e o alvo???
Por ser um setup seguidor de tendência, o legal é deixar um trailing stop ou ir atualizando o stop conforme novos fundos ou topos são formados.
Realizar alvo no 1x1 é bom, setup paga muito!
Realizar alvo no 2x1 é bom de mais, setup paga bem!
Realizar alvo no 3x1 é mais do que bom, setup paga as vezes, ai daqui pra frente, depende de onde você está entrando nesse "PULLBACK", se é na primeira onda, na segunda, se vai lateralizar, o mercado é SOBERANO, põe no bolso que não é mais do mercado, ai é teu!
É isso, dúvidas, manda ai, sugestão, opinião, o que quiser.
Adicionado um símbolo no cruzamento das médias móveis 12 e 26.

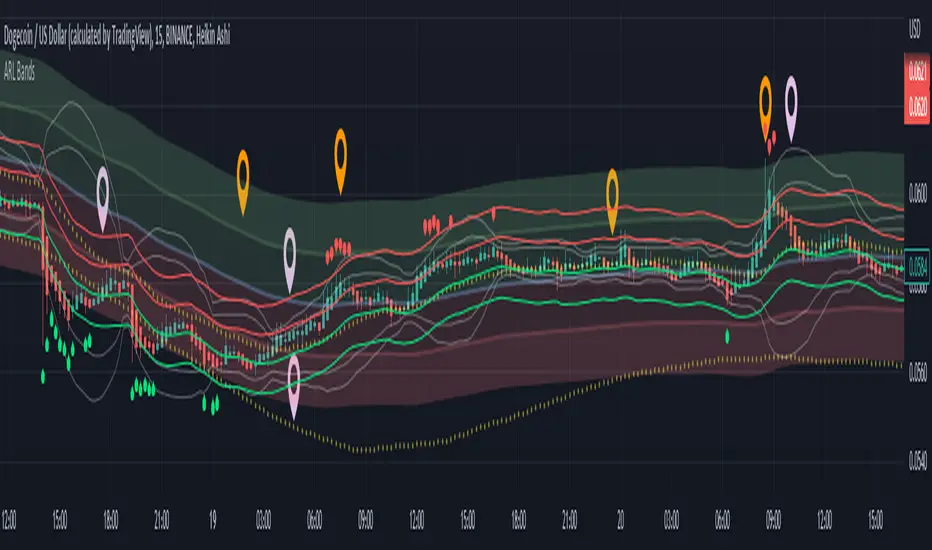
Adaptive Rebound Line Bands (ARL Bands)These bands consist of 4 ARLs (See: Adaptive Rebound Line ('ARL'/AR Line)) that help accurately spot price rebounds.
It is excellent for 15 minute scalping and price-action trading.
See notes in the picture above for more details.
Note: "Top Deviation" is the deviation of the top 'ARL', "High Deviation" is for the high 'ARL', etc.
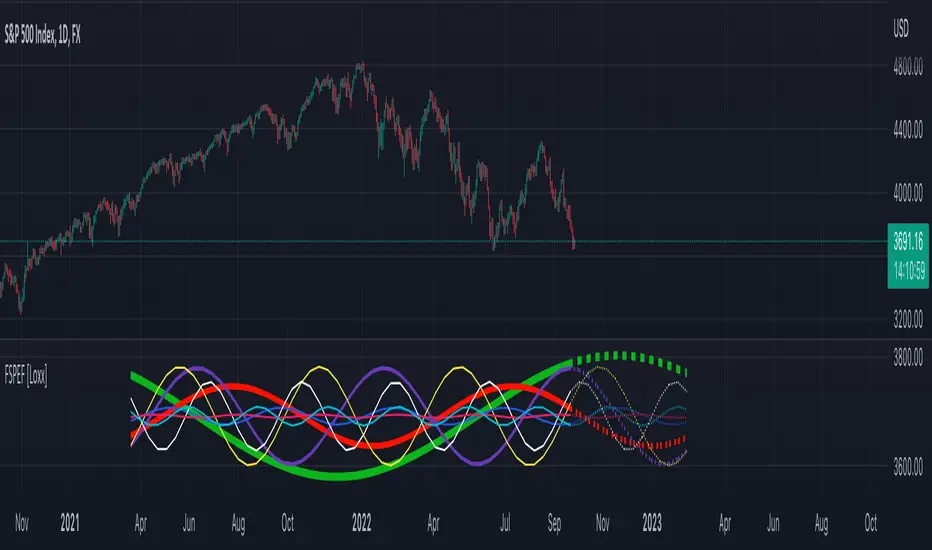
Fourier Spectrometer of Price w/ Extrapolation Forecast [Loxx]Fourier Spectrometer of Price w/ Extrapolation Forecast is a forecasting indicator that forecasts the sinusoidal frequency of input price. This method uses Linear Regression with a Fast Fourier Transform function for the forecast and is different from previous forecasting methods I've posted. Dotted lines are the forecast frequencies. You can change the UI colors and line widths. This comes with 8 frequencies out of the box. Instead of drawing sinusoidal manually on your charts, you can use this instead. This will render better results than eyeballing the Sine Wave that folks use for trading. this is the real math that automates that process.
Each signal line can be shown as a linear superposition of periodic (sinusoidal) components with different periods (frequencies) and amplitudes. Roughly, the indicator shows those components. It strongly depends on the probing window and changes (recalculates) after each tick; e.g., you can see the set of frequencies showing whether the signal is fast or slow-changing, etc. Sometimes only a small number of leading / strongest components (e.g., 3) can extrapolate the signal quite well.
Related Indicators
Fourier Extrapolator of 'Caterpillar' SSA of Price
Real-Fast Fourier Transform of Price w/ Linear Regression
Fourier Extrapolator of Price w/ Projection Forecast
Itakura-Saito Autoregressive Extrapolation of Price
Helme-Nikias Weighted Burg AR-SE Extra. of Price
***The period parameter doesn't correspond to how many bars back the drawing begins. Lines re rendered according to skipping mechanism due to TradingView limitations.
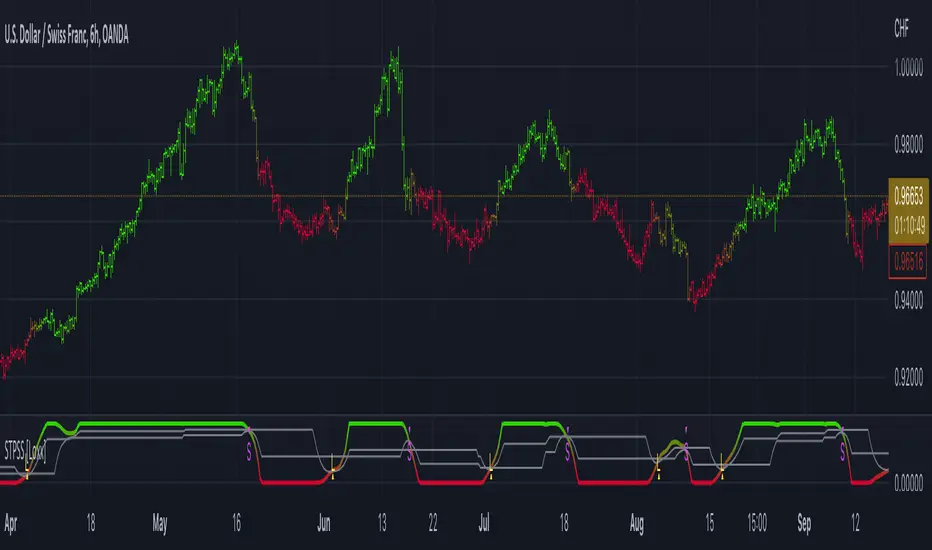
Stochastic of Two-Pole SuperSmoother [Loxx]Stochastic of Two-Pole SuperSmoother is a Stochastic Indicator that takes as input Two-Pole SuperSmoother of price. Includes gradient coloring and Discontinued Signal Lines signals with alerts.
What is Ehlers ; Two-Pole Super Smoother?
From "Cycle Analytics for Traders Advanced Technical Trading Concepts" by John F. Ehlers
A SuperSmoother filter is used anytime a moving average of any type would otherwise be used, with the result that the SuperSmoother filter output would have substantially less lag for an equivalent amount of smoothing produced by the moving average. For example, a five-bar SMA has a cutoff period of approximately 10 bars and has two bars of lag. A SuperSmoother filter with a cutoff period of 10 bars has a lag a half bar larger than the two-pole modified Butterworth filter.Therefore, such a SuperSmoother filter has a maximum lag of approximately 1.5 bars and even less lag into the attenuation band of the filter. The differential in lag between moving average and SuperSmoother filter outputs becomes even larger when the cutoff periods are larger.
Market data contain noise, and removal of noise is the reason for using smoothing filters. In fact, market data contain several kinds of noise. I’ll group one kind of noise as systemic, caused by the random events of trades being exercised. A second kind of noise is aliasing noise, caused by the use of sampled data. Aliasing noise is the dominant term in the data for shorter cycle periods.
It is easy to think of market data as being a continuous waveform, but it is not. Using the closing price as representative for that bar constitutes one sample point. It doesn’t matter if you are using an average of the high and low instead of the close, you are still getting one sample per bar. Since sampled data is being used, there are some dSP aspects that must be considered. For example, the shortest analysis period that is possible (without aliasing)2 is a two-bar cycle.This is called the Nyquist frequency, 0.5 cycles per sample.A perfect two-bar sine wave cycle sampled at the peaks becomes a square wave due to sampling. However, sampling at the cycle peaks can- not be guaranteed, and the interference between the sampling frequency and the data frequency creates the aliasing noise.The noise is reduced as the data period is longer. For example, a four-bar cycle means there are four samples per cycle. Because there are more samples, the sampled data are a better replica of the sine wave component. The replica is better yet for an eight-bar data component.The improved fidelity of the sampled data means the aliasing noise is reduced at longer and longer cycle periods.The rate of reduction is 6 dB per octave. My experience is that the systemic noise rarely is more than 10 dB below the level of cyclic information, so that we create two conditions for effective smoothing of aliasing noise:
1. It is difficult to use cycle periods shorter that two octaves below the Nyquist frequency.That is, an eight-bar cycle component has a quantization noise level 12 dB below the noise level at the Nyquist frequency. longer cycle components therefore have a systemic noise level that exceeds the aliasing noise level.
2. A smoothing filter should have sufficient selectivity to reduce aliasing noise below the systemic noise level. Since aliasing noise increases at the rate of 6 dB per octave above a selected filter cutoff frequency and since the SuperSmoother attenuation rate is 12 dB per octave, the Super- Smoother filter is an effective tool to virtually eliminate aliasing noise in the output signal.
What are DSL Discontinued Signal Line?
A lot of indicators are using signal lines in order to determine the trend (or some desired state of the indicator) easier. The idea of the signal line is easy : comparing the value to it's smoothed (slightly lagging) state, the idea of current momentum/state is made.
Discontinued signal line is inheriting that simple signal line idea and it is extending it : instead of having one signal line, more lines depending on the current value of the indicator.
"Signal" line is calculated the following way :
When a certain level is crossed into the desired direction, the EMA of that value is calculated for the desired signal line
When that level is crossed into the opposite direction, the previous "signal" line value is simply "inherited" and it becomes a kind of a level
This way it becomes a combination of signal lines and levels that are trying to combine both the good from both methods.
In simple terms, DSL uses the concept of a signal line and betters it by inheriting the previous signal line's value & makes it a level.
Included:
Bar coloring
Alerts
Signals
Loxx's Expanded Source Types
Adaptive Two-Pole Super Smoother Entropy MACD [Loxx]Adaptive Two-Pole Super Smoother Entropy (Math) MACD is an Ehlers Two-Pole Super Smoother that is transformed into an MACD oscillator using entropy mathematics. Signals are generated using Discontinued Signal Lines.
What is Ehlers; Two-Pole Super Smoother?
From "Cycle Analytics for Traders Advanced Technical Trading Concepts" by John F. Ehlers
A SuperSmoother filter is used anytime a moving average of any type would otherwise be used, with the result that the SuperSmoother filter output would have substantially less lag for an equivalent amount of smoothing produced by the moving average. For example, a five-bar SMA has a cutoff period of approximately 10 bars and has two bars of lag. A SuperSmoother filter with a cutoff period of 10 bars has a lag a half bar larger than the two-pole modified Butterworth filter.Therefore, such a SuperSmoother filter has a maximum lag of approximately 1.5 bars and even less lag into the attenuation band of the filter. The differential in lag between moving average and SuperSmoother filter outputs becomes even larger when the cutoff periods are larger.
Market data contain noise, and removal of noise is the reason for using smoothing filters. In fact, market data contain several kinds of noise. I’ll group one kind of noise as systemic, caused by the random events of trades being exercised. A second kind of noise is aliasing noise, caused by the use of sampled data. Aliasing noise is the dominant term in the data for shorter cycle periods.
It is easy to think of market data as being a continuous waveform, but it is not. Using the closing price as representative for that bar constitutes one sample point. It doesn’t matter if you are using an average of the high and low instead of the close, you are still getting one sample per bar. Since sampled data is being used, there are some dSP aspects that must be considered. For example, the shortest analysis period that is possible (without aliasing)2 is a two-bar cycle.This is called the Nyquist frequency, 0.5 cycles per sample.A perfect two-bar sine wave cycle sampled at the peaks becomes a square wave due to sampling. However, sampling at the cycle peaks can- not be guaranteed, and the interference between the sampling frequency and the data frequency creates the aliasing noise.The noise is reduced as the data period is longer. For example, a four-bar cycle means there are four samples per cycle. Because there are more samples, the sampled data are a better replica of the sine wave component. The replica is better yet for an eight-bar data component.The improved fidelity of the sampled data means the aliasing noise is reduced at longer and longer cycle periods.The rate of reduction is 6 dB per octave. My experience is that the systemic noise rarely is more than 10 dB below the level of cyclic information, so that we create two conditions for effective smoothing of aliasing noise:
1. It is difficult to use cycle periods shorter that two octaves below the Nyquist frequency.That is, an eight-bar cycle component has a quantization noise level 12 dB below the noise level at the Nyquist frequency. longer cycle components therefore have a systemic noise level that exceeds the aliasing noise level.
2. A smoothing filter should have sufficient selectivity to reduce aliasing noise below the systemic noise level. Since aliasing noise increases at the rate of 6 dB per octave above a selected filter cutoff frequency and since the SuperSmoother attenuation rate is 12 dB per octave, the Super- Smoother filter is an effective tool to virtually eliminate aliasing noise in the output signal.
What are DSL Discontinued Signal Line?
A lot of indicators are using signal lines in order to determine the trend (or some desired state of the indicator) easier. The idea of the signal line is easy : comparing the value to it's smoothed (slightly lagging) state, the idea of current momentum/state is made.
Discontinued signal line is inheriting that simple signal line idea and it is extending it : instead of having one signal line, more lines depending on the current value of the indicator.
"Signal" line is calculated the following way :
When a certain level is crossed into the desired direction, the EMA of that value is calculated for the desired signal line
When that level is crossed into the opposite direction, the previous "signal" line value is simply "inherited" and it becomes a kind of a level
This way it becomes a combination of signal lines and levels that are trying to combine both the good from both methods.
In simple terms, DSL uses the concept of a signal line and betters it by inheriting the previous signal line's value & makes it a level.
Included:
Bar coloring
Alerts
Signals
Loxx's Expanded Source Types

FDI-Adaptive Fisher Transform [Loxx]FDI-Adaptive Fisher Transform is a Fractal Dimension Adaptive Fisher Transform indicator.
What is the Fractal Dimension Index?
The goal of the fractal dimension index is to determine whether the market is trending or in a trading range. It does not measure the direction of the trend. A value less than 1.5 indicates that the price series is persistent or that the market is trending. Lower values of the FDI indicate a stronger trend. A value greater than 1.5 indicates that the market is in a trading range and is acting in a more random fashion.
What is Fisher Transform?
The Fisher Transform is a technical indicator created by John F. Ehlers that converts prices into a Gaussian normal distribution.
The indicator highlights when prices have moved to an extreme, based on recent prices. This may help in spotting turning points in the price of an asset. It also helps show the trend and isolate the price waves within a trend.
Included:
Zero-line and signal cross options for bar coloring
Customizable overbought/oversold thresh-holds
Alerts
Signals
STD/Clutter-Filtered, Variety FIR Filters [Loxx]STD/Clutter-Filtered, Variety FIR Filters is a FIR filter explorer. The following FIR Digital Filters are included.
Rectangular - simple moving average
Hanning
Hamming
Blackman
Blackman/Harris
Linear weighted
Triangular
There are 10s of windowing functions like the ones listed above. This indicator will be updated over time as I create more windowing functions in Pine.
Uniform/Rectangular Window
The uniform window (also called the rectangular window) is a time window with unity amplitude for all time samples and has the same effect as not applying a window.
Use this window when leakage is not a concern, such as observing an entire transient signal.
The uniform window has a rectangular shape and does not attenuate any portion of the time record. It weights all parts of the time record equally. Because the uniform window does not force the signal to appear periodic in the time record, it is generally used only with functions that are already periodic within a time record, such as transients and bursts.
The uniform window is sometimes called a transient or boxcar window.
For sine waves that are exactly periodic within a time record, using the uniform window allows you to measure the amplitude exactly (to within hardware specifications) from the Spectrum trace.
Hanning Window
The Hanning window attenuates the input signal at both ends of the time record to zero. This forces the signal to appear periodic. The Hanning window offers good frequency resolution at the expense of some amplitude accuracy.
This window is typically used for broadband signals such as random noise. This window should not be used for burst or chirp source types or other strictly periodic signals. The Hanning window is sometimes called the Hann window or random window.
Hamming Window
Computers can't do computations with an infinite number of data points, so all signals are "cut off" at either end. This causes the ripple on either side of the peak that you see. The hamming window reduces this ripple, giving you a more accurate idea of the original signal's frequency spectrum.
Blackman
The Blackman window is a taper formed by using the first three terms of a summation of cosines. It was designed to have close to the minimal leakage possible. It is close to optimal, only slightly worse than a Kaiser window.
Blackman-Harris
This is the original "Minimum 4-sample Blackman-Harris" window, as given in the classic window paper by Fredric Harris "On the Use of Windows for Harmonic Analysis with the Discrete Fourier Transform", Proceedings of the IEEE, vol 66, no. 1, pp. 51-83, January 1978. The maximum side-lobe level is -92.00974072 dB.
Linear Weighted
A Weighted Moving Average puts more weight on recent data and less on past data. This is done by multiplying each bar’s price by a weighting factor. Because of its unique calculation, WMA will follow prices more closely than a corresponding Simple Moving Average.
Triangular Weighted
Triangular windowing is known for very smooth results. The weights in the triangular moving average are adding more weight to central values of the averaged data. Hence the coefficients are specifically distributed. Some of the examples that can give a clear picture of the coefficients progression:
period 1 : 1
period 2 : 1 1
period 3 : 1 2 1
period 4 : 1 2 2 1
period 5 : 1 2 3 2 1
period 6 : 1 2 3 3 2 1
period 7 : 1 2 3 4 3 2 1
period 8 : 1 2 3 4 4 3 2 1
Read here to read about how each of these filters compare with each other: Windowing
What is a Finite Impulse Response Filter?
In signal processing, a finite impulse response (FIR) filter is a filter whose impulse response (or response to any finite length input) is of finite duration, because it settles to zero in finite time. This is in contrast to infinite impulse response (IIR) filters, which may have internal feedback and may continue to respond indefinitely (usually decaying).
The impulse response (that is, the output in response to a Kronecker delta input) of an Nth-order discrete-time FIR filter lasts exactly {\displaystyle N+1}N+1 samples (from first nonzero element through last nonzero element) before it then settles to zero.
FIR filters can be discrete-time or continuous-time, and digital or analog.
A FIR filter is (similar to, or) just a weighted moving average filter, where (unlike a typical equally weighted moving average filter) the weights of each delay tap are not constrained to be identical or even of the same sign. By changing various values in the array of weights (the impulse response, or time shifted and sampled version of the same), the frequency response of a FIR filter can be completely changed.
An FIR filter simply CONVOLVES the input time series (price data) with its IMPULSE RESPONSE. The impulse response is just a set of weights (or "coefficients") that multiply each data point. Then you just add up all the products and divide by the sum of the weights and that is it; e.g., for a 10-bar SMA you just add up 10 bars of price data (each multiplied by 1) and divide by 10. For a weighted-MA you add up the product of the price data with triangular-number weights and divide by the total weight.
Ultra Low Lag Moving Average's weights are designed to have MAXIMUM possible smoothing and MINIMUM possible lag compatible with as-flat-as-possible phase response.
What is a Clutter Filter?
For our purposes here, this is a filter that compares the slope of the trading filter output to a threshold to determine whether to shift trends. If the slope is up but the slope doesn't exceed the threshold, then the color is gray and this indicates a chop zone. If the slope is down but the slope doesn't exceed the threshold, then the color is gray and this indicates a chop zone. Alternatively if either up or down slope exceeds the threshold then the trend turns green for up and red for down. Fro demonstration purposes, an EMA is used as the moving average. This acts to reduce the noise in the signal.
Included
Bar coloring
Loxx's Expanded Source Types
Signals
Alerts
Related Indicators
STD/Clutter-Filtered, Kaiser Window FIR Digital Filter
STD- and Clutter-Filtered, Non-Lag Moving Average
Clutter-Filtered, D-Lag Reducer, Spec. Ops FIR Filter
STD-Filtered, Ultra Low Lag Moving Average

STD- and Clutter-Filtered, Non-Lag Moving Average [Loxx]STD- and Clutter-Filtered, Non-Lag Moving Average is a Weighted Moving Average with a minimal lag using a damping cosine wave as the line of weight coefficients. The indicator has two filters. They are static (in points) and dynamic (expressed as a decimal). They allow cutting the price noise giving a stepped shape to the Moving Average. Moreover, there is the possibility to highlight the trend direction by color. This also includes a standard deviation and clutter filter. This filter is a FIR filter.
What is a Generic or Direct Form FIR Filter?
In signal processing, a finite impulse response (FIR) filter is a filter whose impulse response (or response to any finite length input) is of finite duration, because it settles to zero in finite time. This is in contrast to infinite impulse response (IIR) filters, which may have internal feedback and may continue to respond indefinitely (usually decaying).
The impulse response (that is, the output in response to a Kronecker delta input) of an Nth-order discrete-time FIR filter lasts exactly {\displaystyle N+1}N+1 samples (from first nonzero element through last nonzero element) before it then settles to zero.
FIR filters can be discrete-time or continuous-time, and digital or analog.
A FIR filter is (similar to, or) just a weighted moving average filter, where (unlike a typical equally weighted moving average filter) the weights of each delay tap are not constrained to be identical or even of the same sign. By changing various values in the array of weights (the impulse response, or time shifted and sampled version of the same), the frequency response of a FIR filter can be completely changed.
An FIR filter simply CONVOLVES the input time series (price data) with its IMPULSE RESPONSE. The impulse response is just a set of weights (or "coefficients") that multiply each data point. Then you just add up all the products and divide by the sum of the weights and that is it; e.g., for a 10-bar SMA you just add up 10 bars of price data (each multiplied by 1) and divide by 10. For a weighted-MA you add up the product of the price data with triangular-number weights and divide by the total weight.
What is a Clutter Filter?
For our purposes here, this is a filter that compares the slope of the trading filter output to a threshold to determine whether to shift trends. If the slope is up but the slope doesn't exceed the threshold, then the color is gray and this indicates a chop zone. If the slope is down but the slope doesn't exceed the threshold, then the color is gray and this indicates a chop zone. Alternatively if either up or down slope exceeds the threshold then the trend turns green for up and red for down. Fro demonstration purposes, an EMA is used as the moving average. This acts to reduce the noise in the signal.
What is a Dual Element Lag Reducer?
Modifies an array of coefficients to reduce lag by the Lag Reduction Factor uses a generic version of a Kalman velocity component to accomplish this lag reduction is achieved by applying the following to the array:
2 * coeff - coeff
The response time vs noise battle still holds true, high lag reduction means more noise is present in your data! Please note that the beginning coefficients which the modifying matrix cannot be applied to (coef whose indecies are < LagReductionFactor) are simply multiplied by two for additional smoothing .
Included
Bar coloring
Loxx's Expanded Source Types
Signals
Alerts

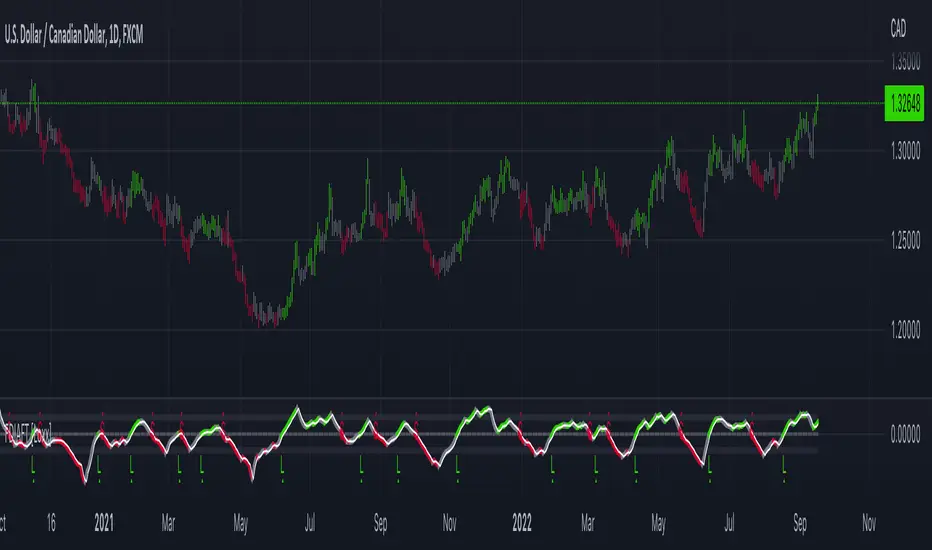
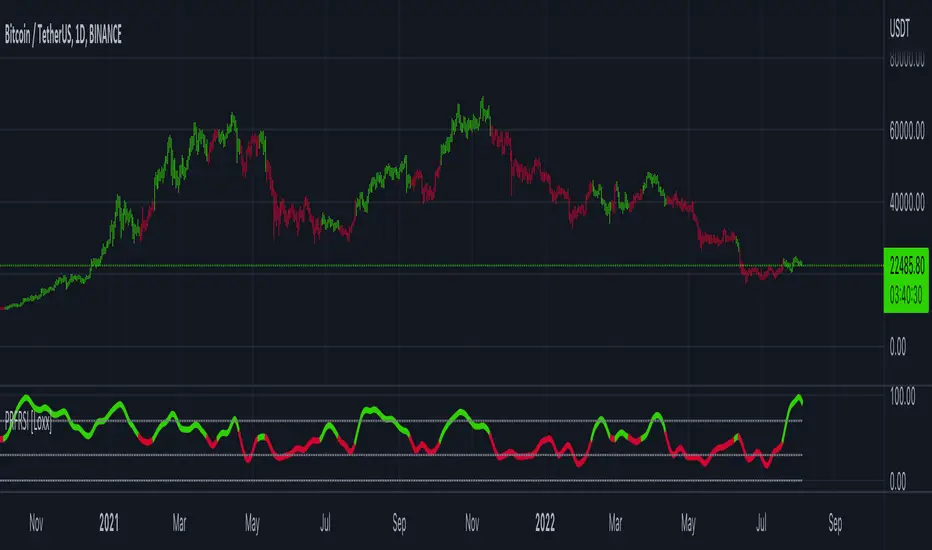
Polynomial-Regression-Fitted RSI [Loxx]Polynomial-Regression-Fitted RSI is an RSI indicator that is calculated using Polynomial Regression Analysis. For this one, we're just smoothing the signal this time. And we're using an odd moving average to do so: the Sine Weighted Moving Average. The Sine Weighted Moving Average assigns the most weight at the middle of the data set. It does this by weighting from the first half of a Sine Wave Cycle and the most weighting is given to the data in the middle of that data set. The Sine WMA closely resembles the TMA (Triangular Moving Average). So we're trying to tease out some cycle information here as well, however, you can change this MA to whatever soothing method you wish. I may come back to this one and remove the point modifier and then add preliminary smoothing, but for now, just the signal gets the smoothing treatment.
What is Polynomial Regression?
In statistics, polynomial regression is a form of regression analysis in which the relationship between the independent variable x and the dependent variable y is modeled as an nth degree polynomial in x. Polynomial regression fits a nonlinear relationship between the value of x and the corresponding conditional mean of y, denoted E(y |x). Although polynomial regression fits a nonlinear model to the data, as a statistical estimation problem it is linear, in the sense that the regression function E(y | x) is linear in the unknown parameters that are estimated from the data. For this reason, polynomial regression is considered to be a special case of multiple linear regression .
Included
Alerts
Signals
Bar coloring
Loxx's Expanded Source Types
Loxx's Moving Averages
Other indicators in this series using Polynomial Regression Analysis.
Poly Cycle
PA-Adaptive Polynomial Regression Fitted Moving Average
Polynomial-Regression-Fitted Oscillator
Poly Cycle [Loxx]This is an example of what can be done by combining Legendre polynomials and analytic signals. I get a way of determining a smooth period and relative adaptive strength indicator without adding time lag.
This indicator displays the following:
The Least Squares fit of a polynomial to a DC subtracted time series - a best fit to a cycle.
The normalized analytic signal of the cycle (signal and quadrature).
The Phase shift of the analytic signal per bar.
The Period and HalfPeriod lengths, in bars of the current cycle.
A relative strength indicator of the time series over the cycle length. That is, adaptive relative strength over the cycle length.
The Relative Strength Indicator, is adaptive to the time series, and it can be smoothed by increasing the length of decreasing the number of degrees of freedom.
Other adaptive indicators based upon the period and can be similarly constructed.
There is some new math here, so I have broken the story up into 5 Parts:
Part 1:
Any time series can be decomposed into a orthogonal set of polynomials .
This is just math and here are some good references:
Legendre polynomials - Wikipedia, the free encyclopedia
Peter Seffen, "On Digital Smoothing Filters: A Brief Review of Closed Form Solutions and Two New Filter Approaches", Circuits Systems Signal Process, Vol. 5, No 2, 1986
I gave some thought to what should be done with this and came to the conclusion that they can be used for basic smoothing of time series. For the analysis below, I decompose a time series into a low number of degrees of freedom and discard the zero mode to introduce smoothing.
That is:
time series => c_1 t + c_2 t^2 ... c_Max t^Max
This is the cycle. By construction, the cycle does not have a zero mode and more physically, I am defining the "Trend" to be the zero mode.
The data for the cycle and the fit of the cycle can be viewed by setting
ShowDataAndFit = TRUE;
There, you will see the fit of the last bar as well as the time series of the leading edge of the fits. If you don't know what I mean by the "leading edge", please see some of the postings in . The leading edges are in grayscale, and the fit of the last bar is in color.
I have chosen Length = 17 and Degree = 4 as the default. I am simply making sure by eye that the fit is reasonably good and degree 4 is the lowest polynomial that can represent a sine-like wave, and 17 is the smallest length that lets me calculate the Phase Shift (Part 3 below) using the Hilbert Transform of width=7 (Part 2 below).
Depending upon the fit you make, you will capture different cycles in the data. A fit that is too "smooth" will not see the smaller cycles, and a fit that is too "choppy" will not see the longer ones. The idea is to use the fit to try to suppress the smaller noise cycles while keeping larger signal cycles.
Part 2:
Every time series has an Analytic Signal, defined by applying the Hilbert Transform to it. You can think of the original time series as amplitude * cosine(theta) and the transformed series, called the quadrature, can be thought of as amplitude * sine(theta). By taking the ratio, you can get the angle theta, and this is exactly what was done by John Ehlers in . It lets you get a frequency out of the time series under consideration.
Amazon.com: Rocket Science for Traders: Digital Signal Processing Applications (9780471405672): John F. Ehlers: Books
It helps to have more references to understand this. There is a nice article on Wikipedia on it.
Read the part about the discrete Hilbert Transform:
en.wikipedia.org
If you really want to understand how to go from continuous to discrete, look up this article written by Richard Lyons:
www.dspguru.com
In the indicator below, I am calculating the normalized analytic signal, which can be written as:
s + i h where i is the imagery number, and s^2 + h^2 = 1;
s= signal = cosine(theta)
h = Hilbert transformed signal = quadrature = sine(theta)
The angle is therefore given by theta = arctan(h/s);
The analytic signal leading edge and the fit of the last bar of the cycle can be viewed by setting
ShowAnalyticSignal = TRUE;
The leading edges are in grayscale fit to the last bar is in color. Light (yellow) is the s term, and Dark (orange) is the quadrature (hilbert transform). Note that for every bar, s^2 + h^2 = 1 , by construction.
I am using a width = 7 Hilbert transform, just like Ehlers. (But you can adjust it if you want.) This transform has a 7 bar lag. I have put the lag into the plot statements, so the cycle info should be quite good at displaying minima and maxima (extrema).
Part 3:
The Phase shift is the amount of phase change from bar to bar.
It is a discrete unitary transformation that takes s + i h to s + i h
explicitly, T = (s+ih)*(s -ih ) , since s *s + h *h = 1.
writing it out, we find that T = T1 + iT2
where T1 = s*s + h*h and T2 = s*h -h*s
and the phase shift is given by PhaseShift = arctan(T2/T1);
Alas, I have no reference for this, all I doing is finding the rotation what takes the analytic signal at bar to the analytic signal at bar . T is the transfer matrix.
Of interest is the PhaseShift from the closest two bars to the present, given by the bar and bar since I am using a width=7 Hilbert transform, bar is the earliest bar with an analytic signal.
I store the phase shift from bar to bar as a time series called PhaseShift. It basically gives you the (7-bar delayed) leading edge the amount of phase angle change in the series.
You can see it by setting
ShowPhaseShift=TRUE
The green points are positive phase shifts and red points are negative phase shifts.
On most charts, I have looked at, the indicator is mostly green, but occasionally, the stock "retrogrades" and red appears. This happens when the cycle is "broken" and the cycle length starts to expand as a trend occurs.
Part 4:
The Period:
The Period is the number of bars required to generate a sum of PhaseShifts equal to 360 degrees.
The Half-period is the number of bars required to generate a sum of phase shifts equal to 180 degrees. It is usually not equal to 1/2 of the period.
You can see the Period and Half-period by setting
ShowPeriod=TRUE
The code is very simple here:
Value1=0;
Value2=0;
while Value1 < bar_index and math.abs(Value2) < 360 begin
Value2 = Value2 + PhaseShift ;
Value1 = Value1 + 1;
end;
Period = Value1;
The period is sensitive to the input length and degree values but not overly so. Any insight on this would be appreciated.
Part 5:
The Relative Strength indicator:
The Relative Strength is just the current value of the series minus the minimum over the last cycle divided by the maximum - minimum over the last cycle, normalized between +1 and -1.
RelativeStrength = -1 + 2*(Series-Min)/(Max-Min);
It therefore tells you where the current bar is relative to the cycle. If you want to smooth the indicator, then extend the period and/or reduce the polynomial degree.
In code:
NewLength = floor(Period + HilbertWidth+1);
Max = highest(Series,NewLength);
Min = lowest(Series,NewLength);
if Max>Min then
Note that the variable NewLength includes the lag that comes from the Hilbert transform, (HilbertWidth=7 by default).
Conclusion:
This is an example of what can be done by combining Legendre polynomials and analytic signals to determine a smooth period without adding time lag.
________________________________
Changes in this one : instead of using true/false options for every single way to display, use Type parameter as following :
1. The Least Squares fit of a polynomial to a DC subtracted time series - a best fit to a cycle.
2. The normalized analytic signal of the cycle (signal and quadrature).
3. The Phase shift of the analytic signal per bar.
4. The Period and HalfPeriod lengths, in bars of the current cycle.
5. A relative strength indicator of the time series over the cycle length. That is, adaptive relative strength over the cycle length.

R-sqrd Adapt. Fisher Transform w/ D. Zones & Divs. [Loxx]The full name of this indicator is R-Squared Adaptive Fisher Transform w/ Dynamic Zones and Divergences. This is an R-squared adaptive Fisher transform with adjustable dynamic zones, signals, alerts, and divergences.
What is Fisher Transform?
The Fisher Transform is a technical indicator created by John F. Ehlers that converts prices into a Gaussian normal distribution.
The indicator highlights when prices have moved to an extreme, based on recent prices. This may help in spotting turning points in the price of an asset. It also helps show the trend and isolate the price waves within a trend.
What is R-squared Adaptive?
One tool available in forecasting the trendiness of the breakout is the coefficient of determination ( R-squared ), a statistical measurement.
The R-squared indicates linear strength between the security's price (the Y - axis) and time (the X - axis). The R-squared is the percentage of squared error that the linear regression can eliminate if it were used as the predictor instead of the mean value. If the R-squared were 0.99, then the linear regression would eliminate 99% of the error for prediction versus predicting closing prices using a simple moving average .
R-squared is used here to derive an r-squared value that is then modified by a user input "factor"
What are Dynamic Zones?
As explained in "Stocks & Commodities V15:7 (306-310): Dynamic Zones by Leo Zamansky, Ph .D., and David Stendahl"
Most indicators use a fixed zone for buy and sell signals. Here’ s a concept based on zones that are responsive to past levels of the indicator.
One approach to active investing employs the use of oscillators to exploit tradable market trends. This investing style follows a very simple form of logic: Enter the market only when an oscillator has moved far above or below traditional trading lev- els. However, these oscillator- driven systems lack the ability to evolve with the market because they use fixed buy and sell zones. Traders typically use one set of buy and sell zones for a bull market and substantially different zones for a bear market. And therein lies the problem.
Once traders begin introducing their market opinions into trading equations, by changing the zones, they negate the system’s mechanical nature. The objective is to have a system automatically define its own buy and sell zones and thereby profitably trade in any market — bull or bear. Dynamic zones offer a solution to the problem of fixed buy and sell zones for any oscillator-driven system.
An indicator’s extreme levels can be quantified using statistical methods. These extreme levels are calculated for a certain period and serve as the buy and sell zones for a trading system. The repetition of this statistical process for every value of the indicator creates values that become the dynamic zones. The zones are calculated in such a way that the probability of the indicator value rising above, or falling below, the dynamic zones is equal to a given probability input set by the trader.
To better understand dynamic zones, let's first describe them mathematically and then explain their use. The dynamic zones definition:
Find V such that:
For dynamic zone buy: P{X <= V}=P1
For dynamic zone sell: P{X >= V}=P2
where P1 and P2 are the probabilities set by the trader, X is the value of the indicator for the selected period and V represents the value of the dynamic zone.
The probability input P1 and P2 can be adjusted by the trader to encompass as much or as little data as the trader would like. The smaller the probability, the fewer data values above and below the dynamic zones. This translates into a wider range between the buy and sell zones. If a 10% probability is used for P1 and P2, only those data values that make up the top 10% and bottom 10% for an indicator are used in the construction of the zones. Of the values, 80% will fall between the two extreme levels. Because dynamic zone levels are penetrated so infrequently, when this happens, traders know that the market has truly moved into overbought or oversold territory.
Calculating the Dynamic Zones
The algorithm for the dynamic zones is a series of steps. First, decide the value of the lookback period t. Next, decide the value of the probability Pbuy for buy zone and value of the probability Psell for the sell zone.
For i=1, to the last lookback period, build the distribution f(x) of the price during the lookback period i. Then find the value Vi1 such that the probability of the price less than or equal to Vi1 during the lookback period i is equal to Pbuy. Find the value Vi2 such that the probability of the price greater or equal to Vi2 during the lookback period i is equal to Psell. The sequence of Vi1 for all periods gives the buy zone. The sequence of Vi2 for all periods gives the sell zone.
In the algorithm description, we have: Build the distribution f(x) of the price during the lookback period i. The distribution here is empirical namely, how many times a given value of x appeared during the lookback period. The problem is to find such x that the probability of a price being greater or equal to x will be equal to a probability selected by the user. Probability is the area under the distribution curve. The task is to find such value of x that the area under the distribution curve to the right of x will be equal to the probability selected by the user. That x is the dynamic zone.
Included:
Bar coloring
4 signal variations w/ alerts
Divergences w/ alerts
Loxx's Expanded Source Types

Trend Momentum Divergence (TMD)Shout out to Lazy Bear, Bunghole, and Trading View for script code for this make.
In this study you will have a visual representation of the strength and momentum of a trend and possibilities of where the market is heading. You can use the Blue and White momentum waves to spot divergences in a up oe down trend for potential reversals. When a green dot appears under the lower level with divergence then it is a indication that we should consider looking to buy. If the red dot appears over the upper level with divergence we should be looking to short/sell. The custom MFI indicator determines how much money is flowing into the market. If it is green that means money is flowing into the market and if it shows red it means that money is flowing out of the market. You can spot divergences in the money flow as well as the RSI. The Blue and Green lines from the RCI3line indicator are used for higher timeframe momentum based on current chart timeframe and we can see when they cross over.

Fisher Transform of MACD w/ Quantile Bands [Loxx]Fisher Transform of MACD w/ Quantile Bands is a Fisher Transform indicator with Quantile Bands that takes as it's source a MACD. The MACD has two different source inputs for fast and slow moving averages.
What is Fisher Transform?
The Fisher Transform is a technical indicator created by John F. Ehlers that converts prices into a Gaussian normal distribution.
The indicator highlights when prices have moved to an extreme, based on recent prices. This may help in spotting turning points in the price of an asset. It also helps show the trend and isolate the price waves within a trend.
What is Quantile Bands?
In statistics and the theory of probability, quantiles are cutpoints dividing the range of a probability distribution into contiguous intervals with equal probabilities, or dividing the observations in a sample in the same way. There is one less quantile than the number of groups created. Thus quartiles are the three cut points that will divide a dataset into four equal-size groups (cf. depicted example). Common quantiles have special names: for instance quartile, decile (creating 10 groups: see below for more). The groups created are termed halves, thirds, quarters, etc., though sometimes the terms for the quantile are used for the groups created, rather than for the cut points.
q-Quantiles are values that partition a finite set of values into q subsets of (nearly) equal sizes. There are q − 1 of the q-quantiles, one for each integer k satisfying 0 < k < q. In some cases the value of a quantile may not be uniquely determined, as can be the case for the median (2-quantile) of a uniform probability distribution on a set of even size. Quantiles can also be applied to continuous distributions, providing a way to generalize rank statistics to continuous variables. When the cumulative distribution function of a random variable is known, the q-quantiles are the application of the quantile function (the inverse function of the cumulative distribution function) to the values {1/q, 2/q, …, (q − 1)/q}.
What is MACD?
Moving average convergence divergence ( MACD ) is a trend-following momentum indicator that shows the relationship between two moving averages of a security’s price. The MACD is calculated by subtracting the 26-period exponential moving average ( EMA ) from the 12-period EMA .
Included:
Zero-line and signal cross options for bar coloring, signals, and alerts
Alerts
Signals
Loxx's Expanded Source Types
35+ moving average types

Fisher Transform w/ Dynamic Zones [Loxx]What is Fisher Transform?
The Fisher Transform is a technical indicator created by John F. Ehlers that converts prices into a Gaussian normal distribution.
The indicator highlights when prices have moved to an extreme, based on recent prices. This may help in spotting turning points in the price of an asset. It also helps show the trend and isolate the price waves within a trend.
What are Dynamic Zones?
As explained in "Stocks & Commodities V15:7 (306-310): Dynamic Zones by Leo Zamansky, Ph .D., and David Stendahl"
Most indicators use a fixed zone for buy and sell signals. Here’ s a concept based on zones that are responsive to past levels of the indicator.
One approach to active investing employs the use of oscillators to exploit tradable market trends. This investing style follows a very simple form of logic: Enter the market only when an oscillator has moved far above or below traditional trading lev- els. However, these oscillator- driven systems lack the ability to evolve with the market because they use fixed buy and sell zones. Traders typically use one set of buy and sell zones for a bull market and substantially different zones for a bear market. And therein lies the problem.
Once traders begin introducing their market opinions into trading equations, by changing the zones, they negate the system’s mechanical nature. The objective is to have a system automatically define its own buy and sell zones and thereby profitably trade in any market — bull or bear. Dynamic zones offer a solution to the problem of fixed buy and sell zones for any oscillator-driven system.
An indicator’s extreme levels can be quantified using statistical methods. These extreme levels are calculated for a certain period and serve as the buy and sell zones for a trading system. The repetition of this statistical process for every value of the indicator creates values that become the dynamic zones. The zones are calculated in such a way that the probability of the indicator value rising above, or falling below, the dynamic zones is equal to a given probability input set by the trader.
To better understand dynamic zones, let's first describe them mathematically and then explain their use. The dynamic zones definition:
Find V such that:
For dynamic zone buy: P{X <= V}=P1
For dynamic zone sell: P{X >= V}=P2
where P1 and P2 are the probabilities set by the trader, X is the value of the indicator for the selected period and V represents the value of the dynamic zone.
The probability input P1 and P2 can be adjusted by the trader to encompass as much or as little data as the trader would like. The smaller the probability, the fewer data values above and below the dynamic zones. This translates into a wider range between the buy and sell zones. If a 10% probability is used for P1 and P2, only those data values that make up the top 10% and bottom 10% for an indicator are used in the construction of the zones. Of the values, 80% will fall between the two extreme levels. Because dynamic zone levels are penetrated so infrequently, when this happens, traders know that the market has truly moved into overbought or oversold territory.
Calculating the Dynamic Zones
The algorithm for the dynamic zones is a series of steps. First, decide the value of the lookback period t. Next, decide the value of the probability Pbuy for buy zone and value of the probability Psell for the sell zone.
For i=1, to the last lookback period, build the distribution f(x) of the price during the lookback period i. Then find the value Vi1 such that the probability of the price less than or equal to Vi1 during the lookback period i is equal to Pbuy. Find the value Vi2 such that the probability of the price greater or equal to Vi2 during the lookback period i is equal to Psell. The sequence of Vi1 for all periods gives the buy zone. The sequence of Vi2 for all periods gives the sell zone.
In the algorithm description, we have: Build the distribution f(x) of the price during the lookback period i. The distribution here is empirical namely, how many times a given value of x appeared during the lookback period. The problem is to find such x that the probability of a price being greater or equal to x will be equal to a probability selected by the user. Probability is the area under the distribution curve. The task is to find such value of x that the area under the distribution curve to the right of x will be equal to the probability selected by the user. That x is the dynamic zone.
Included
3 signal types
Bar coloring
Alerts
Channels fill
Loxx's Expanded Source Types

Fisher OscillatorThe indicator highlights when prices have moved to an extreme level, based on recent prices. This may help in spotting turning points in the price of an asset. It also helps show the trend and isolate the price waves within a trend.
VHF Adaptive ADXm [Loxx]VHF Adaptive ADXm is a variation of the ADX DI indicator with adaptive filtering using a vertical horizontal filter.
What is ADXm?
Unlike the traditional ADX indicator, where the ADX itself is plotted in absolute units and detection of the trend direction is hindered, this indicator clearly displays the positive and negative ADX half-waves (displayed as colored on the chart). And the DI+/- signals are displayed as their difference (gray).
The method of using this indicator is the same as the traditional one.
In addition, it displays the levels (dashed), above which the market is considered to be in a trend state. This level is usually set to approximately 20-25 percents--somewhat depends on the time frame it is used on.
What is VHF Adaptive Cycle?
Vertical Horizontal Filter (VHF) was created by Adam White to identify trending and ranging markets. VHF measures the level of trend activity, similar to ADX DI. Vertical Horizontal Filter does not, itself, generate trading signals, but determines whether signals are taken from trend or momentum indicators. Using this trend information, one is then able to derive an average cycle length.
Included:
Bar coloring
Alerts
Signal types: zero-line crosses, level crosses, or signal crosses

VHF Adaptive Fisher Transform [Loxx]VHF Adaptive Fisher Transform is an adaptive cycle Fisher Transform using a Vertical Horizontal Filter to calculate the volatility adjusted period.
What is VHF Adaptive Cycle?
Vertical Horizontal Filter (VHF) was created by Adam White to identify trending and ranging markets. VHF measures the level of trend activity, similar to ADX DI. Vertical Horizontal Filter does not, itself, generate trading signals, but determines whether signals are taken from trend or momentum indicators. Using this trend information, one is then able to derive an average cycle length.
What is Fisher Transform?
The Fisher Transform is a technical indicator created by John F. Ehlers that converts prices into a Gaussian normal distribution.
The indicator highlights when prices have moved to an extreme, based on recent prices. This may help in spotting turning points in the price of an asset. It also helps show the trend and isolate the price waves within a trend.
Included:
Zero-line and signal cross options for bar coloring
Customizable overbought/oversold thresh-holds
Alerts
Signals