Exhaustion Zone [by rukich]🟠 OVERVIEW
The indicator shows asset exhaustion — an area of interest where potential buying opportunities can be considered.
🟠 COMPONENTS
The indicator is based on a combination of fundamental tools designed to properly react to price movement and volatility.
It is displayed on the chart as a green line. When the price touches the indicator line, the candle lights up and is highlighted in green.
🟠 HOW TO USE
The best timeframes for using the indicator: 1D and 3D.
Since the indicator is used on higher timeframes, the price rarely reaches the indicator line, but it often shows a strong reaction when it does, which suggests that the indicator can be used for investment purposes.
Since the zone suggests potential buying opportunities, it’s best to act from the zone only when a reaction is confirmed. Confirmation may include a candle close beyond nearby fractals or the invalidation of the nearest resistance zone.
🟠 CONCLUSION
The indicator highlights an area of interest where, upon confirmation of a reaction, buying opportunities may be considered.
Cerca negli script per "zone"

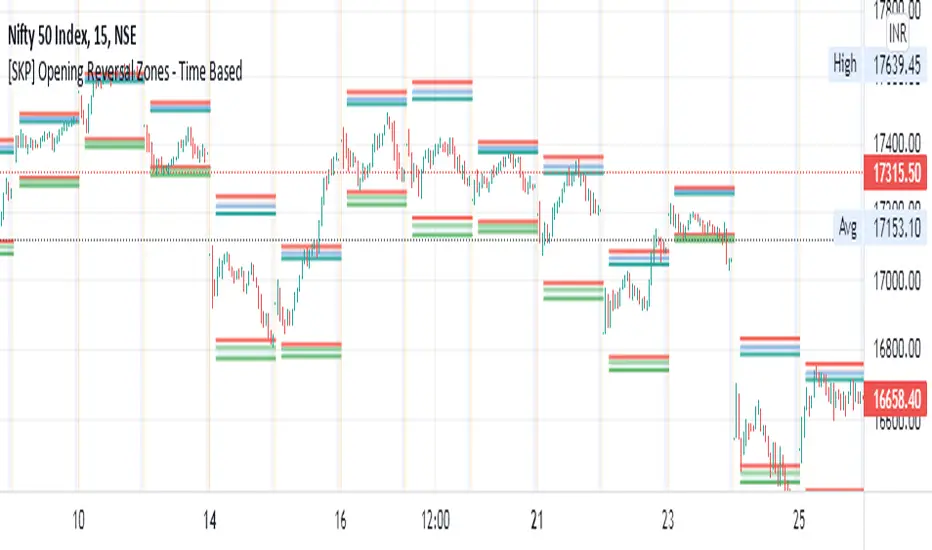
[SKP] Opening Range Reversals with FIBO zonesopening range reversal zones with fibo .50, .618, .786, 1 levels
opening range time can set as you like, 15M, 30M etc
entry at .50 and .618 levels with stop loss .786 and 1 levels.
do backtest and practice..
idea from author colejustice
Smooth Moving Average Zones @PuppyTherapyThis script is basically a showcase of what you can graphically do to a moving average.
You have access to
2 sets of 4 moving averages each of those can use HA Candles as a source ( calculated in the script will not repaint if you are concerned with that )
additional smoothing to each set
a multitude of moving average types I am too lazy to type out ( please give me a thumbs up for honesty )
each moving average has a shade + zone
If you happen to like it and use just a few of those I would suggest you remove smoothing as it eats a lot of performance of making your own script of what you actually use to really bost with the performance. I am fully okay with you copying and sharing this idea. Just remember to share the colors!
PS: I would like to thank pinescripters RicardoSantos / LucF / everget !

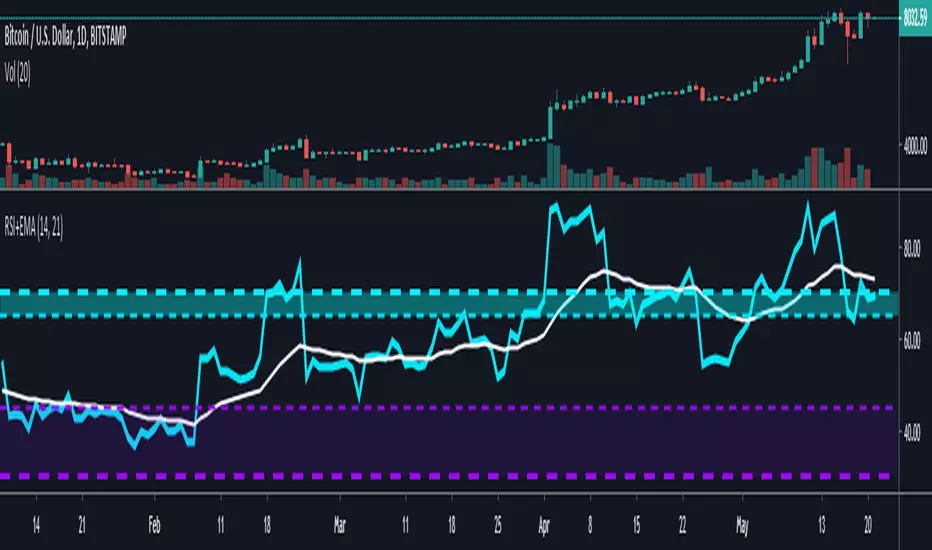
RSI + EMA with Multiple ZonesThis is your traditional RSI chart but with a few modifications
I added an extra zone parameter that you can specify with its own color and line customization.
There is an EMA that tracks the RSI as well.
SMART4TRADER-Margin ZONEIndicator based on marginal zones (according to Mityukov Sergey). In open source.
Formula for calculating the margin:
Margin size / cost tick * minimum price change
Example:
EURUSD = 2100 $ / 6.25 $ * 0.00005 points = 0.01680 points
....
For currency pairs where USD is in the first place it is necessary to write so that the indicator is taken away from zero
Iff (ticker == "USDCAD", (0- (950/5 * 0.00005)),
//////////////////////////////////////////////////////////////////////////////////////////////////
Индикатор на основе маржинальных зон (по Митюкову Сергею). В открытом исходном коде.
Формула рассчета маржи:
размер маржи / стоимость тика * минимальное ценовое изменение
Пример:
EURUSD = 2100 $ / 6.25 $ * 0.00005 points = 0.01680 points
....
Для валютных пар где USD стоит на первом месте нужно писать так, чтобы показатель отнимался от нуля
iff (ticker=="USDCAD", (0-(950/5*0.00005)),
//////////////////////////////////////////////////////////////////////////////////////////////////

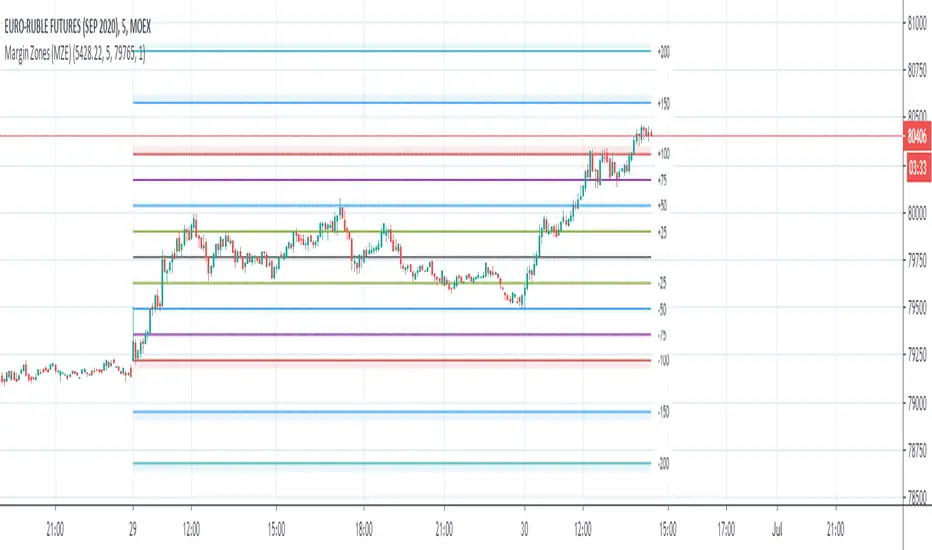
Margin Zones (MZE)Upgraded indicator Margin Zones with various number of options:
- Number of Days Ago to limit days when Zones are visible
- Price, margin and ticks can be set with decimal point
- Zones can be switched off separately
- all line are editable
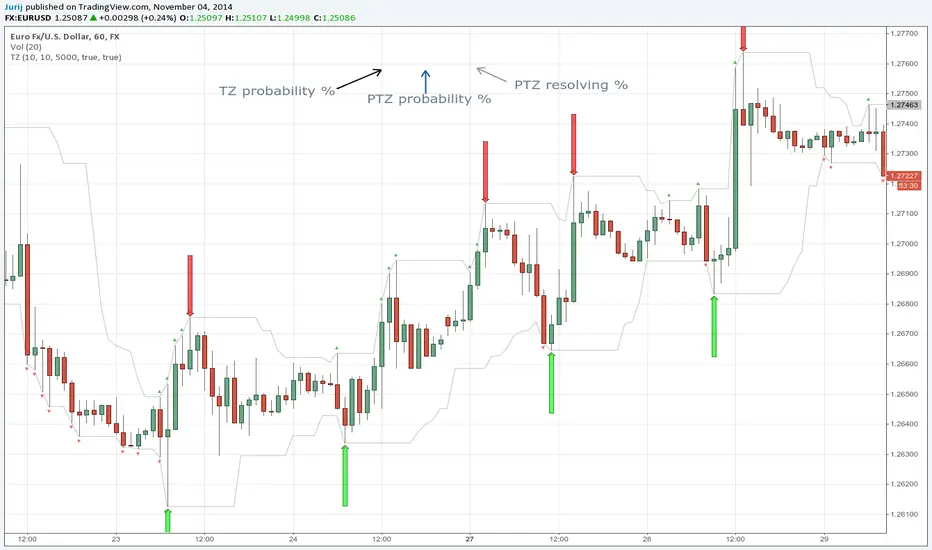
Transient Zones v1.1Simple indicator to visualize Transient Zones (TZ) and Potential Transient Zones (PTZ).
The last 3 numbers in the header represent: probability of true TZ (black), probability of PTZ (navy) and probability of PTZ resolving (gray).
Original ForexFactory thread by EURUSDD www.forexfactory.com
Version 1.1:
- Added TZ/PTZ occurrence probability thanks to SPYderCrusher
Todo:
- Mid bar transient zones detection
- Draw rectangles for zones (once rectangle drawing gets implemented in pine script) or use dot/circle lines
- Mark forming PTZs more clearly
Previous version 1.0:
Transient ZonesUpdated version 1.1:
Simple indicator to visualize Transient Zones (TZ) and Potential Transient Zones (PTZ).
Original ForexFactory thread by EURUSDD www.forexfactory.com
Todo:
- Mid bar transient zones detection
- Draw rectangles for zones (once rectangle drawing gets implemented in pine script)
- Mark forming PTZs more clearly

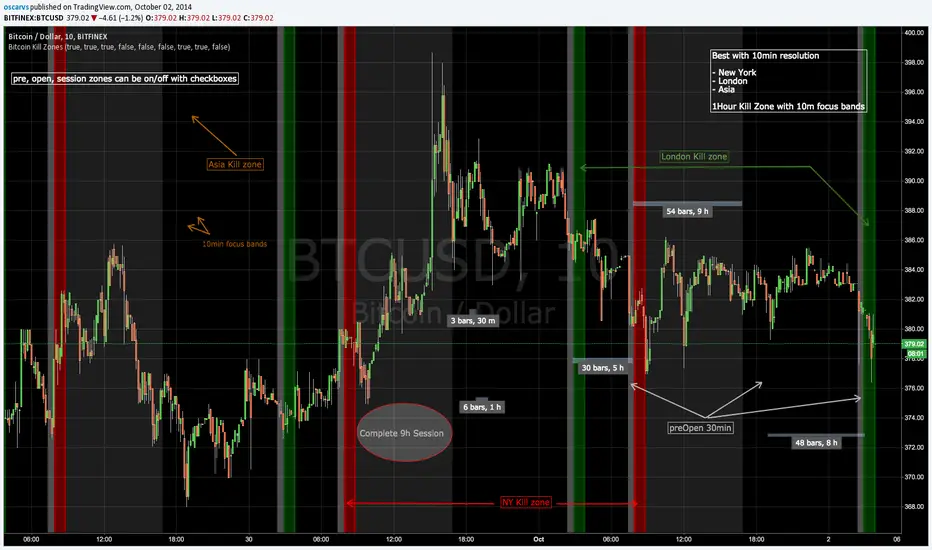
Bitcoin Kill ZonesGRAB THE LASTEST VERSION HERE:
*********************
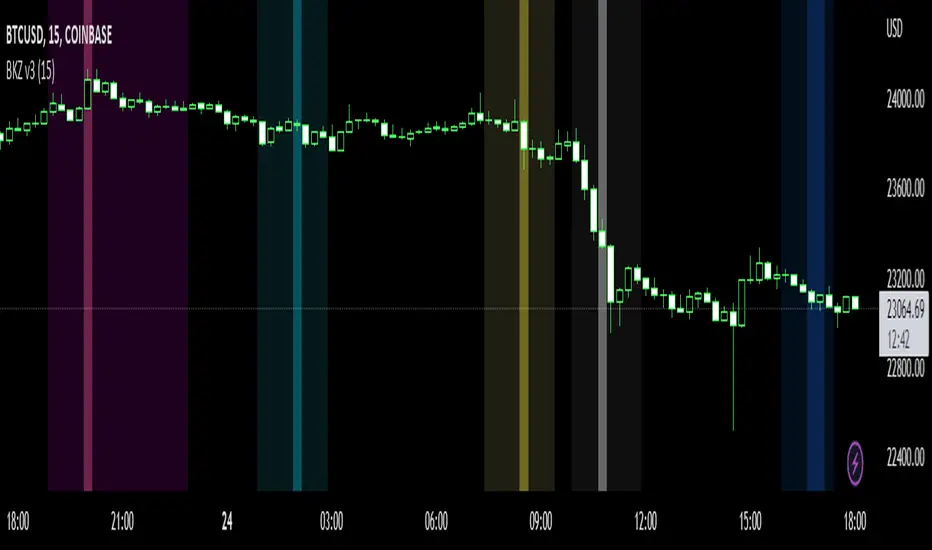
This indicator shows when the candle is entering New York, London or Asia Kill Zone (open market).
gray: 30min before market opens.
red, green, orange: First 1 hour with 10min focus bands.
silver: complete 30min session market until close.
FIX NOTE:
Set this hours for Asia to fix the 1 hour difference:
2330-0000
0000-0010
0010-0050
0050-0100
0100-0900
* this is beta, in planning to mark dynamically ranges before/after open/close session and use some Fibs to have some ripple effect indicator
Updated code: github.com
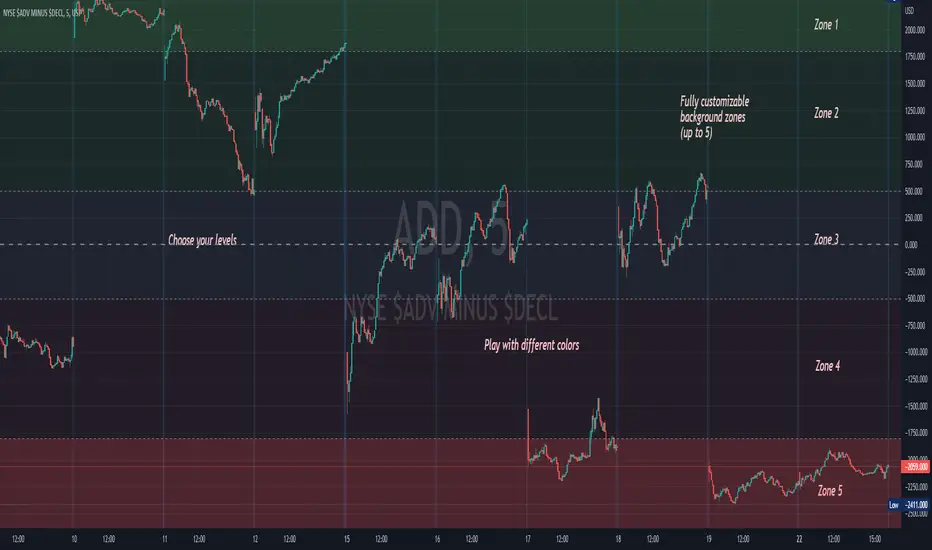
Background ZonesThis script provides up to 5 zones to apply background colors. This is especially useful for applying to indices such as USI:TICK , USI:ADD , and USI:VOLD , where certain levels provides significant meaning to market sentiment and directions. This script will give you the visual cue to help with your trading.
All levels and colors are fully customizable.
Enjoy~!!
Example:
NSDT Pivot ZonesThis is a new take on Traditional Pivot Points. By modifying the calculations, we were able to create "pivot zones" with a decent degree of accuracy.

Bitcoin Logarithmic Growth Curves & ZonesI found this awesome script from @quantadelic and edited it to be a bit more legible for regular use, including coloured zones and removing the intercept / slope values as variables, to leave space for the fib levels in the indicator display. I hope you all like it.


Multiple EMAs with marked zones and custom timeframe supportThis script plots 10 exponential moving averages and marks the areas between them.
The lengths are Fibonacci numbers starting from 5 and ending with 377.
The colors indicate the length of the moving average, green for the shortest and purple for the longest.
The zones between consecutive EMA's (e.g. 5 and 8 ema ) are market according to the color of the greater one in value.
By default the script plots values for the current time frame, but supports custom time frames.
I'm releasing this script with an open visibility. Feel free to suggest improvements!
Enjoy,
s0ullight


Bitcoin Kill Zones v2 |7Day| [oscarvs] [xeno]This edit adds weekends to Bitcoin Kill Zones v2 by oscarvs and other contributors. Bit of an experiment. Enjoy.
Volume Zone Oscillator and Price Zone (VZO/PZO) [NeoButane]" Volume Precedes Price is the conceptual idea for the oscillator."
"The main idea of the VZO was to try to change the OBV to look like an oscillator rather than an indicator, also to include time; primarily to identify which zone the volume is located in during a specific period "
How to read this indicator:
Positive reading -> bullish
Negative reading -> bearish
-60 or 60 is seen as the limit of the oscillator range, and a pullback should be expected from there.
Plus and minus signs have been added to the top and bottom for VZO and PZO, with an adjustable threshold to trigger.
Alert conditions have been added to this indicator for ease of use.
Volume Zone Oscillator, write-up by the author (recommended reading)
http:capitalsynergy.com/resources/IFTA09VZO.pdf
Volume Zone Oscillator, uses and formula
https:www.investopedia.com/articles/active-trading/072815/how-interpret-volume-zone-oscillator.asp
Price Zone Oscillator, uses and formula
https:www.investopedia.com/terms/p/price-zone-oscillator.asp

Adaptive Price Zone Strategy The adaptive price zone (APZ) is a volatility-based technical indicator that helps investors
identify possible market turning points, which can be especially useful in a sideways-moving
market. It was created by technical analyst Lee Leibfarth in the article “Identify the
Turning Point: Trading With An Adaptive Price Zone,” which appeared in the September 2006 issue
of the journal Technical Analysis of Stocks and Commodities.
This indicator attempts to signal significant price movements by using a set of bands based on
short-term, double-smoothed exponential moving averages that lag only slightly behind price changes.
It can help short-term investors and day traders profit in volatile markets by signaling price
reversal points, which can indicate potentially lucrative times to buy or sell. The APZ can be
implemented as part of an automated trading system and can be applied to the charts of all tradeable assets.
Green color is long.
Red color is short.
WARNING:
- For purpose educate only
- This script to change bars colors.

Adaptive Price Zone Indicator The adaptive price zone (APZ) is a volatility-based technical indicator that helps investors
identify possible market turning points, which can be especially useful in a sideways-moving
market. It was created by technical analyst Lee Leibfarth in the article “Identify the
Turning Point: Trading With An Adaptive Price Zone,” which appeared in the September 2006 issue
of the journal Technical Analysis of Stocks and Commodities.
This indicator attempts to signal significant price movements by using a set of bands based on
short-term, double-smoothed exponential moving averages that lag only slightly behind price changes.
It can help short-term investors and day traders profit in volatile markets by signaling price
reversal points, which can indicate potentially lucrative times to buy or sell. The APZ can be
implemented as part of an automated trading system and can be applied to the charts of all tradeable assets.

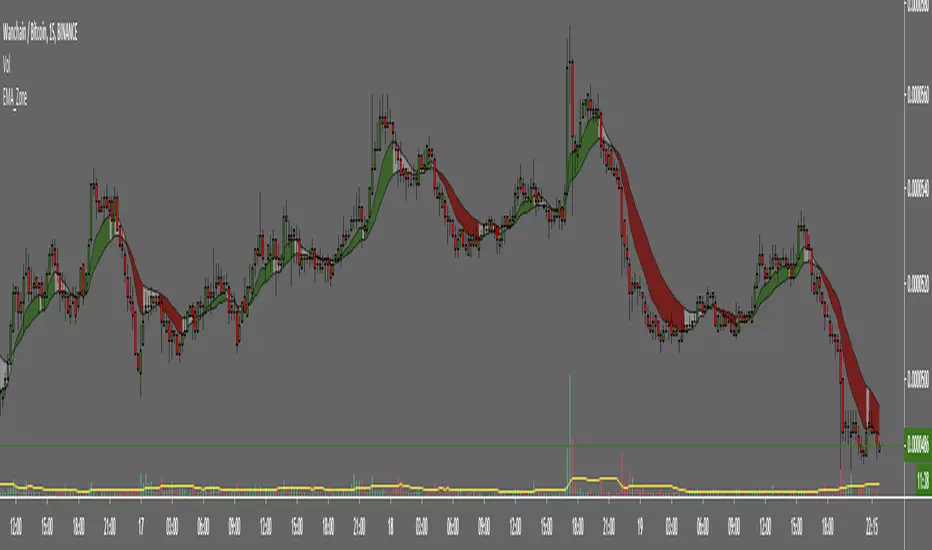
EMA ZoneIndicator to fill the ZONE between two EMAs (9 and 21 is the default)
RULES of completion:
CLOSE above "EMAs" and "EMA SLOW", and "EMA FAST" > "EMA SLOW" = green fill
CLOSE below "EMAs" and "EMA SLOW" ,and "EMA FAST" < "EMA SLOW" = red fill
CLOSE between EMAs = white fill

Zones DetectorThis indicator highlights supply and demand zones.
Method to detect the zones:
1.- The body of the candle is calculated and it is checked how many times it can be repeated in its highest or lowest wick. If the body of the candle is repeated N number of times (Min. Factor) in any of its wicks, it is taken as an indecision zone.
2.- The subsequent candles are reviewed (Confirmation Bars) to determine if the zone is of supply or demand. For demand zones, subsequent prices must be above the minimum price of the indecision zone and for supply zones, subsequent prices must be below the maximum price of the indecision zone.
3.- The previous average volume of N periods (Periods) to the indecision zone is calculated and check that has a minimum percentage change (Min. Volume Change) with respect to the indecision zone and its subsequent candles (Confirmation Bars).
If the previous steps are met, the zone will be highlighted with a green color for demand (Zones/Demand) and red for supply (Zones/Supply), for the indecision zones (identified by point 1) they will be highlighted in gray (Zones/Indecision)
Invalid zones are automatically hidden from the chart, using methods such as: "wick" and "close".
Settings
Indecision
Min. Factor: Set the number of times that the body of the candle must be repeated in its wicks. High values will be stronger indecision zones, but fewer will be found, low values will find more zones.
Invalidation Method: Method used to automatically invalidate zones. It can be "wick" or "close".
Confirmation Bars: Defines the number of candles used to confirm an indecision zone found
Volume
Min. Volume Change(%): Percentage of minimum change in volume (+/-) that the zone must have to be displayed
Previous Periods: Number of previous periods to be used to calculate the average volume prior to the indecision zone.
Zones
Show Last.- Number of zones (demand, supply, indecision) to be shown.
Demand.- Color to highlight the demand zones
Supply.- Color to highlight the supply zones
Indecision.- Color to highlight the indecision zones
Use
The highlighted supply and demand zones can be used as support or resistance to place orders.
