Sellsignal
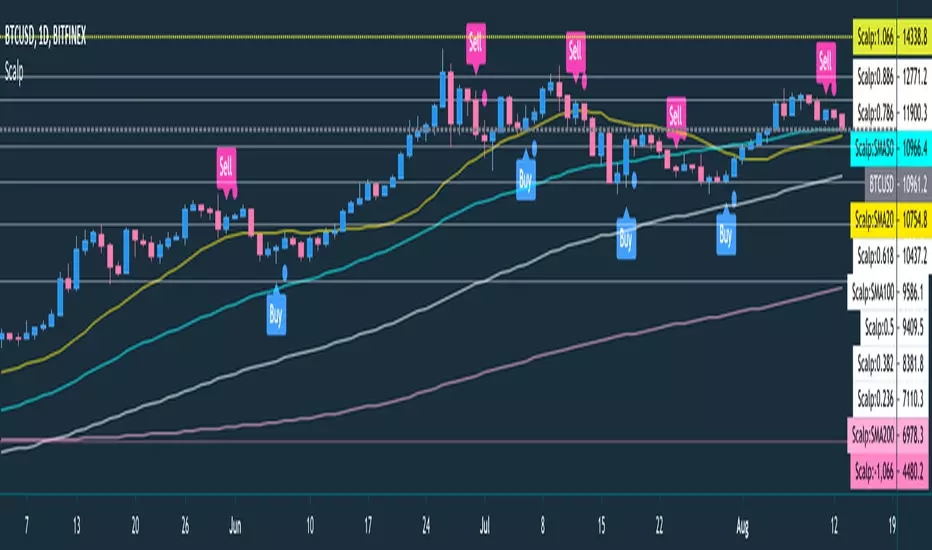
Very easy scalping indicator for non skilled traderThunderScalp is bundled indicator for scalping trader with simple usage and high winning rate. It works for any time frame.
The indicators are:
Humidity Pole Signal is Buy or Sell signal based on Humidity indicator or volume consolidation mapping
Interactive Signal is Buy or Sell signal based on Chart Pattern analyzer
Pivot Support and Resistance is candle support and resistance up to 3 layer for each
Fractal Support and resistance is support and resistance based on fractal candles
Scalping MA is moving average lines which best suite for scalping

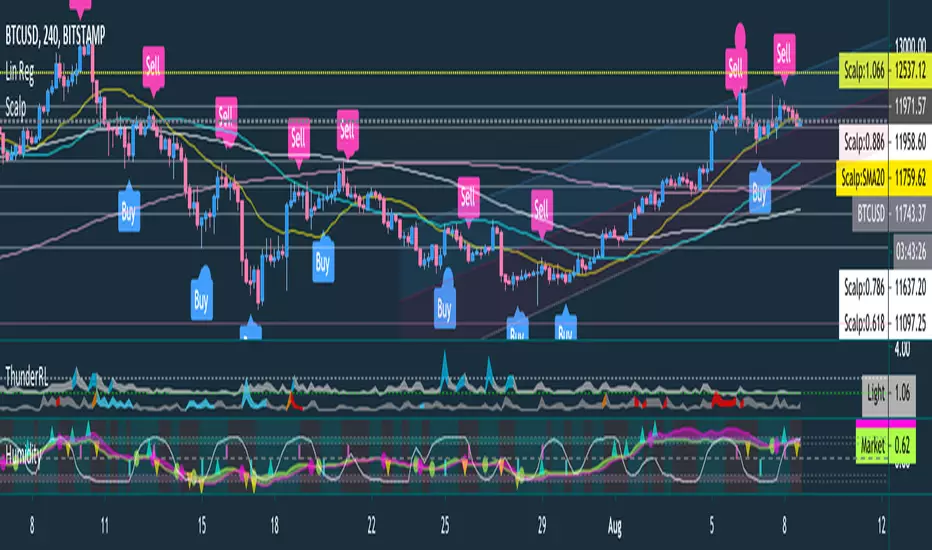
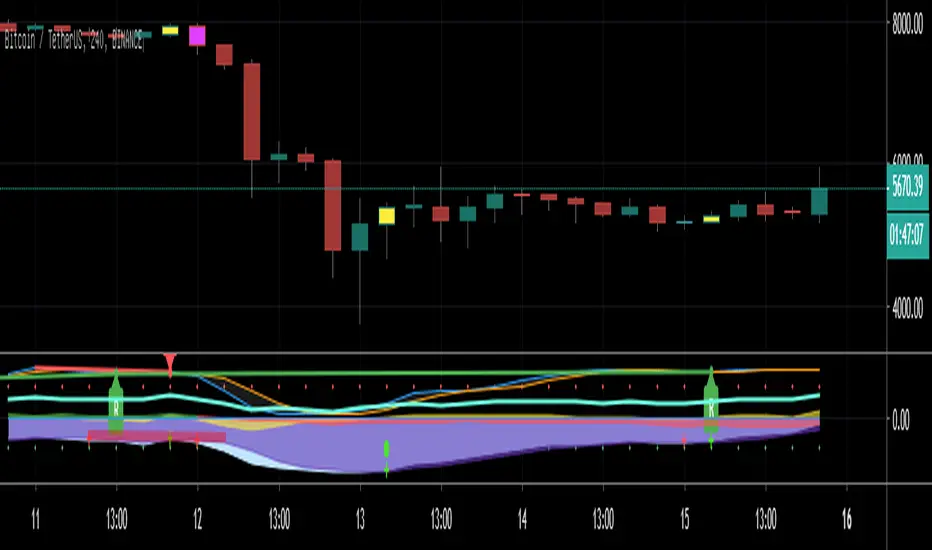
Buy and Sell scanner by ThunderTraderHumidity contains indicators:
Stocashtic RSI : is provided as background color, where the green is uptrend and the orange is downtrend
Buy/Sell Pole : the red line from top is signal for sell and green line from bottom is signal for buy
Humidity Ribbon : is price trend ribbon, if the ribbon touch or cross-down the bottom area (the red zone), means accumulation is started and best area to buy, but when ribbon touch cross up the top area (blue zone), means the uptrend is very strong. Ribbon cross down from top area can be used as breakout to sell and also ribbon cross up from bottom area can be used as breakout to buy.
Market Wave : is market circulation where 1 top and 1 bottom are equal to 1 circulation, if 1 circulation is ended then it will be best position to buy or if line touches the bottom, it can be used to buy and vice versa
Mayer Multiple Optimal Multi-Color Histogram [aamonkey]Mayer Multiple developed by Trace Mayer gives the ratio of price to 200 daily moving average.
Buy when it's white sell when it's orange.
Is intended for use on day chart only.
This is an extension of the Mayer Multiple developed by Trace Mayer.
Normally you only have 2 thresholds signaling buying or selling (blue and yellow).
However, I added 2 more thresholds signaling optimized buys and sells (white and orange).

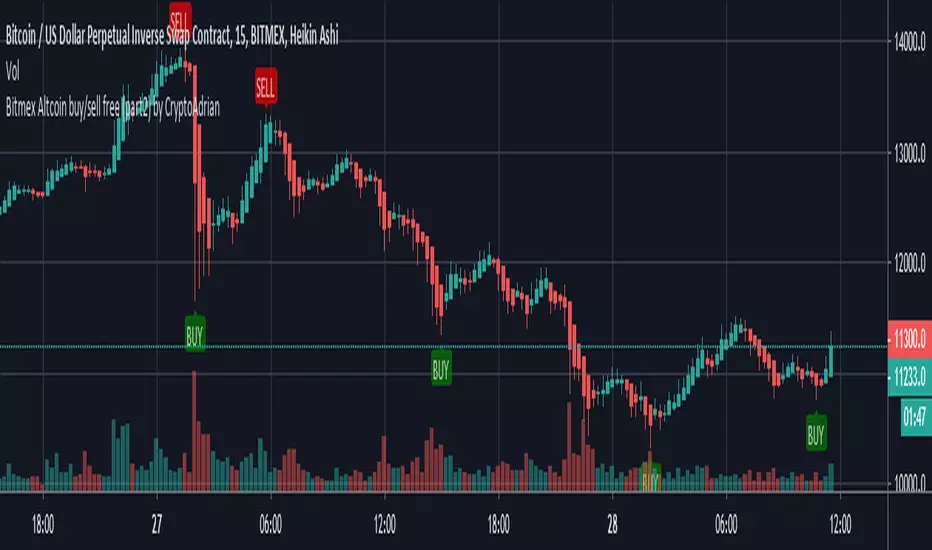
Bitmex Altcoin buy/sell free (part2) by CryptoAdrianThis script has two parts Bitmex Altcoin buy/sell free (part1) by CryptoAdrian and Bitmex Altcoin buy/sell free (part2) by CryptoAdrian
Combination of two will give you better results with clarification.
(soon will be published as one script)
For better results observe it for some time. If you didn't get how to use it PM me I will brief you :)
Hope you will like this. For any detail or doubts you can PM me on TV. I will try to reach you out ASAP .
Part-1
Part-2
Part-1 + Part-2
Please add this script to your fav so incase you find it difficult to find it can be seen in your fav and you will get it.
Thank You and happy trading :)

Gravity Swing Oscillator V1 - optimized for CryptoGravity Swing Oscillator V1 - optimized for Crypto
- Top & Bottoms
- Buy / Sell Signals on colorchanging LED Dots
- can show danger Price Dop Zones on Bars
Mossy ADX and DI with Buy/Sell SignalsBasic ADX DI with colored bars to show buy and sell signals , made for 1min but shows general signals of strong or weak buy and sell signals.
Dark Red = Heavy Signal
Light Red = weak signal
Green = buy signal
Dark Green = Heavy Signal
Colors are to confirm or warn, Buy/Sell points are where to enter and exit.
Mossy ADX DI colored bars for quick scalping, works best with Heikin Ashi, confirm with other indicators, Mossy Pop is one shown and works well to confirm.


™TradeChartist Entry/Exit Indicator™TradeChartist Entry/Exit Indicator is an easy to use indicator that plots very high probability BUY and SELL signals on the chart along with an optional dynamic trigger line for SELL and BUY which can be used as a reference for Stop Loss/ Trailing Stop Loss.
What does the ™TradeChartist Entry/Exit Indicator do?
Plots very high probability BUY and SELL signals on chart
Plots dynamic BUY or SELL trigger lines that can be used to
---------1. Set Stop Loss reference or Trailing Stop Loss.
---------2. Anticipate change in trend/momentum when price breaches the trigger line.
Plots BUY and SELL price lines which are Candle open prices when BUY/SELL signals are posted.
Alert traders when BUY/SELL signal is generated and Trigger for BUY/SELL is breached.
Plots Background vertical Signal break lines at BUYs in green and at SELLs in red.
Plots % Gains based on candle close in real-time and based on candle high for BUY/candle low for SELL on previous candles calculated from the candle open price at BUY/SELL.
Plots RSI colour candles based on user preferred Overbought and Oversold RSI levels from indicator settings.
Paints background colour for BUY and SELL zones which can be changed from indicator settings under Style tab to personalise the chart screen.
What markets can this indicator be used on?
Forex
Stocks
Commodities
Cryptocurrencies
and almost any asset on Trading View
Works really well when there is good volume, volatility or both in the asset observed/traded.
Does this indicator repaint?
No and Yes
Once the confirmed BUY (in green) and SELL (in red) signals are posted after a candle close, it doesn't repaint.
Repainting happens for real time BUY and SELL trigger plots on the current candle as price tries to breach the trigger line.
For confirmed BUY and SELL alerts, use alerts on candle close. Real-time BUY and SELL trigger alerts can also be set.
Does the indicator send alerts when a signal is generated?
Yes, traders can get alerts by setting Trading View alerts for BUY/SELL Signals and BUY/SELL Triggers. For confirmed BUY/SELL alerts, 'Once per bar close' must be used.
Why are there two Signal Generator types in the indicator settings?
The two types of signal generators cater to almost all types of traders and trade types. Some assets perform well with Type 1 and some assets with Type 2. Also some traders prefer Type 1 and some prefer Type 2 based on variation in frequency of signals on the asset observed. Both types can be used along with 'Use Heikin Ashi Candles' from the indicator settings to have more combinations to test on an asset for maximising gains.
Type 1 on GBPUSD 1hr chart
Type 2 on GBPUSD 1hr chart
Type 1 normally works well with most types of assets.
Should the indicator be used on normal candles or Heikin Ashi candles?
The indicator can be used on either of the candle types. If signals from Heikin Ashi chart needs to be plotted on normal chart, just check 'Use Heikin Ashi Candles' from indicator settings. It may not be exact, but very close as it mimics Heikin Ashi chart trend.
Heikin Ashi charts are recommended to spot trends and reversals but they don't reflect real OHLC values in the candles, so BUY/SELL entry price points may not be ideal using Heikin Ashi charts especially when there are gaps in price action (example Stocks, FOREX, Commodities). For real OHLC prices and to know exact price points for entering/exiting trade, use normal candlestick charts. It is purely for this reason Heikin Ashi chart signals can be mimicked on normal candles using 'Use Heikin Ashi Candles' option from settings without having to switch between the two.
It can be seen from the GOLD 1hr charts above (Heikin Ashi on left and normal candlestick chart on right), the indicator mimics signals sensibly (not copy) and doesn't use same entry values as Heikin Ashi chart to aid the trader with practical trade execution.
How do the Trigger Lines work and should they be used?
Trigger for BUY/SELL lines are coded to adapt to bull and bear power in the asset trading environment and helps the trader to anticipate change in trend based on direction of price momentum when enabled from indicator settings (On by default). Traders can use trigger lines as reference for Stop Loss points. For example, when a BUY signal is posted, the 'Trigger for SELL' can be used as initial Stop Loss reference and as price starts going up, the trigger line starts moving up enabling the trader to use it as a trailing stop loss point which helps secure or lock profits as they act as ideal support/resistance lines based on the type of trade too. BUY/SELL Trigger lines can be enabled or disabled from indicator settings 'Inputs' tab.
Also, the trigger lines can alert traders to anticipate change in trend/momentum when price hits them and it helps them take a position, either Long or Short when confirmed BUY/SELL signal is posted. As price tries to breach the trigger lines, they change from 'Trigger to BUY/SELL' to 'BUY/SELL Triggered' as shown below on 1hr Gold chart. This feature is coded purely to signal the trader a potential change in trend/momentum. The trigger lines also act as strong support/resistance so only a confirmed close above them will ensure a High Probability Trade.
It should also be noted that price tends to test the BUY/SELL trigger lines to see if a breach is possible. A rejection at trigger lines could mean trend continuation in the signal direction. Traders could use other trend indicators like Ichimoku cloud, stoch, TRIX etc. to make an informed trade decision here. In the chart below, the 'BUY triggered' label has changed back to 'Trigger for BUY' as price failed to close above it.
What is the use of 'Plot BUY/SELL Price Line'?
Enabling BUY/SELL price line from settings (On by default) plots the price line corresponding to candle open when BUY/SELL signals were posted on the chart by the indicator. Open price is used as it is close to the trigger lines and is a fair reference point for indicator to calculate the gains plot on chart since BUY/SELL signals.
Can trade gains be plotted on chart and how are they calculated?
To show percentage gains on chart, just enable 'Show % Gains on Chart' from indicator settings (Off by default). As explained above, % gains are calculated from BUY/SELL candle Open price to high (for Long trades) or low (for Short trades) and to current candle close (for both Long and Short trades) as it helps see real-time gains from BUY/SELL candle Open price. The % gains are plotted as below.
0 - 0.75% - ↑ in green
0.75-1.5% - 1% in green
1.51-2.5% - 2% in green
2.51-3.5% - 3% in green
3.51-4.5% - 4% in green
4.51-5.5% - 5% in green
5.51-10.5% - 5+% in green
10.51-20% - 10+% in green
20+% - 20+% in green
Down from Entry - ↓ in red
What are RSI Colour Candles?
RSI Colour Candles are visual candle plots in colour (Blue when RSI>60, Yellow when RSI<30 and On by default) that help trades spot RSI levels at a glance visually from the chart in real-time without the need for another indicator on screen. Traders can also choose the source to be used for plotting RSI colour candles from indicator settings input tab and change candle colours from indicator settings style tab. The length for RSI calculation is 14 and works well for almost any trading scenario and cannot be changed from indicator settings. The default overbought RSI is set at 60 as it helps spot momentum increase and big moves happen above 60 RSI. When deciding to sell or buy, RSI can be tuned from settings to spot decent entry or exit. For example, RSI>80 on a red Heikin Ashi candle (blue body and red border) after an uptrend could signal potential sell-off or RSI<30 on a green Heikin Ashi candle (yellow body and green border) after a down trend could signal a good move up. In the example daily chart of RVN-BTC below, RSI>75 on a red Heikin Ashi candle signalled a potential sell off way before the actual SELL signal plot on chart.
What is the use of Signal Break Line Plot and Paint Background options from indicator settings?
Signal break lines can be useful if traders prefer to switch off BUY/SELL signals from indicator settings to show where previous signals were generated. (On by default)
Paint Background is just a nice to have feature that paints the signal zones to personalise the chart screen. (Off by default). The background paint colours can be changed from indicator settings style tab.
4hr SPX chart below showcases the difference when the Signal Break Lines and Background Paint options are used with BUY/SELL signals switched off.
Important Note:
When using this indicator on a chart, check 'Scale Price Chart Only' and 'Auto (Fits Data to Screen)' by clicking on settings wheel on the bottom right under the chart screen as shown below. If not checked, the chart screen will look like one on the left as shown below.
-----------------------------------------------------------------------------------------
This is not a free to use indicator. Get in touch with me if you would like access to the indicator for a 1 day trial before deciding on a paid access for a period of your choice. Monthly, Quarterly, Half-Yearly and 1 Year access available.
-----------------------------------------------------------------------------------------

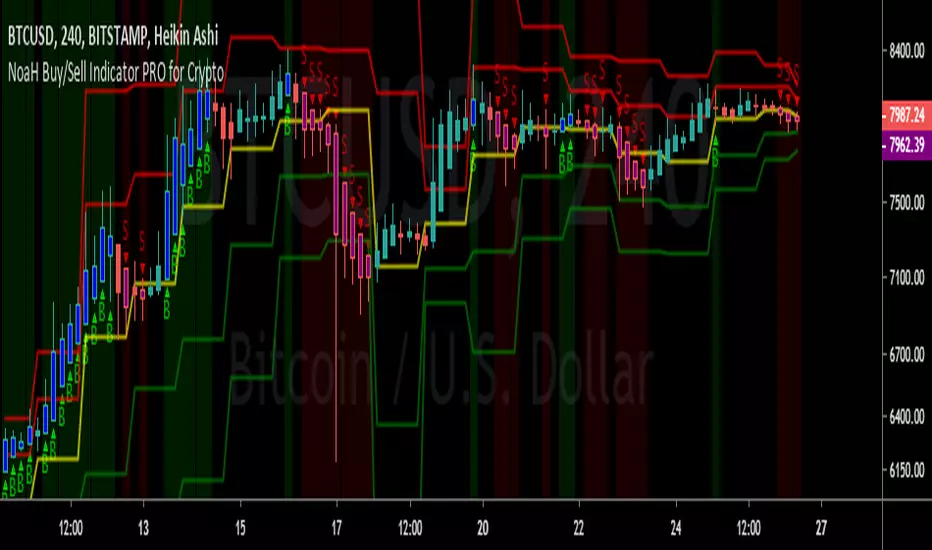
NoaH Buy/Sell Indicator PRO for Crypto Noah Crypto introduces an improved specified version Buy/Sell indicator for cyptocurrency market.
- This indicator can work for all pairs on all exchanges but for CRYPTO MARKET ONLY. Don't use it for margin trading or other markets.
- This indicator was optimized for Heikin Ashi chart, so please use it on Heikin Ashi charts only. Wrong chart may lead to wrong signals.
- This indicator shows best performance at M30, H4 and D1. So it is very suitable for day traders or scalp traders.
BENEFITS OF THIS VERSION:
- Show Buy/Sell zones: Good buy zone are 3 first candles marked with 'B' letter, close/exit buy on first 'S' candle confirmed.
- Targets and stop-loss are shown directly on chart. Buy/Sell areas have Green/Red background.
- No 'B' or 'S' marked on candles indicates the undecided market, wait for trend to be more clear to put orders.
- Applicable to set alarm when a coin reaches entry, sell targets or stop-loss.
PM me for 1 day trial and monthly fee, or if you have question or need support.
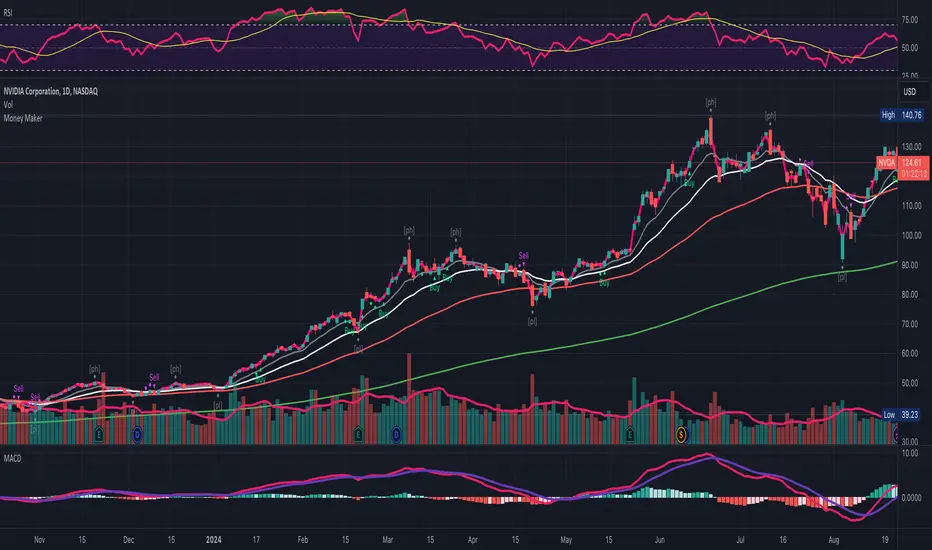
Money Maker [Buy/Sell Signals] | Easy To UseThis script will give you simple buy and sell signals based on price, moving averages and volume.
The diamonds shaped signals are for you to watch for a breakout. Green to upside and pink to the downside.
If the breakout occurs, then you will see either a Buy signal or a Sell signal.
Examples:
Enjoy!
S73 Buy_Sell_Indicator WIth S/RPretty simple indicator.
Use with caution, it is my first one.
Essentially it looks at volume along with other oscillators to give a buy or sell signal.
I would recommend trading with the trend. When we are below the 26 EMA trendline only go short, when above only go long. You have the ability to change the EMA values. Personally if using an EMA, my preference is 26. It just depends on your risk tolerance and the time frame you are working on as to what you choose to use.
It can give you a signal towards the end of a trend. This is due to volume build up, and oscillator strength.
So use it with caution, while testing it out, use it as a quick scalp, in and out tool. Or make sure you follow the trade with a trailing stop.
You can use the S/R clouds as exit points. Or use manually drawn supports and resistances, again your choice.
You can use it with Candles or Heikin Ashi. Personally I have found Heikin Ashi to give a good indication of trend, but keep in mind the difference between standard candles and Heikin Ashi.
It also has 3 x inbuilt EMA's. Handy value if using all three are 8, 26, 50.
Feedback appreciated.
PS: It also utilises the S&R script provided by samuelhe i, so thanks for providing the S&R script samuelhei. If you like teh support and resistance feature, please go give samuelhei a btc tip.
PPS: Big thanks to vjsharma89 for helping put it together.

Sell / Buy RatesThis script finds sell / buy rates and adds its linear regression to the chart. its aim is finding buying and selling power, then you can try to find trend reversals. Also you can find divergences, it's very important signal for trend reversal.
Linear regression is a basic and commonly used type of predictive analysis.
if you choose lower periods then it will be more sensitive. I choose 34 as it's one of fibonnaci number.
If you find my works useful, please consider a donation
BTC: 16XRqyS3Vgh1knAU1tCcruqhUrVm4QWWmR

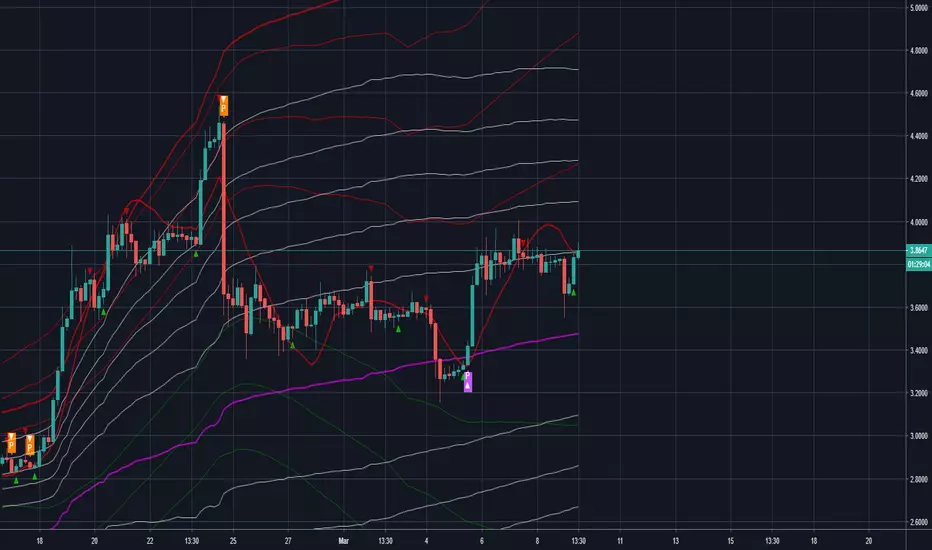
Crypto Signals - by @cryptomrdavis - [BETA]Working on some new algorithms to get the best results while trading. For now the signals are solid but there is still to much noise - need to reduce it.
When the noise is gone, this will be a very simple but effective indicator.
More examples

Fib Divergence SystemCombo of many useful indicators which includes fib lines, time and money channels and divergence buy sell signals
Credits for source code:
Scarf, Lazybear, 100kiwi

Trading System(Light)Combo of many useful indicators modified to suit dark theme, contains
1)Regular and Hidden Divergence Buy and Sell signals by scarf
2)Time and Money channels by Lazybear
3)Fibonacci Bollinger Bands by Rashad
4) Linear Regression Curve by ucsgears
Thanks for all the creators for the source codes!

Trading System(Dark)Combo of many useful indicators modified to suit dark theme, contains
1)Regular and Hidden Divergence Buy and Sell signals by scarf
2)Time and Money channels by Lazybear
3)Fibonacci Bollinger Bands by Rashad
4)Linear Regression Curve by ucsgears
Thanks for all the creators for the source codes!

Trading System(Dark)Combo of many useful indicators, contains
1)Regular and Hidden Divergence Buy and Sell signals by scarf
2)Time and Money channels by Lazybear
3)Fibonacci Bollinger Bands by Rashad
4)Linear Regression Curve by ucsgears
Thanks for all the creators for the source codes!
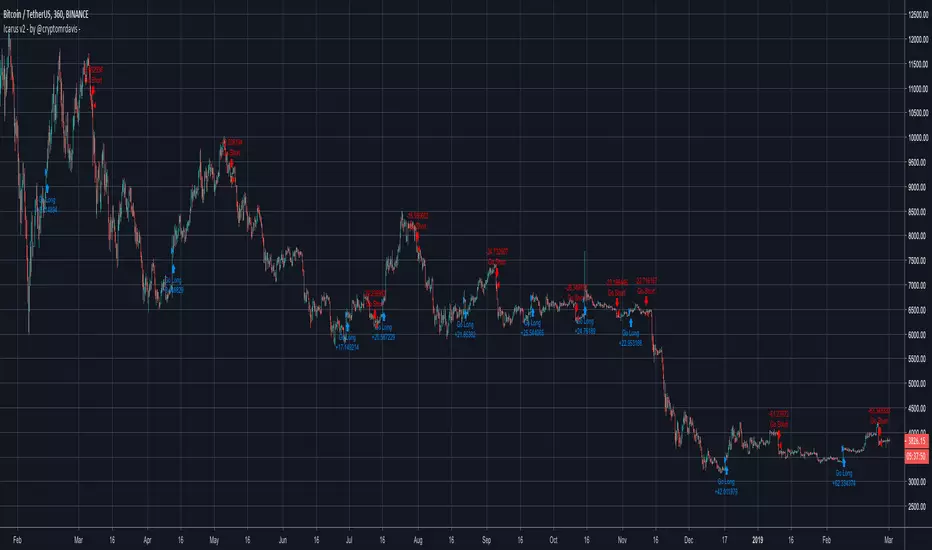
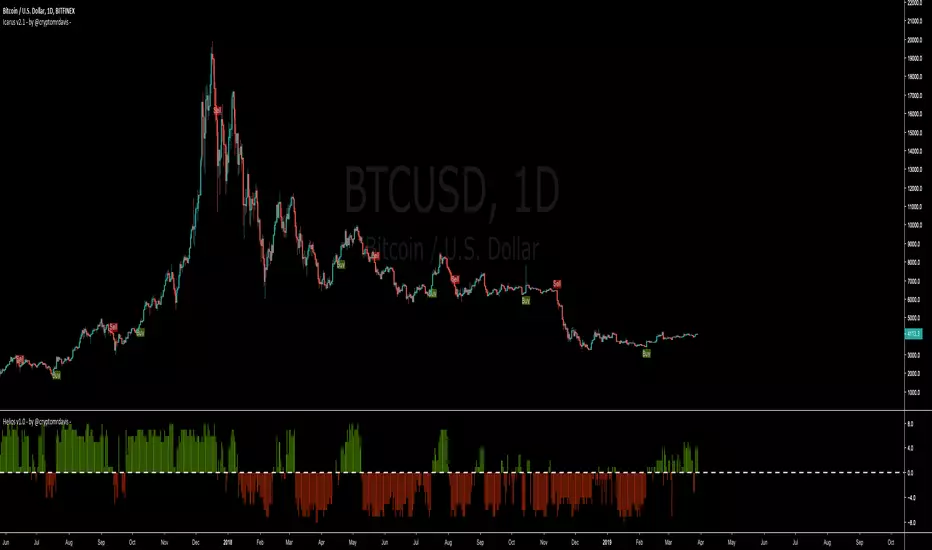
Icarus v2 - by @cryptomrdavis -This is the second version of this indicator. Now you have the ability to find the perfect settings for your asset. Just play around with those settings and if you find good ones, don't hesitate to share it with us.
Buy / Sell Signals will be plotted only once until the signal for open/close appears.
Reduce the noise with the ADX settings but there is still more room for better signals.
Catches most of the biggest moves quick but in the sideways they are still to much noise. Need to improve that. If you have some ideas just get at me.
Hope this tool is useful for you guys
Happy trading
+++ use this tool on your own risk. i'm not responsible for your loses. DYOR +++
____________________________________________________________________________
BTC: 1GVRDK3HHr9CKM5SF2CGpCNXFuavB3L4j9
ETH: 0x7b825fa752b9926D3E8397cDb1d9E5473D074646
XLM: GAXUQJSW55C7MAC4GI26NZUGIKSHFDVFRFKZCXPLMPY4HCADSDT55XK6
BCH: qz57n04ud6mn42u00aymqkku8tfh0lk4jv9c28mjvv
tippin.me
____________________________________________________________________________
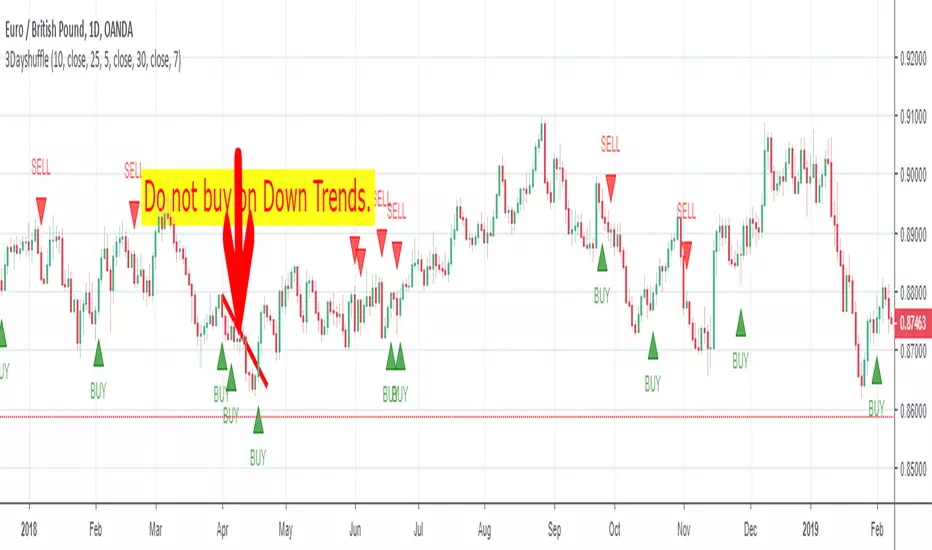
3DayshuffleThe 3 Day Shuffle Indicator indicates the best time to buy and sell based on a secret sauce. This is an Indicator not a strategy. Quick tip, keep the profits small(30-40pips) or Trail Stop it and keep the SL around 30-50 pips. Any comments Appreciated!
Any Tips are appreciated!
Bitcoin: 3M8cMjWXCbMBRbgMPS95wZGDZXXecL5q9v
Litecoin: MWd2E3T2BwZrPbS3DdYx2vvuapwoPQmvFo