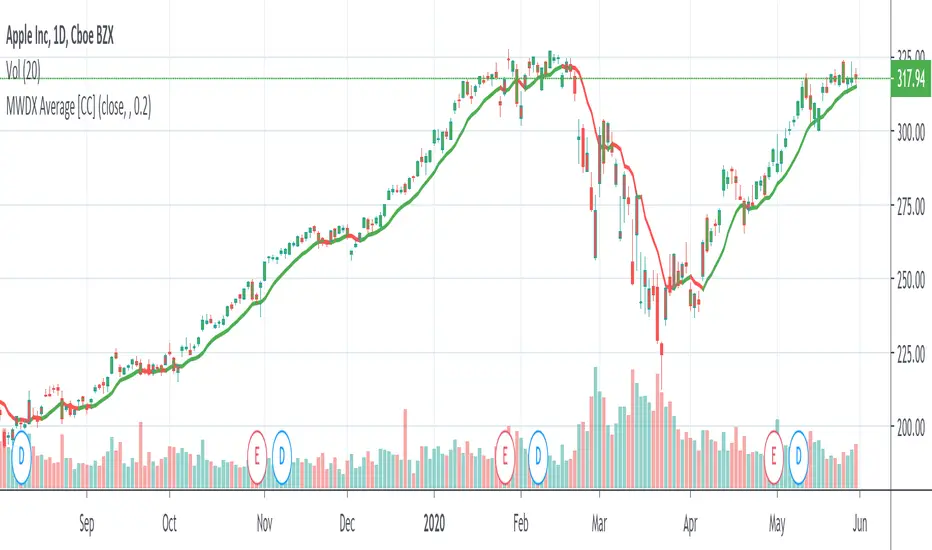
MWDX AverageThis is a variation of an exponential moving average which follows the price pretty smoothly. Feel free to change the factor to adjust how closely it follows the price. I set the default to 0.2
Let me know if you want me to write code for any other indicators!
Signal
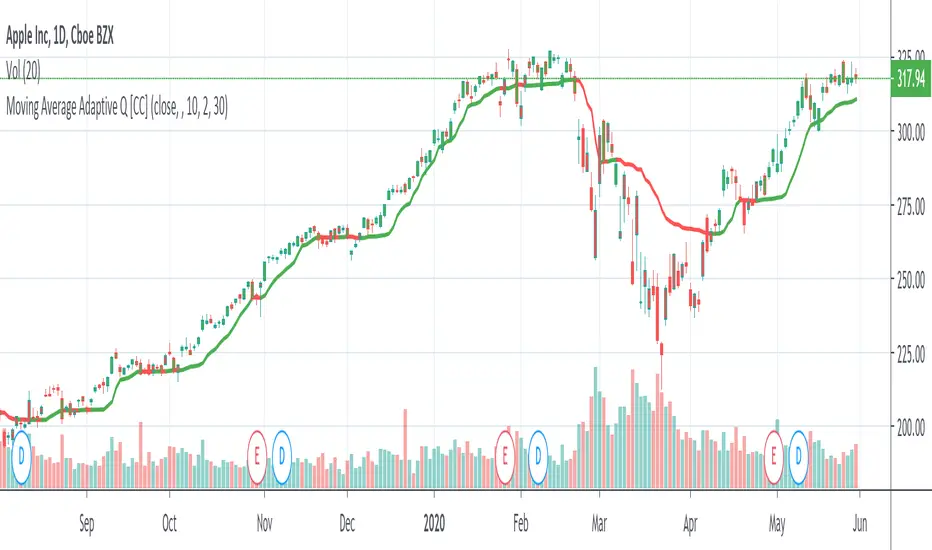
Moving Average Adaptive QThe Moving Average Adaptive Q (MAAQ) was authored by Perry Kaufman in the Stocks and Commodities Magazine 06/1995
This is similar to his Kaufman Adaptive Moving Average with a few changes. This is a pretty close moving average which I like quite a bit. Try it and let me know what you think.
Send me a message and let me know what other indicators you would like to see!
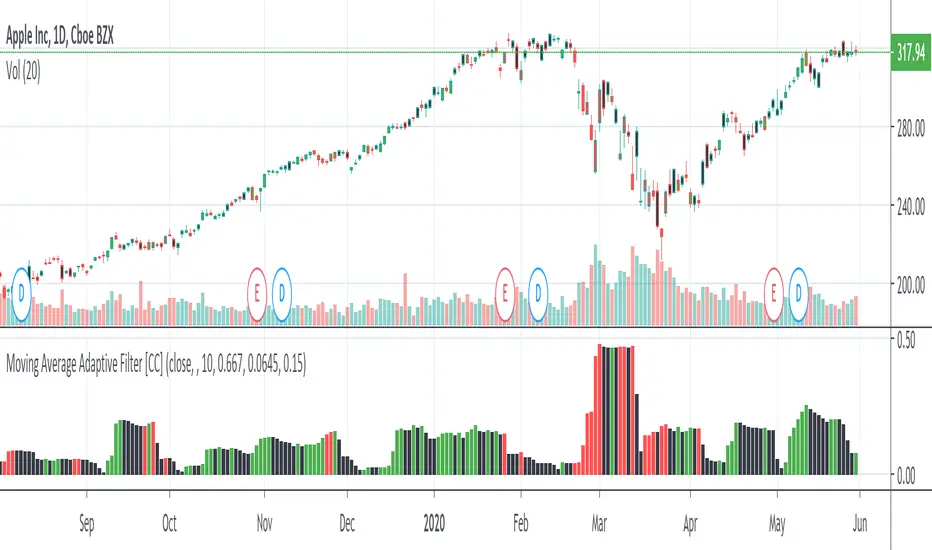
Moving Average Adaptive FilterThe Moving Avg Adaptive Filter (MAAF) was authored by Perry Kaufman in the Stocks and Commodities Magazine 03/1998
This is a volatility based indicator so when this indicator goes up, sell in the direction of how that stock is going. In other words go short when it is rising and the stock price is below the ema or go long when it is rising and the stock price is above the ema. Lower volatility means it is trading sideways or the current price action is about to reverse.
Send me a message and let me know what other indicators you would like to see!
Ichimoku Clouds Strong Bullish/Bearish signals and alertsIchimoku Clouds Strong Bullish/Bearish signals with allerts
The Ichimoku cloud was developed by Goichi Hosoda, a Japanese journalist, and published in the late 1960s. It provides more data points than the standard candlestick chart. While it seems complicated at first glance, those familiar with how to read the charts often find it easy to understand with well-defined trading signals.
We provide you easy-to-use script which helps to decrypt meaning of lines in the indicator. The script takes Ichimoku clouds indicator formulas to calculate Tenkan, Kijun, SenkouA, SenkouB values and examines them in order to produce buy ( Bullish ) and sell ( Bearish ) signals which are displayed at the chart
The most appropriate time frame is 30m
Custom alerts are added to send you a notice with a webhook when bullish or bearish signal arrives.
You can easily add weak and neutral signals alerts by removing "//" in a specified place
Feel free to copy and use this script for your ideas and trading. You can modify the script by adding Parabolic SAR in order to increase accuracy of positions closure

Simple Reversal PointThis indicator finds possible points of reversion, you can use it to stack positions and get a good average price for when the price changes direction, it is the trader responsibility to manage the position and make a profit.
-Added alerts
Quadratic SemaphoreThe quadratic semaphore indicator is an indicator that find confirmed market u-turn with the help of 2 quadratic regression calculated with Highs and Lows over the last “length” periods.
- “p” setting is candlesticks quantity to confirmed the quadratic regression has formed a High or Low parabola, such as Fractals. Consecutive same signals can happen due to the use of different price values for upper and lower semaphore.
- Adjust the settings to your instrument and time frame.
- Alerts included.
Success with your trade¡¡
Mirror TSI-MACD by Trader JayI was playing around with the TSI-MACD and surprisingly it works quite well as a mirror.
There are 2 ways this can be used
1. Enter long when Blue line crosses up the Red
2. Exit long when Green line crosses the blue
or
1. Enter long when Blue line crosses up the Red
2. Exit long when Blue line crosses back down below the Red

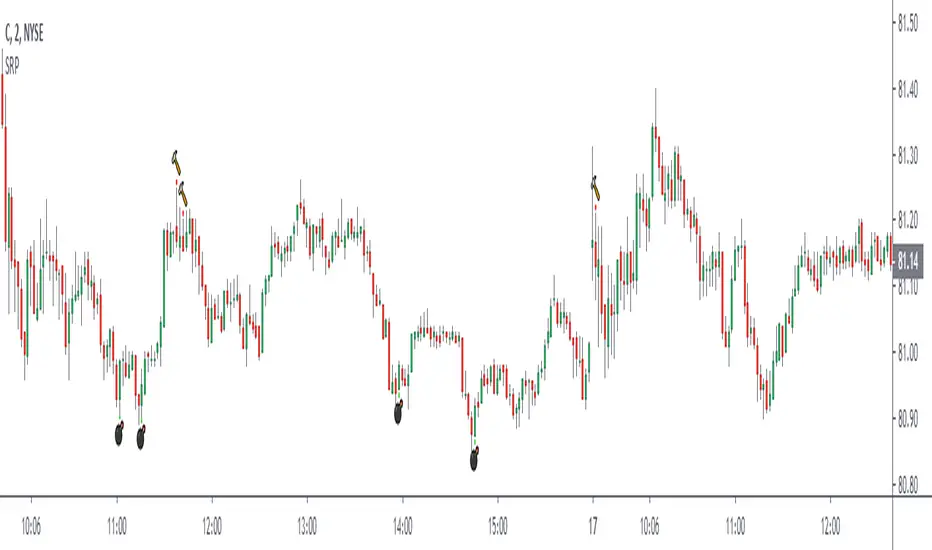
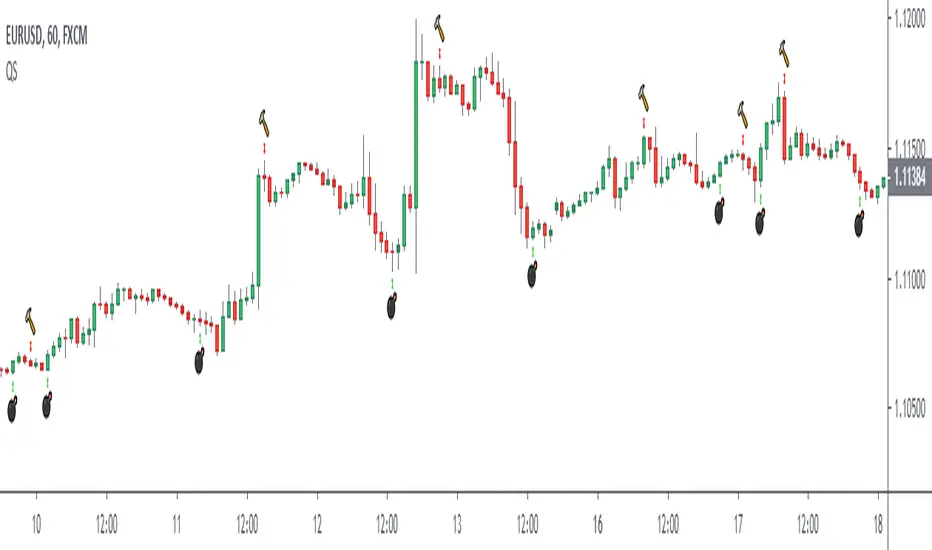
Red and Green Ignored Bar by Oliver VelezOn this occasion I present a script that detects Ignored Red Candles and Ignored Green Candles, basically it is a Price Action event that indicates a possible continuation of the current trend and gives the opportunity to climb it with a Very tight risk, before delving into detail I would like to leave this note:
Note: the detection of this event does not guarantee that the signal will be good, the trader must have the ability to determine its quality based on aspects such as trend, maturity, support / resistance levels, expansion / contraction of the market, risk / benefit, etc, if you do not have knowledge about this you should not use this indicator since using it without a robust trading plan and experience could cause you to partially or totally lose your money, if this is your case you should train before If you try to extract money from the market, this script was created to be another tool in your trading plan in order to configure the rules at your discretion, execute them consistently and have AUTOMATIC ALERTS when the event occurs, which is where I find more value because you can have many instruments waiting for the event to be generated, in the time frame you want and without having to observe the mer When the alert is generated, the Trader should evaluate the quality of the alert and define whether or not to execute it (higher timeframes, they can give you more time to execute the operation correctly).
Let's continue….
This event was created by Oliver Velez recognized trader / mentor of price action, the event has a very interesting particularity since it allows to take a position with a very limited risk in trend movements, this achieves favorable operations of good ratio and small losses when taking An adjusted risk, if the trade works, a good ratio is quickly achieved and we agree with a key point in the “Keep small losses and big profits” trading, this makes it easier to have a positive mathematical hope when your level of Success is not very high, so leave you in the field of profitability.
THE EVENT:
The event has a bullish configuration (Ignored Red Candle) and a bearish configuration (Ignored Green Candle), below I detail the “Hard” rules (later I explain why “Hard”):
1- Last 3 bars have to be GREEN-RED-GREEN (possible bullish configuration) or RED-GREEN-RED (possible bearish configuration), the first bar is called Control Bar, the second is called Ignored Bar and the third Signal Bar as shown in the following image:
2- Be in a trend determined by simple moving averages (Slow of 20 periods and Fast of 8 periods), as a general rule you can take the direction of MA20 but the Trader has to determine if there is a trend movement or not.
3- Control bar of good range, little tail and with a body greater than 55%.
4- Ignored bar preferably narrow range, little tail and that is located in the upper 1/3 of the control bar.
5- Signal bar cannot override the minimum of the ignored bar.
6- Activation / Confirmation of event by means of signal bar in overcoming the body of the ignored bar.
Some examples of ignored bars (with “Hard” and “Flexible” rules):
Features and configuration of the indicator:
To access the indicator settings, press the wheel next to the indicator name VVI_VRI "Configuration options".
- Operation mode (Filtering Type):
• Filtering Complete: all filters activated according to the configuration below.
• Without Filtering: all filters deactivated, all VRI / VVI are displayed without any selection criteria.
• Trend Filter only: shows only VRI / VVI that are in accordance with what is set in “Trend Settings”
- Configuration Moving Averages:
• See Slow Media: slow moving average display with direction detection and color change.
• See Fast Media: display of fast moving average with direction detection and color change.
• Type: possibility to choose the type of media: DEMA, EMA, HullMA, SMA, SSMA, SSMA, TEMA, TMA, VWMA, WMA, ZEMA)
• Period: number of previous bars.
• Source: possibility to choose the type of source, open, close, high, low, hl2 hlc3, ohlc4.
• Reaction: this configuration affects the color change before a change of direction, 1 being an immediate reaction and higher values, a more delayed reaction obtaining les false "changes of direction", a value of 3 filters the direction quite well.
- Trend Configuration
• Uptrend Condition P / VRI: possibility to select any of these conditions:
o Bullish MA direction
o Quick bullish MA direction
o Slow and fast bullish MA direction
o Price higher than slow MA
o Price higher than fast MA
o Price higher than slow and fast MA
o Price higher than slow MA and bullish direction
o Price higher than fast MA and bullish direction
o Price higher than slow, fast MA and bullish direction
o No condition
• Condition P / VVI bear trend: possibility of selecting any of these conditions:
o Slow bearish MA direction
o Fast bearish MA direction
o Slow and fast bearish MA direction
o Price less than slow MA
o Price less than fast MA
o Price less than slow and fast MA
o Price lower than slow MA and bearish direction
o Price less than fast MA and bearish direction
o Price less than slow, fast MA and bearish direction
o No condition
- Control bar configuration
• Minimum body percentage%: possibility to select what body percentage the bar must have.
• Paint control bar: when selected, paint the control bar.
• See control bar label: when selected, a label with the legend BC is plotted.
- Configuration bar ignored
• Above X% of the control bar: possibility to select above what percentage of the control bar the ignored bar must be located.
• Paint ignored bar: when selected, paint the ignored bar.
- Signal bar configuration
• You cannot override the minimum of the ignored bar: when selected, the condition is added that the signal bar cannot override the minimum of the ignored bar.
• Paint signal bar: when selected, paint the signal bar.
• See arrow: when selected it shows the direction arrow of the possible movement.
• See bear and arrow: when selected it shows bear and arrow label
• See bull and arrow: when selected it shows bull and arrow label
The following image shows the ignored bar and painted signal:
- Take profit / loss
The profit / loss taking varies depending on the trader and its risk / monetary plan, the proposal is a recommendation based on the nature of the event that is to have a small risk unit (stop below the minimum of the ignored bar), look for objectives in ratios greater than 2: 1 and eliminate the risk in 1: 1 by taking the stop to BE, all parameters are configurable and are the following:
• See recommended stop loss and take profit: trace the levels of Stop, BE, TP1 and TP2, as well as their prices to know them quickly based on the assumed risk
• To: select which event you want to draw the SL and TP (VRI, VVI)
• Extend stop loss line x bars: allows extending the stop line by x number of bars
• Extend take profit line x bars: allows extending the stop line by x number of bars
• Ratio to move to break even: allows you to select the minimum ratio to move stop to break even (default 1: 1)
• Take profit 1 ratio: allows you to select the ratio for take profit 1 (default 2: 1)
• Take profit 2 ratio: allows you to select the ratio for take profit 2 (default 4: 1)
- Alerts
• It is possible to configure the following alerts:
-VRI DETECTED
-VVI DETECTED
-VRI / VVI DETECTED
Final Notes:
- The term hard rules refers to the fact that an event is sought with the rules detailed above to obtain a high quality event but this brings 2 situations to consider, less
number of events and events that are generated in a strong impulse may be leaked, a very large control bar followed by an ignored narrow body away from moving averages, despite having a good chance of continuing, taking a stop very tight in a strong impulse you can touch it by the simple fact of the own volatility at that time.
- The setting of the parameters “Minimum body percentage% (control bar)”, “Above x% of the control bar (bar ignored)” and “Cannot override the minimum of the ignored bar” can bring large Benefits in terms of number of events and that can also be of high quality, feel free to find the best configuration for your instrument to operate.
- It is recommended to look for trending events, near moving averages and at an early stage of it.
- The display of several nearby VRIs or VVIs in an advanced trend may indicate a depletion of it.
- The alerts can be worked in 2 ways: at the closing of the candle (confirms event but the risk unit may be larger or smaller) or immediately the body of the ignored bar is exceeded, in case you are operating from the mobile and miss many events because of the short time I recommend that you operate in a superior time frame to have more time.
- The indicator is configured with “flexible” rules to have more events, but without any important criteria, each trader has to look for the best configuration that suits his instrument.
- It is recommended to partially close the operation based on the ratio and always keep a part of the position to apply manual trailing stop and try to maximize profits.
The code is open feel free to use and modify it, a mention in credits is appreciated.
If you liked this SCRIPT THUMB UP!
Greetings to all, I wish you much green!

Keltner Channel with signals [ChuckBanger]This is Keltner Channel where I added Bull and Bear signals. It has a lot of settings to play around with. Have fun...
For more information on Keltner Channel: www.investopedia.com

Market Thrust IndicatorThe Market Thrust indicator is a powerful measure of the stock market's internal strength or weakness. There are four components to this indicator:
1-Advancing Issues on the New York Stock Exchange (NYSE) – $ADV
2-Advancing Volume on the NYSE – $UVOL
3-Declining Issues on the NYSE – $DECL
4-Declining Volume on the NYSE – $DVOL
The formula for Market Thrust is given below:
($ADV x $UVOL)-($DECL x $DVOL)
When used for day-trading, the trend of the Market Thrust indicator is what is most important.
Rising Market Thrust Indicator: Considered a bullish sign; can act as a confirmation signal when combined with a rising stock, index ETF, or stock index future's price.
Falling Market Thrust Indicator: Considered a bearish sign; can act as a confirmation signal of a decreasing market price.
The Market Thrust indicator could be used for detecting divergences in trends. Divergences occur when:
- Price is trending higher, but the Market Thrust indicator is not moving higher or is even going down.
- Price is trending lower, however, the Market Thrust technical analysis tool is not trending lower, it is either not trending or is trending higher.
Add a fully configurable trend line over MTI.
Read more at: commodity.com

Leledc Exhaustion Bar V4 PLUSLeledc Exhaustion Bar indicator created by glaz converted to Pine 4, plotshape was added.


RSI with an Opinion (UO)This RSI has a very clear idea about when to buy and sell. It plots buy and sell signals. It is an expert system. Yes, of course, it can make some errors. You should have used stop-loss

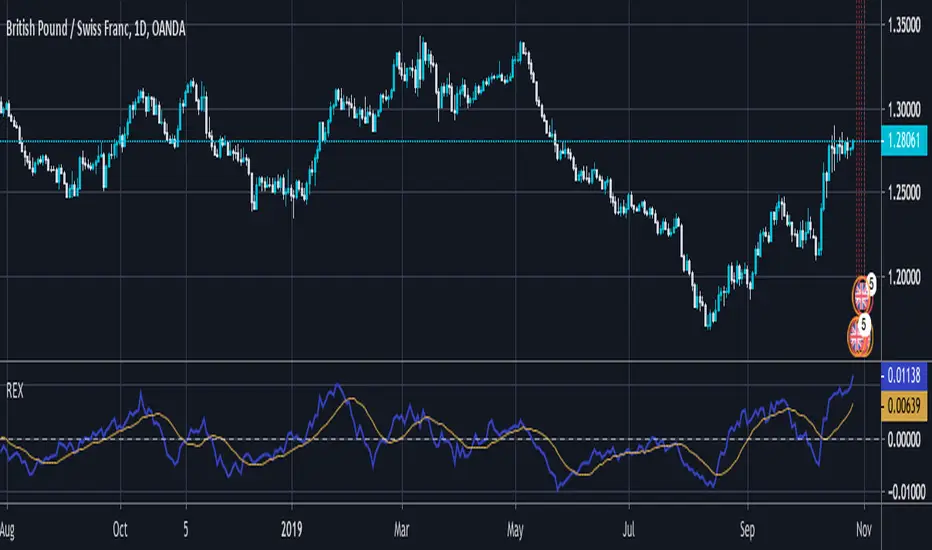
REX by vitelot// Best used as an exit indicator at default settings.
// Also doing well in entering positions by using TEMA(14) for REX and SMA(14) as signal.
// You need to tune it yourself according to your trading style.
// Use at your own risk.
//
// Vitelot/Yanez/Vts Oct 2019
//
Signal To Noise Ratio IndicatorThis is a trend indicator at its core so combine with rsi or a moving average of your choice to see which direction the stock is trending in.
Only enter a position (long or short) when signal to noise ratio is above the signal line
This is one of my first indicators posted on here so be sure to leave me feedback

Smart Labelling - Range FilterThis is a labelling module based on a range filter . Notice that the trick here is to use fibonachi numbers . Use smaller range multiplier for higher TFs. This module may serve as a signal generator to be passed through a signal filter.
Quote from the original author:
This is an experimental study designed to filter out minor price action for a clearer view of trends. Inspired by the QQE's volatility filter, this filter applies the process directly to price rather than to a smoothed RSI. First, a smooth average price range is calculated for the basis of the filter and multiplied by a specified amount. Next, the filter is calculated by gating price movements that do not exceed the specified range. Lastly the target ranges are plotted to display the prices that will trigger filter movement.

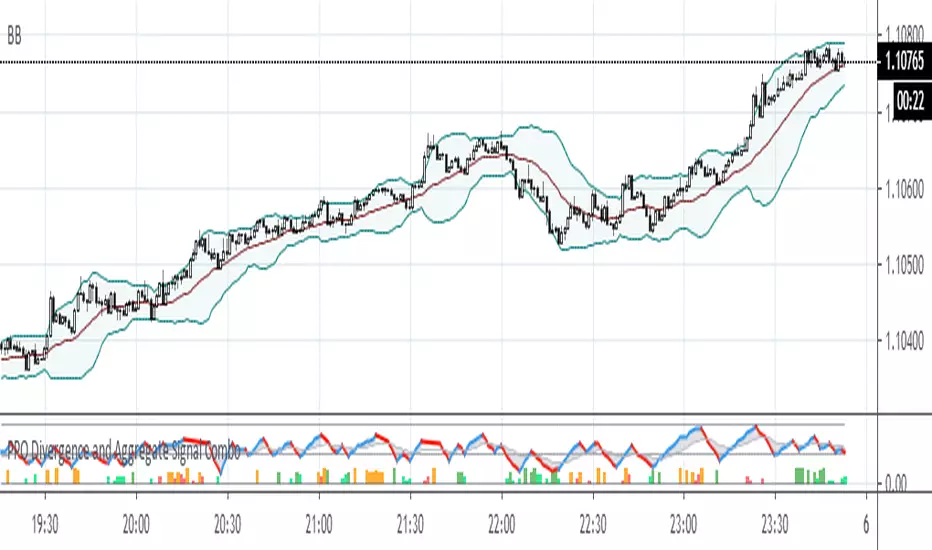
PPO Divergence and Aggregate Signal ComboThis is a further development of the last two posts on aggregated signal generation. It shows how to implement the idea in conjunction with another indicator. In this case general rule for long and short entry: the aggregated curve (gray) must cross the mid-line. Colored columns serve as an early warning. Settings were tested with EURUSD in 5m, 30m and 1H TFs.
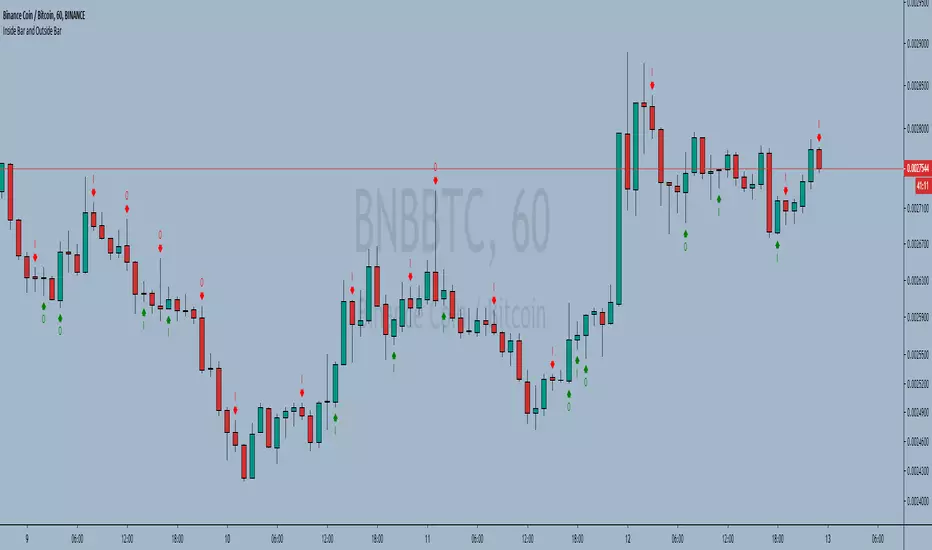
Inside Bar and Outside Bar Simple indicator, to show outside bars and inside bars
inside sellbar = "I" in red color
inside buybar = "I" in green color
Outside sellbar = "O" in red color
Outside buybar = "O" in green color
----------//---------------
PT-BR
Indicador simples, para mostrar outside bars e inside bars
inside sellbar = "I" na cor vermelha
inside buybar = "I" na cor verde
Outside sellbar = "O" na cor vermelha
Outside buybar = "O" na cor verde
Setup 9.1 by Larry Williams Setup 9.1 by Larry Williams.
The indicator will give text signal and change the color of the signal candle, being based exclusively on the setup 9.1
----------//---------------
PT-BR
Setup 9.1 do Larry Williams.
O indicador irá dar sinal de texto e alterar a cor do candle de sinal, se baseando exclusivamente no setup 9.1

Multi-TF Avg BBandsMULTI-TF AVERAGE BBANDS - with signals (BETA)
Overall, it shows where the price has support and resistance, when it's breaking through, and when its relatively low/high based on the magic of standard deviation.
created by gamazama. send me a shout if u find this useful, or if you create something cool with it.
%BB: The price's position in the boilinger band is converted to a range from 0-1. The midpoint is at 0.5
Description of parameters
"BB:Window Length" is the standard BB size of 20 candles.
The indicator plots up to 7 different %BB's on different timescales
They are calculated independently of the timescale you are viewing eg 12h, 3d, 30m will be the same output
You can enter 7 timescales, eg. if you want to plot a range of bbands of the 12h up to 3d graphs, enter values between 0.5 and 3 (days) - you can also select 0 to disable and use less timescales, or select hours or minutes
Take note if you eg. double the main multiplier to 40, it is the same as doubling all your timescales
You can turn the transparency of the 7 x %BB's to 100 to hide them, their average is plotted as a thick cyan line
"Variance" is a measure of how much the 7 BB's agree, and changes colour based on the thresholds used for the strategy
---- TO START FROM SCRATCH ----
- set all except one to ZERO (0), set to 0, and everything after to 0.
Turn ON and right click -> move the indicator to a new pane - this will show you the internal workings of the indicator.
Then there is a few standard settings
"Source Smoothing Amount" applies a basic small sma on the price.
It should be turned down when viewing candles with less information, like 1D or more.
Standard BBands use an SMA, there one uses a blend between VWMA or SMA
Volume Weight settings, the same as SMA at 0, and the same as VWMA at 1
BB^2 is a bband drawn around the average %BB. Adjust the to change its window length
The BB^2 changes color when price moves up or down
Now its time to look at the parameters which affect the buy/sell signals
turn on "show signal range" - you see some red lines
buy and sell each have 4 settings
min/max variance will affect the brigtness of the signal range
range adjust will move the range up/down
mix BB^2 blends between a straight line (0) and BB^2's top or bottom (1)
a threshold of "variance" and "h/l points" is available to generate weaker signals.
these thresholds can be increased to show more weak signals
ONCE YOU ARE HAPPY WITH THE SIGNALS being generated, you can turn OFF , and move it back to the price pane
the indicator then draws a bband around the price to maps some info into the chart:
fills a colour between 0.5 & the mid BB^2 and converts relative to the price chart
draws a line in the middle of the midband.
controls how much these lines diverge from the price - adjust it to reduce noise
converts the signal range (red lines) to be relative to the price chart
if you like, you can adjust the sell & buy signals in the tab from and to and to match the picture. It messes with auto-scaling when moving back to though
enjoy, I hope that is easy enough to understand, still trying to make this more user-friendly.
If you want to send me some token of appreciation - btc: 33c2oiCW8Fnsy41Y8z2jAPzY8trnqr5cFu
I promise it will put a fat smile on my face

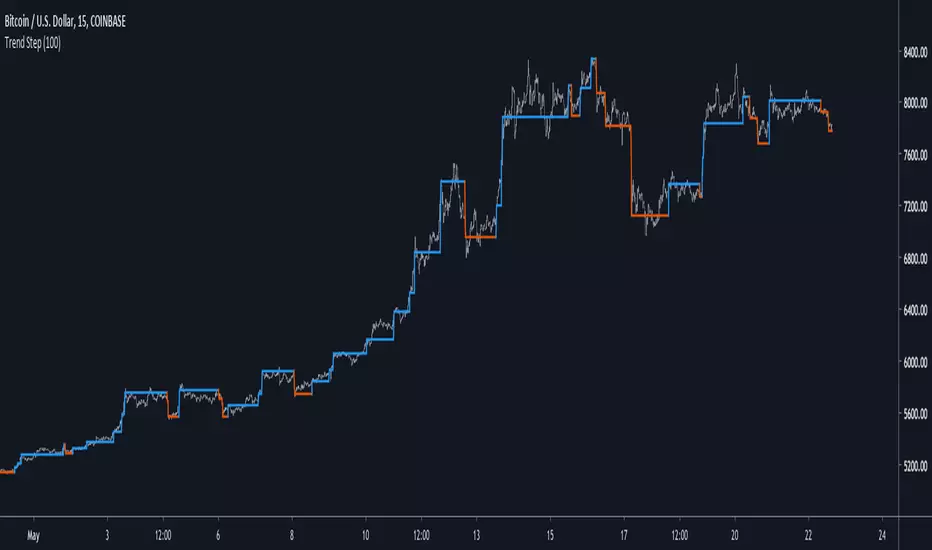
Trend StepJust a modification of my old auto-line script, lot of errors fixed and a correction in the standard deviation. Also changed the tittle because "auto-line" was really confusing.
ATR based Pivots mcbwHey everyone this is an exciting new script I have prepared for you.
I was reading an old forex bulletin article some time ago when I came across this: solar.murty.net (or you can download the full bulletin with lots of other good articles here: www.forexfactory.com).
You can already buy this for metatrader (www.mql5.com) so I figured to make it for free for tradingview.
This bulletin suggested that you can reasonably predict daily volatility by adding or subtracting multiples of the daily ATR to the daily opening. Using this you can choose multiples to use as price targets and alternatively as stop losses. For example, if you already have a sense of market direction you can buy at market open place a stop loss at - 1 daily ATR and a profit target at + 3 ATRs for a risk to reward ratio of 3. If you are looking for smaller/quicker moves with a ratio of 3 you can have a stop loss at -0.25 ATR and a take profit at +0.75 ATR.
Alternatively this article also suggests to use this method to catch volatility breakouts. If price is higher than the + 1 ATR area then you can safely assume it will be going to the +2 ATR area so you can put a buy stop at + 1 ATR with a profit target at + 2 ATR with a stop loss at +0.5 ATR to catch a volatility breakout with a risk to reward ratio of 2!
Even further there are methods that you can use with ATRs of multiple window sizes, for example by opening two copies of this indicator and measuring recent volatility with a 1 week window and long term volatility within a 1 month window. If the short term volatility is crossing the long term volatility then there is a high probability chance that even more price movement will occur.
However I have found that this method is good for more than daily volatility , it can also be used to measure weekly volatility , and monthly volatility and use these multiples as good long term price targets.
To select if you want daily, weekly, or monthly values of the ATR of volatility you're using go to the settings and click on the options in the "Opening period". The default window of the ATR here is 14 periods, but you can change this if you want to in "ATR period". Most importantly you are able to select which multiples of the ATR you would like to use in the settings in "ATR multiple 1" which is the green line, "ATR multiple 2" which is the blue line, and "ATR multiple 3" which is the purple line. You can select any values you want to put in these, the choice of 0.25, 0.5, and 1 is not special, some people use fibonacci numbers here or simply 0.33, 0.66, and 0.99.
Repainting issue: This script uses the daily value of the Average True Range (ATR), which measures the volatility that is happening today. If price becomes more volatile then the value of the ATR can increase throughout the day, but it can never decrease. What this means is that the ATR based pivots are able to expand away from the opening price, which should not affect the trades that you take based on these areas. If you base your take profit on one of these ATR multiples and the daily volatility increase this means that your take profit area will be closer to your entry than the ATR multiple. Meaning that your trades will be more conservative.
While this all may sound very technical it is super intuitive, throw this on your chart and play around with it :)
Happy trading!

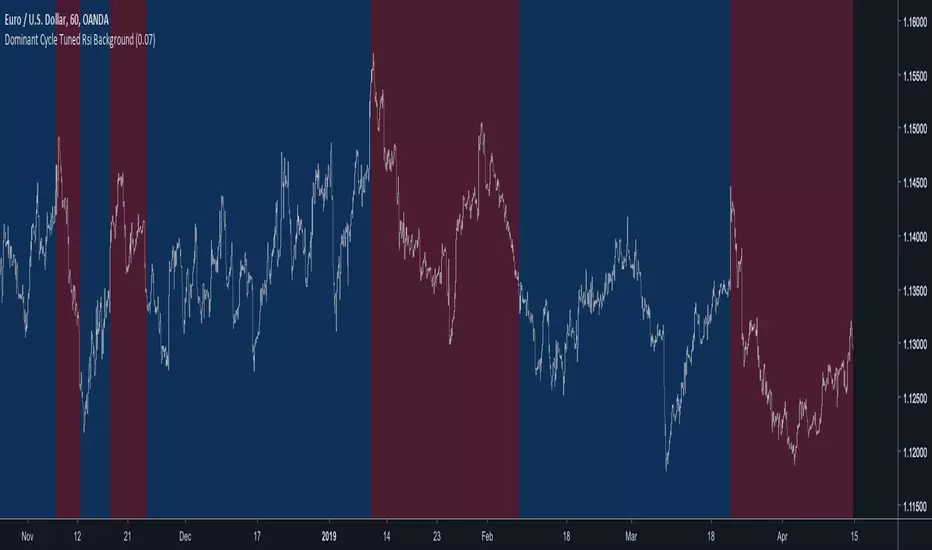
Dominant Cycle Tuned Rsi BackgroundBackground version of the Dominant Cycle Tuned Rsi Background published here