Trendlines with Breaks [LuxAlgo]The trendlines with breaks indicator return pivot point based trendlines with highlighted breakouts. Users can control the steepness of the trendlines as well as their slope calculation method.
Trendline breakouts occur in real-time and are not subject to backpainting. Trendlines can however be subject to repainting unless turned off from the user settings.
The indicator includes integrated alerts for trendline breakouts.
🔶 USAGE
Any valid trendlines methodology can be used with the indicator, users can identify breakouts in order to infer future price movements.
The calculation method of the slope greatly affects the trendline's behaviors. By default, an average true range is used, returning a more constant slope amongst trendlines. Other methods might return trendlines with significantly different slopes.
Stdev makes use of the standard deviation for the slope calculation, while Linreg makes use of the slope of a linear regression.
The above chart shows the indicator using "Stdev" as a slope calculation method. The chart below makes use of the "Linreg" method.
By default trendlines are subject to backpainting, and as such are offset by length bars in the past. Disabling backpainting will not offset the trendlines.
🔶 SETTINGS
Length: Pivot points period
Slope: Slope steepness, values greater than 1 return a steeper slope. Using a slope of 0 would be equivalent to obtaining levels.
Slope Calculation Method: Determines how the slope is calculated.
Backpaint: Determine whether trendlines are backpainted, that is offset to past.
Signals

SignalsThis script allows you to calculate position size, and future profit, loses.
- You can add 3 target values and 1 stop loss
- Optionally you can display table, position it as you like, and see risk ratio
Plans:
- add profit loss to the labels


Diluted Earnings Per Share Signal [AstrideUnicorn]Earnings Per Share (EPS) is a financial metric closely monitored by investors. The so-called "positive earnings surprise" - a situation when EPS reading for a stock beats the value forecasted by analysts gives a bullish signal for this stock. The EPS reading lower than the analysts' estimate gives a bearish signal.
The Diluted Earnings Per Share (Diluted EPS) metric calculates a company's potential earnings per share value in the case if all convertible securities get converted to common shares. Convertible securities include preferred shares, stock options, warrants, convertible debt, etc. Diluted EPS is a more scientific way to estimate earnings per share, and it is usually lower than the ordinary EPS.
The Diluted EPS Signal indicator (DEPSS) is a fundamental indicator that calculates trading signals by comparing the Diluted EPS to the EPS Estimate. In many cases, Diluted EPS gives better insight into how a reported EPS reading may impact the stock price.
HOW TO USE
For each earnings date, the indicator calculates the Diluted Earnings Surprise percentage value :
Diluted Earnings Surprise = (Diluted EPS - EPS Estimate)/ EPS Estimate.
Diluted Earnings Surprise higher than the specified threshold value is a bullish signal. In this case, the indicator displays a green triangle pointing up.
Diluted Earnings Surprise lower than the specified threshold value is a bearish signal displayed as a red triangle pointing down.
As one can see on the chart, there are a lot of situations where EPS readings with green labels (the ones that beat analysts' estimates) lead to down moves. The DEPSS indicator can spot weak earnings and give opposite signals.
SETTINGS
Earnings Surprise Threshold (%) : the threshold value (in percentage units) for the Diluted Earnings Surprise. The calculated Diluted Earnings Surprise must be higher than Earnings Surprise Threshold to be considered a BUY signal or lower than minus Earnings Surprise Threshold to be considered a SELL signal. The default value for Earnings Surprise Threshold is 20%.

Favorite Signals w/EMA FilterThe script combines my favorite signals then filters them with three EMAs.
Via the Style tab, you can choose to either have the signals color the bar and/or plot a shape above/below.
All signals can be turned off via the Inputs tab, which will remove the bar color and/or shape (if not already off in the Style tab) as well as remove the pattern from the alerts function.
Remember when using TV alerts, if you change the script settngs, you must create a new alert if you wish to be alerted for the changes you've made.
LONG/SHORT SIGNALS INCLUDED FOR:
- TD8s
- TD9s
- Hammer
- Shooting Star
- Bullish Harami
- Bearish Harami
- RSI Divergences
EMA FILTER LOGIC LONGS:
- Price < Fast EMA & Med EMA > Slow EMA = Possible Long Entry
- Price > Fast EMA & Med EMA > Slow EMA = Possible Reversal, Tighten Stop or Reduce Position
EMA FILTER LOGIC SHORTS:
- Price > Fast EMA & Med EMA < Slow EMA = Possible Short Entry
- Price < Fast EMA & Med EMA < Slow EMA = Possible Reversal, Tighten Stop/Reduce Position
Big up to @spdoinkal, @HPotter, @LonesomeTheBlue, for writing the originals scripts for the signals above.
Enjoy!
Sentiment Estimator [AstrideUnicorn]Sentiment Estimator is an indicator that estimates market sentiment using only its pricing data. It counts bullish and bearish candles in a rolling window and calculates their relative values as percentages of the total amount of candles in the window. Market sentiment shows the direction in which the market is biased to move or the current trend direction. Extreme values of the market sentiment are contrarian signals. When the market sentiment is too bullish, it is time to sell and vice versa.
HOW TO USE
Sentiment Estimator plots a pair of green and red circles for each candle. They represent bullish and bearish sentiments, respectively.
The vertical positions of the circles show corresponding sentiment values in percentage units. For example, if a green circle's height is 60, the market is 60% bullish. In this case, the red circle's height will be 40, as bullish and bearish parts of the market sentiment sum to 100%.
The blue line plotted at the 50% level shows the neutral sentiment level. If a green circle is above the blue line, the prevailing market sentiment at that time is bullish, and the market is biased to move up. If a red one is above, the market has predominantly bearish sentiment and is prone to move down.
The red level shows extreme sentiment level. If a green or red circle is above this line, it means that the market is extremely bullish or bearish, respectively. It is a contrarian signal, and one can expect a reversal soon. In this case, a blue label with the text "reversal expected" is shown.
SETTINGS
Timeframe - allows choosing a timeframe other than the chart's one for the indicator calculation.
Look-Back Window - sets the historical window length used to perform the calculations. You can adjust the window to get the best results for a particular market or timeframe.

BB+RSI+EMA BUY/SELL SignalsBINANCE:BTCUSDT
* * * TESTED ON BTCUSDT 4H CHART * * *
The indicator gives signals based on candles touching BB lines and RSI oversold/overbought conditions, also a 200 EMA filter is used to trade following the major trend.
Only LONG signals are given.
Signals are divided in 3 categories based on their strenght:
- Weak BUY/SELL (green/red circles on chart)
- normal BUY/SELL (green/red triangles with "BUY" or "SELL" text on chart)
- strong BUY/SELL (green/red labels with "STRONG BUY" or "STRONG SELL" text on chart)
You can use signals from the same category as triggers for entering or exiting a trade or you can try using signals from different categories
All indicators settings can be costumized
Every signal label can be turned ON/OFF
EMA that changes color based on last candle close can be turned ON/OFF
Alerts can be set for:
- General Signals (every signal will trigger it)
- Weak Signals (only weak signals will trigger it)
- Normal Signals (only normal signals will trigger it)
- Strong Signals (only strong signals will trigger it)

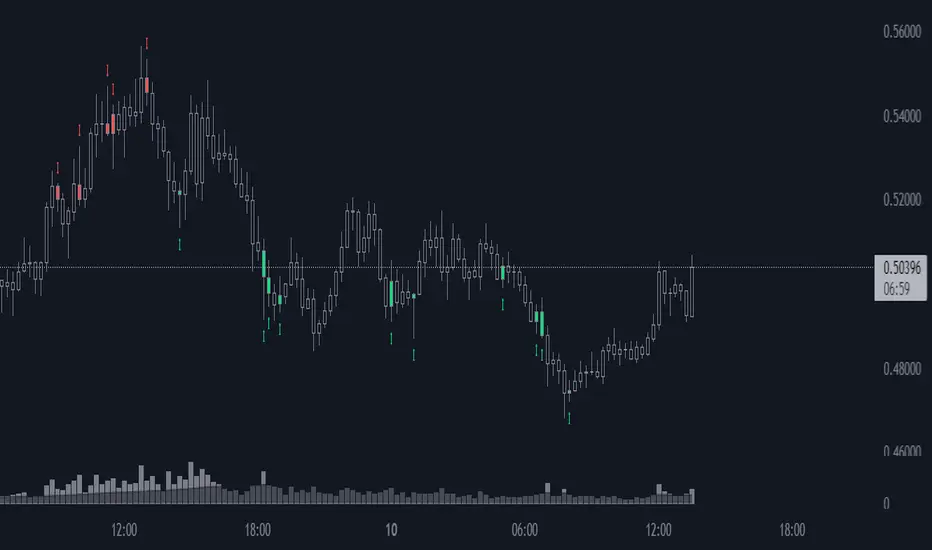
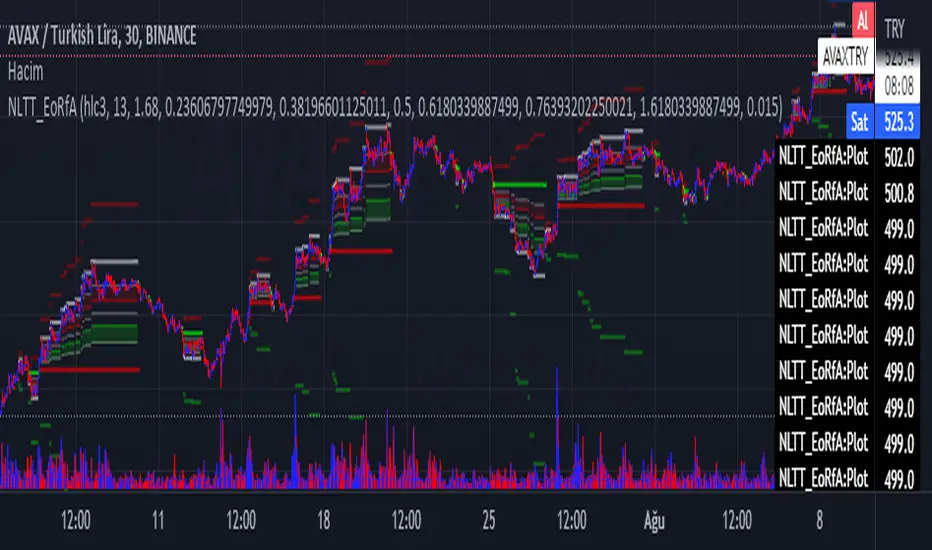
No-lose trading targets (Based on EoRfA) By Mustafa ÖZVERThis code shows expected reaction target prices after sudden moving based on (EoRfA) Escaping of Rate from Avarage. Red area means the price is on overbought area, green area means the price is on oversold area. If you see red area under price, you can make short option to next to the horizontal beginning price of red area. If you see green area over price, you can make long option to next to the horizontal beginning price of green area.
When this code works
- The green area starts where EoRfA value is on oversold
- The red area starts where EoRfA value is on overbought
Of course, this code may be failed, do not forget the target may never come. But hopefully price will cross over the target.
And you (as developers) can develop this code by using anything instead of EoRfA to get up-down target prices.
But only this values can not guarantee good results for trading. BE CAREFUL
Zendog LONG DCA Trigger RSI+StochRSIThis is a script that generates a BUY signal by combining RSI and Stochastic RSI into the same script and that can easily be integrated into an external Backtester like the one I published.
The script uses default values for RSI and Stochastic RSI oversold conditions.
They should be adjusted for specific assets and timeframes so they better match the current trend. Please beware you might overfit settings to match a short timeframe trend (like a few days or hours). If this is the case once the trend changes the signals will not be accurate.
The purpose of this script is to provide some pine code that can be used to further combine multiple indicators into a LONG Deal Start signal.
Integration with the Zendog Backtster:
- add the backtester on the chart
- add this script on the chart
- in the Zendog backtester Deal start type select "External indicator"
- in the Zendog backtester Indicator source and value select "Zendog LONG DCA Trigger RSI+StochRSI: SIGNAL"

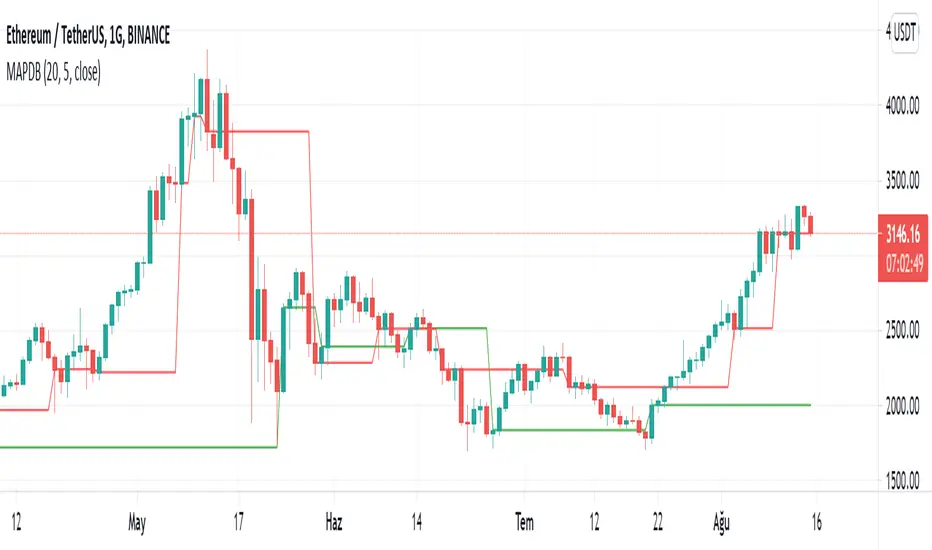
Moving Avarage Percentage difference bands It creates a buy and sell signal according to the up and down percentage differences of fast and slow moving averages. Green band breaks are buy and red band breaks are sell signals difference there is a threshold value for optimization, high values generate more signals, but the risk of these signals increases..
hızlı ve yavaş hareketli ortalamaların yüzdesel farklarının aşağıya ve yukarıya kırılımlarına göre alım ve satım sinyali oluşturur yeşil bant kırılımları al kırmızı bant kırılımları sat sinyalidir optimizasyon için eşik değeri eklenmiştir yüksek değerler daha fazla sinyal almanıza sebep olur ama riskli sinyal sayısı artar düşük değerler daha az sinyal almanızı sağlar ama riskli sinyal sayısıda azalır.
Stochastic Weighted RSI w/ Divergence + Signals🐢 Tawtis' Stochastic Weighted Relative Strength Index , aka SWRSI
This indicator combines the Stochastic RSI and the classic RSI we all know and love to create a more effective indication of seller/buyer dominance, and in turn, trend. I have named it the "Stochastic Weighted RSI". The script also includes a standard RSI, so you can use both at the same time!
Loads of customisation, pretty much every input can be changed to fit your preferences, however, the default settings are what I would personally recommend for the best results. Either way, feel free to change them!
By looking at the indicator, you can also establish the trend that may follow in the candles to come.
Typically, an indicator reading of over 70 is considered overbought, and an indicator reading of under 30 is considered oversold.
The calculations for the SWRSI and its signals take into account a multitude of exponential moving averages, a Stochastic RSI and a classic RSI, among other things.
There are 2 types of signals provided by the indicator, being strong and weak. You do not have to follow these, and they aren't always accurate (it's impossible to be accurate 100% of the time), however, they can give a good idea of the trend that will ensue.
Strong buy signals are created when:
SWRSI is under 30
SWRSI is over the EMA (default 2) of the SWRSI
Short EMA (default 20) is under the long EMA (default 50)
Strong sell signals are created when:
SWRSI is over 70
SWRSI is under the EMA (default 2) of the SWRSI
Short EMA (default 20) is over the long EMA (default 50)
Weak buy and sell signals are printed as green and red background highlights, and operate the same as the strong buy and sells, without the short/long EMA criterion. Both of these signal types can be toggled off using the settings if you do not want to see them.
Enjoy!

Inverse Fisher Transform on RSI for backtest w/alertsThis version of the Inverse Fisher Transform on RSI comes with support for
1) Backtesting with Gavin's backtest script
2) Bypass, you can use another indicator to pause buy signals from this indicator. Just create another indicator that plots "1" whenever you want to activate the bypass on the IFTRSI signal.
3) Independent buy and sell level thresholds. Some tokens perform better with a higher sell level, even levels as high as 0.996, sometimes the buy level can also be relaxed to even 0.6 and get incredible results on the 5 minute chart.
4) alerts for Buy and Sell signals
Make sure you add Gavin's backtest and select external signal and this indicator as the source.

Ichimoku all signalsIchimoku Cloud All Signals!
This indicator shows all Ichimoku Cloud signals for (entering/exiting/confirming/or even staying) in a position.
you can choose a signal related to your strategy and use it.
you can choose which signals to be shown on the chart by changing the settings.
here are some examples of signals that you can get from this indicator:
Crossover/under conversion line & base line
Crossover/under lead line1 & lead line2
Crossover/under conversion line & lead line1
Crossover/under base line & lead line1
Crossover/under conversion line & lead line2
Crossover/under base line & lead line2
Crossover/under close & base line
Cloud Breakouts in both directions!
and 74 signals more !!!!

Smart EMA SignalsThis indicator starts by plotting each time the price action crosses above or below the EMA, of which you can tune the timeframe and duration.
It then takes it a step further and plots whether or not that indicator would have given you a profitable trade, of which you can also tune the parameters (Max wait time, and % Profit).
Once you have your EMA tuned to your liking, set up alerts to notify you of a golden opportunity.

3GBH - Simple HMA'sIncluded in this indicator:
- 3x HMA w/ cloud
(Slow/Fast HMA)
(Signal HMA)
-----
User-friendly.
You can change all the inputs, they are labelled for ease-of-use.
You can toggle On/Off any or all of the options.

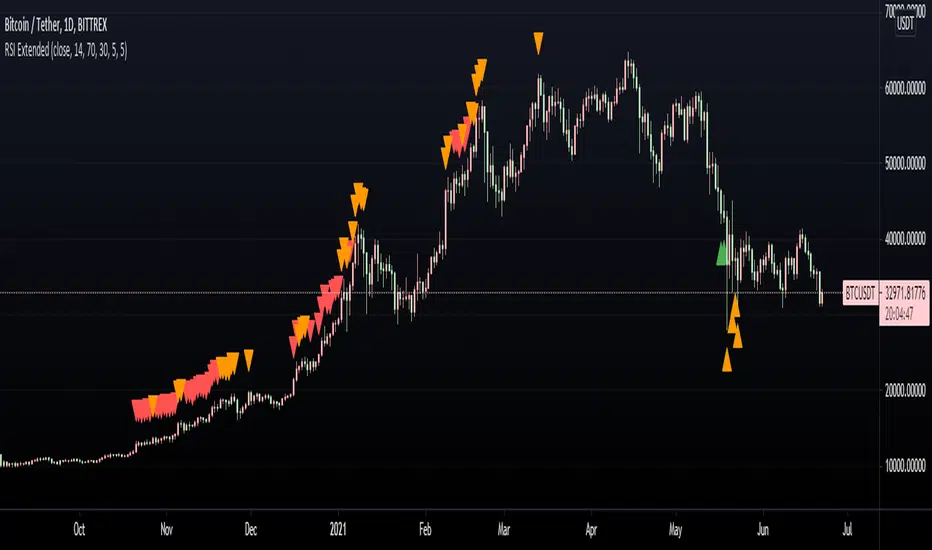
RSI ExtendedThis script is intended to print signals on the main price chart and send alerts when the RSI is overbought or oversold.
You can customize the source of the signal (open, close, etc), as well as oversold/overbought levels, and RSI length.
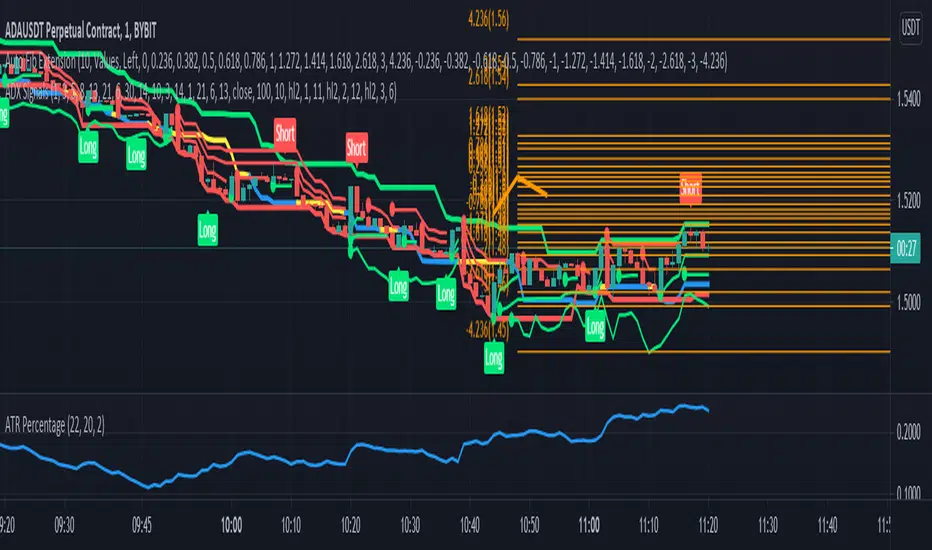
ADX SignalsThis script uses the Average Direction Index, On Balance Volume, and Exponential Moving Average, Moving Average Cross, MACD, Donchian Channels and two Parabolic SARs for stop loss, a normal one and a line one.
I tried to make the script as straightforward as possible, Buy when there is a buy signal and sell when there is a sell signal. I like using it on the smaller time-frames because I'm a scalper and I like going in and out quickly, but this indicator can be used on any timeframe and works on any instrument. The buy signal is triggered when the DI+ goes above the 30 level, the ADX is not increasing, on balance volume is at it's lowest, the price is above the lower Donchian Channel and last MACD hist bar is lower than the previous one. The sell signal is triggered when the DI- goes above the 30 level, the ADX is not increasing, on balance volume is at it's highest, the price is below the upper Donchian Channel and last MACD hist bar is upper than the previous one.
If you have any suggestions feel free to leave them in the comments below or Message me directly.
MACD Signal with RSI Indicating StrategyThis strategy looks for MACD signal crossover and RSI confirmation of oversold/overbought condition.
Tune to your crypto/stock for best results using the strategy and sent an alert. Currently set up to use 25% of equity at each buy signal and will sell 1/3 of position at each sell signal. Initial investment is $1000, but adjust as necessary.
Currently tuned to DOGEUSD on 30min chart.
If you like/use/profit, follow me or shoot me a donation. If you are looking for a script design, I can help.

[GJ]IFRSITHE INVERSE FISHER TRANSFORM STOCH RSI
HOW IT WORKS
This indicator uses the inverse fisher transform on the stoch RSI for clear buying and selling signals. The stoch rsi is used to limit it in the range of 0 and 100. We subtract 50 from this to get it into the range of -50 to +50 and multiply by .1 to get it in the range of -5 to +5. We then use the 9 period weighted MA to remove some "random" trade signals before we finally use the inverse fisher transform to get the output between -1 and +1
HOW TO USE
Buy when the indicator crosses over –0.5 or crosses over +0.5 if it has not previously crossed over –0.5.
Sell when the indicator crosses under +0.5 or crosses under –0.5 if it has not previously crossed under +0.5.
We can see multiple examples of good buy and sell signals from this indicator on the attached chart for QCOM. Let me know if you have any suggestions or thoughts!

SuperTrend Oscillator [LuxAlgo]This oscillator is made of three components, all derived from the SuperTrend indicator. This approach allows the user to easily determine overbought/sold zones, identify whether a retracement is present or if the price is ranging or trending. It also allows for the anticipation of the potential price cross with the SuperTrend.
We provide additional information including whether a signal returned by the SuperTrend was false, as well as the percentage of false signals.
Settings
Length: Period of the "average true range" used in the calculation of the SuperTrend
Mult: Multiplicative factor for the "average true range"
Smooth: Determines the degree of smoothing of the histogram
Misc:
Fixed Transparency: Use a fixed transparency for the main oscillator
Show Lines: Show the lines displayed by the indicator
Show Labels: Show the labels displayed by the indicator
Usage
The indicator is in a range of (-100,100) with values closer to 100/-100 indicating a stronger trend. The main oscillator value above 0 indicates that the price is above the SuperTrend.
It is possible to identify when a retracement is present in a trend. This is often indicated by an oscillator value moving within 50/-50.
Each overbought/oversold level can be used to determine potential exit points.
The indicator also includes two additional oscillators derived from the main oscillator. A smoothed version of the main oscillator (Signal), and a smoothed version of the difference between the Main and Signal oscillators (Histogram), thus making the oscillator part of the indicator more similar to MACD.
One can use the histogram to anticipate when the price might cross the SuperTrend by comparing the sign between the main and histogram. Potential false signals can also be filtered with this method.
Certain crosses between the price and SuperTrend can be filtered out when the histogram and main oscillator have a different sign (here main = 1, histogram = -1).
We include various indications in order to analyze the signals returned by the SuperTrend. The indicator displays symbols indicating whether a signal was false or not.
A cross symbol will be displayed at the top of the displayed lines when the previous Buy signal was false, else a checkmark is displayed. Symbols displayed at the bottom of the lines are referring to sell signals. We also provide a percentage of false signals, calculated over the entire chart history.
Details
The scaling method used is similar to max-min normalization. We first compute the difference between the price and SuperTrend and divide the result by the difference between the upper and lower extremity used to compute the SuperTrend. Values higher than (1,-1) can occur when price crosses the SuperTrend and as such we use the max and min functions to attenuate these.
The filter used to compute the signal line is based on exponential averaging and is fully adaptive. The smoothing factor used for its computation is the squared value of the main oscillator, divided by length . Since higher values of the oscillator are associated with trending markets, the filter will be closer to the main oscillator when the market is ranging.

Angle Attack Follow Line Indicator This indicator works with Follow Line Indicator , evaluates the angle for possible additions or reductions of the position. Many settings to play with:
s3.tradingview.com
- FOLLOW LINE CURRENT CHART RESOLUTION
- FOLLOW LINE HIGHER TIME FRAME
- FILTER HIGHER TIME FRAME
- NO FILTER HIGHER TIME FRAME
- ANGLE CONFIGURATION
- ANGLE LEVELS
- BUY / SELL
- OPTIONS TO ADD
- OPTIONS TO REDUCE
- BAR COLOR
- LABELS
-ALERTS
MANAGE YOUR RISK AND CAPITAL WELL IF YOU DO NOT WANT TO LOSE EVERYTHING¡¡¡
TO PLAY¡¡¡

Simple way to BEAT the market [STRATEGY]This script has been created to demonstrate the effectiveness of using market regime filters in your trading strategy, and how they can improve your returns and lower your drawdowns
This strategy adds a simple filter (A historical volatility percentile filter, an implementation of which can be found on my trading profile) to a traditional buy and hold strategy of the index SPY.
Note, There are other filters that could also be added including a long-term moving average/percentile rank filter/ADX filter etc, to improve the returns further.
The filter closes our long position during periods of volatility that exceed the 95th percentile (or in the top 5% of volatile days) and buys back when the volatility is below 95% rank of the past 100 days
Have included the backtest results since 1993 which is 28 years of data at the time of writing. Comparison of traditional buy and hold with this modified strategy can be found below:
Traditional buy and hold:
Return per year: 7.95 % (ex Dividends)
Total return: 851.1 %
Max drawdown: 50.79 %
'Modified' buy and hold (this script):
Return per year: 9.92 % (ex Dividends)
Total return: 1412.2 %
Max drawdown: 31.57 %
Feel free to use some of the market filters in my trading profile to improve and refine your strategies further, or make a copy and play around with the code yourself. This is just a simple example for demo purposes.

Roc & Atr
Roc & Atr Orders
My indicator, where I compare the 20 bar change percentage with the 14 bar atr band, I hope it will be useful to everyone. the green zones can be interpreted as BUY and the red zone as SELL zone. In graphs with high motion and low atr, the channel narrowing can be interpreted as BUY and the channel opening as SELL.
No indicator shows you the right way ... The best way is your own thoughts
