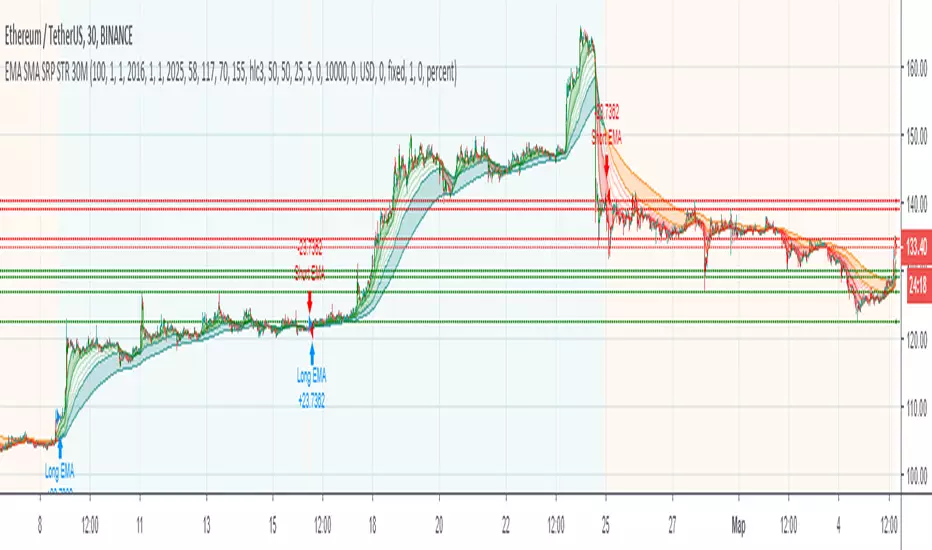
EMA SMA SRP STRATEGY 30MThe strategy is based on indicators:
Exponential Moving Average (EMA)
Simple Moving Average (SMA)
Support and Resistance Levels
Allows to find entry/exit points
Signalservice

Pump/Dump Hunter 15M+ Strategy// The strategy is based on the pumps and dumps, as well as a sudden change in market volumes

STOCH MACD SAR RSI V2 INDICATOR 15M// Indicator based on Oscillators such as Stochastic ( STOCH ), Moving Average Convergence/Divergence ( MACD ),
// Parabolic Stop and Reverse (PSAR) and Relative Strength Index ( RSI )
// Adapted for 15M time frame on Binance chart
// Working with comission
// No repaints
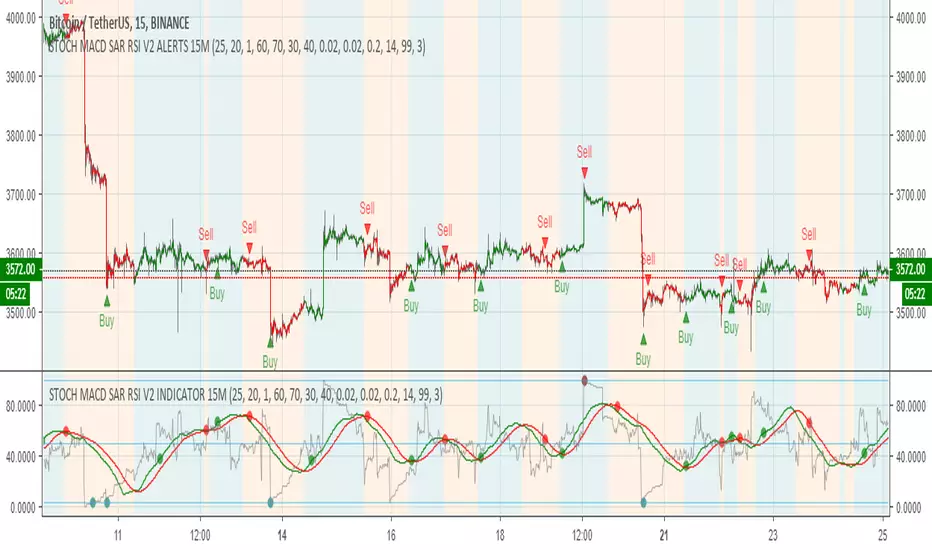
STOCH MACD SAR RSI V2 ALERTS 15M// Alerts based on Stochastic Oscillator ( STOCH ), Moving Average Convergence / Divergence ( MACD) , Parabolic Stop and Reverse (PSAR) and Relative Strength Index (RSI)
// In the second version RSI added
// Adapted for15M time frame
// Created and based on Binance chart
// Working with comission
// No repaints

STOCH MACD SAR RSI V2 STRAT 15M// Strategy based on Stochastic Oscillator ( STOCH ), Moving Average Convergence / Divergence ( MACD ), Parabolic Stop and Reverse (PSAR) and Relative Strength Index (RSI)
// In the second version RSI added
// Adapted for15M time frame
// Created and based on Binance chart
// Working with comission
// No repaints

STOCH MACD SAR Alerts 15M// Alerts based on Stochastic Oscillator (STOCH), Moving Average Convergence / Divergence (MACD) and Parabolic Stop and Reverse (PSAR) Strategy
// Adapted for15M time frame
// Created and based on Binance chart
// Working with comission
// No repaints
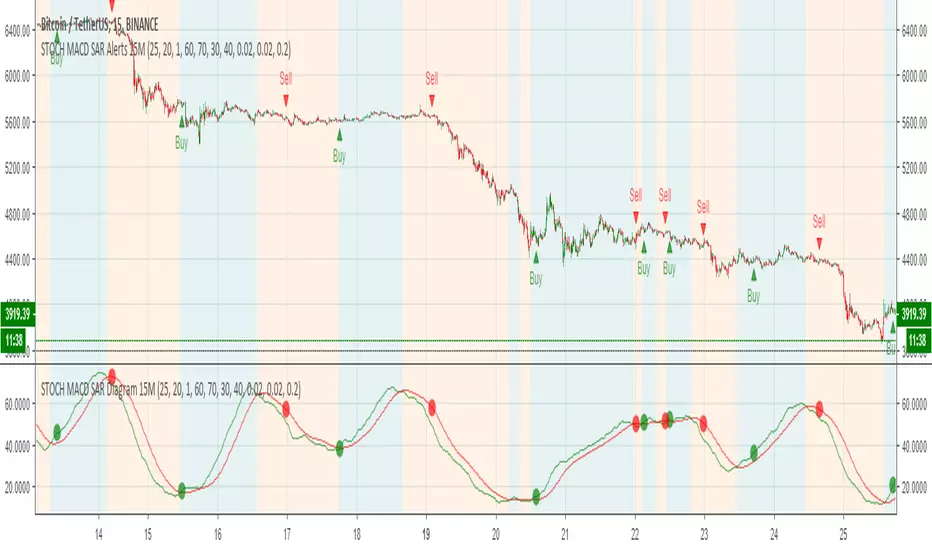
STOCH MACD SAR Strategy 15M// Strategy based on Stochastic Oscillator (STOCH), Moving Average Convergence / Divergence (MACD) and Parabolic Stop and Reverse (PSAR)
// Adapted for15M time frame
// Created and based on Binance chart
// Working with comission
// No repaints

RSI EMA Alerts 15M+// Alerts based on Relative Strength Index ( RSI ) and Exponential Moving Average ( EMA ) Strategy
// Greatest effect on 15M+ time frame
// Created and based on Binance chart
// Working with comission
// No repaints

RSI EMA Strategy 15M+// Strategy based on Relative Strength Index (RSI) and Exponential Moving Average (EMA)
// Greatest effect on 15M+ time frame
// Created and based on Binance chart
// Working with comission
// No repaints

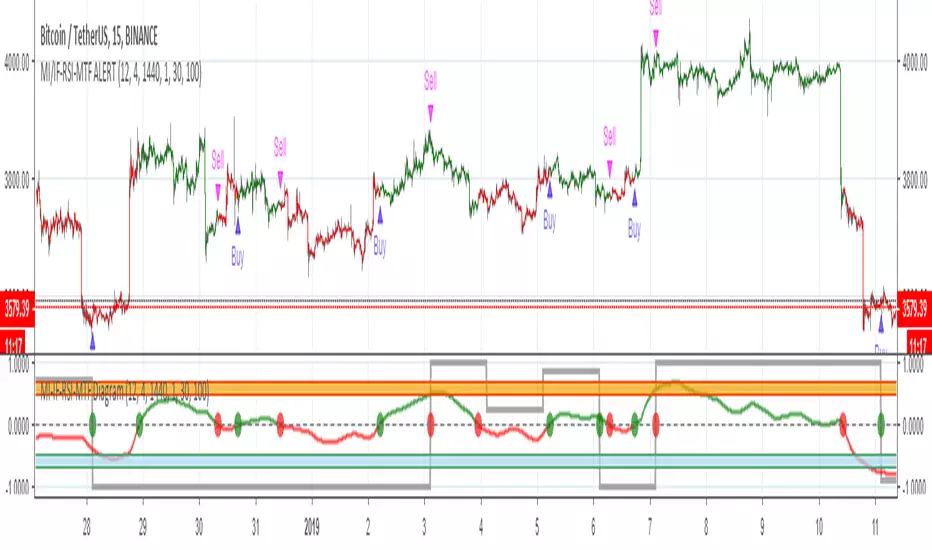
MOMENTUM INDICATOR / INVERS FISHER / RSI / MTF / ALERT// Alerts based on Momentum indicator and Inverse Fisher transform with Multi Time Frame function on Relative Strength Index (RSI)
// Greatest effect on 15M+ time frame
// Created and based on Binance chart
// Working with comission
// No repaints
MOMENTUM INDICATOR / INVERS FISHER / RSI / MTF / STRAT// Strategy based on Momentum indicator and Inverse Fisher transform with Multi Time Frame function on Relative Strength Index (RSI)
// Greatest effect on 15M+ time frame
// Created and based on Binance chart
// Working with comission
// No repaints

Momentum Indicator Alerts 15m// Alerts based on Momentum Indicator Strategy
// Greatest effect on 15M time frame
// Created and based on Binance chart
// Working with comission
// No repaints

Momentum Indicator Strategy 15m// Strategy based on Momentum Indicator
// Greatest effect on 15M time frame
// Created and based on Binance chart
// Working with comission
// No repaints

Trend MA 2H Alerts// Alerts based on the spread between the Slow and Fast Moving Average.
// Greatest effect on 2H time frame
// Created and based on Binance chart
// Working with comission
// No repaints
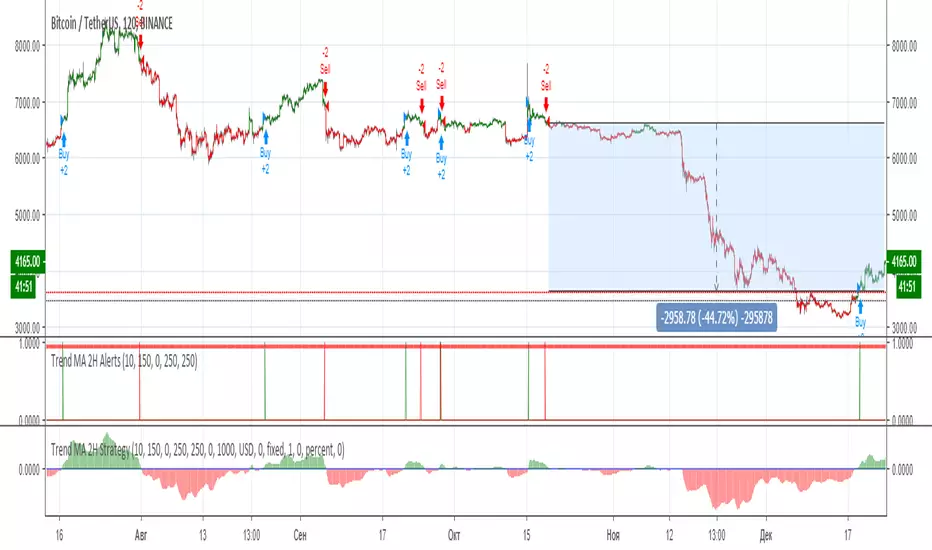
Trend MA 2H Strategy// Strategy based on the spread between the Slow and Fast Moving Average.
// Greatest effect on 2H time frame
// Created and based on Binance chart
// Working with comission
// No repaints

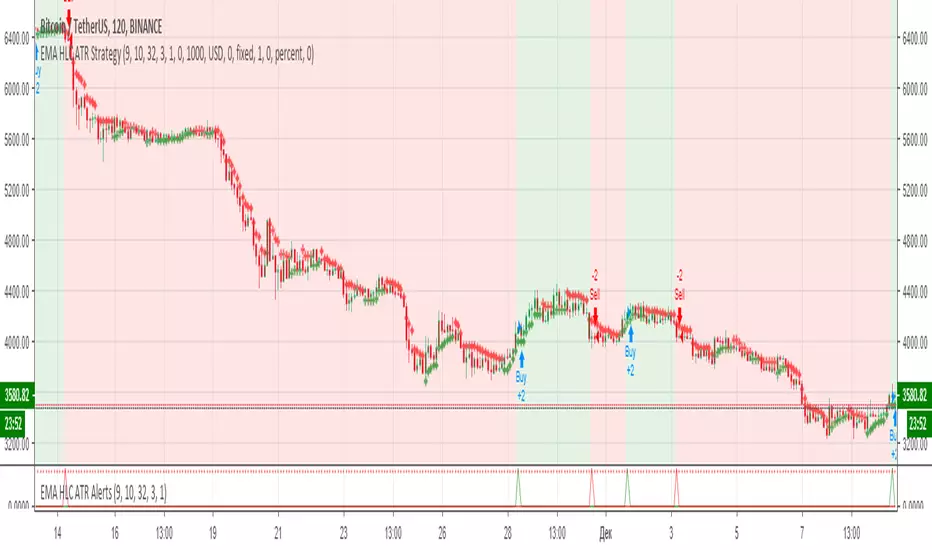
EMA HLC ATR Strategy// Strategy based on EMA HLC ATR Indicators
// Greatest effect on 2H time frame
// Created and based on Binance chart
// Working with comission
// No repaints
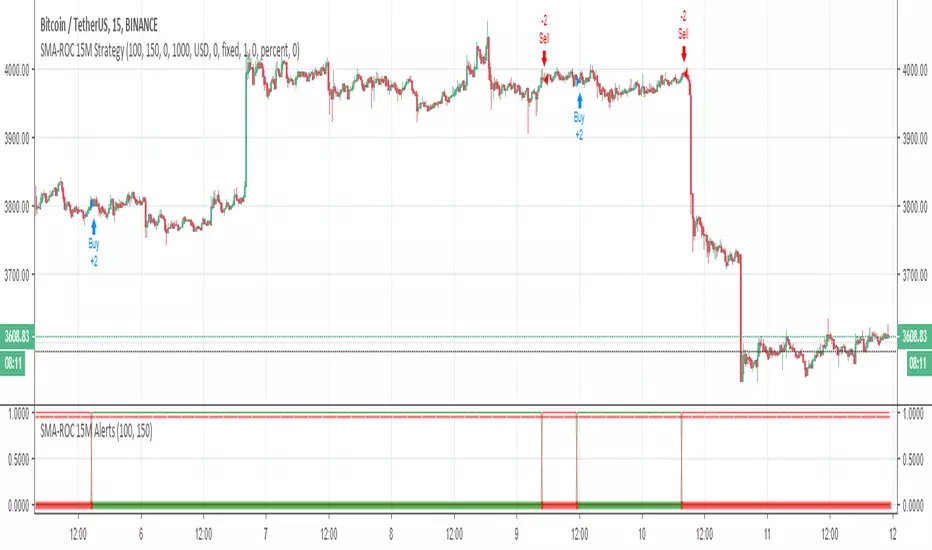
SMA-ROC 15M Alerts// Alerts based on Simple Moving Average (SMA) and Rate of Change (ROC) Strategy
// Greatest effect on 15M time frame
// Created and based on Binance chart
// Working with comission
// No repaints
2 EMA CROSSOVERS 2H ALERTS// Alerts based on 2 moving average Strategy
// Greatest effect on 2H time frame
// Created and based on Binance chart
// Working with comission
// No repaints

2 EMA CROSSOVERS 2H STRATEGY// Strategy based on 2 moving average
// Greatest effect on 2H time frame
// Created and based on Binance chart
// Working with comission
// No repaints


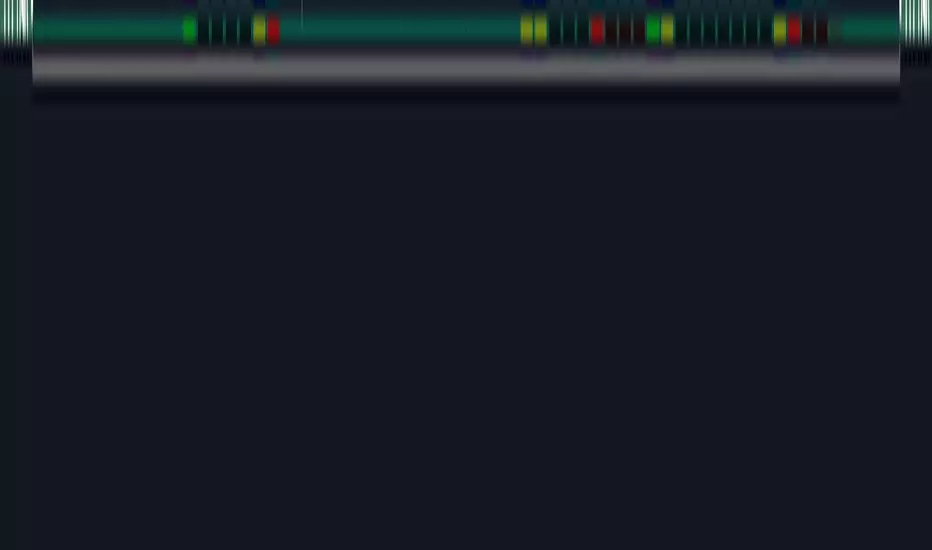
LB_MP - Trade AlertsYou must use this indicator on a LineBreak chart.
Alerts
A red bar means go short.
A green bar means go long.
Any yellow bar is a good exit, most likely the first yellow after a trade should be used.
Setting Alerts
You can set alerts by selecting the indicator when you add a new alert.
It will alert a new long position.
It will alert a new short position.
It will alert closing signals.
Honestly, you can probably find better exits on a different chart. But it's still profitable on any time frame of anything you want to trade. Enjoy!!