[GYTS-Pro] Signal Provider | WaveTrend 4D with GDM + QMCWaveTrend 4D with GDM + QMC (Professional Edition)
🌸 " 📡 Signal Provider" in GoemonYae Trading System (GYTS) 🌸
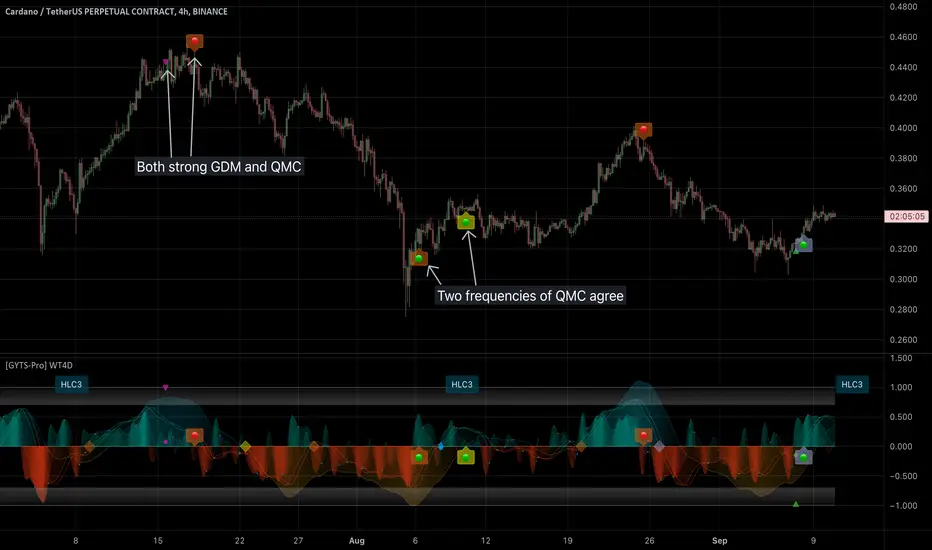
WaveTrend 4D (WT4D) is an extension of the incredible WaveTrend 3D (2022, Justin Dehorty) . This oscillator elevates the classic WaveTrend by integrating advanced mathematical models for a multi-dimensional view of market momentum, capturing subtle shifts and trends that traditional indicators might miss. Each oscillator layer uses a combination of normalised derivatives, hyperbolic tangent transformations, and dual-pole filtering (John Ehlers' SuperSmoother), providing a normalised and smooth signals.
WT4D strives to help discriminating high-quality signals from the indicator by introducing the Gradient Divergence Measure (GDM) and Quantile Median Crosses (QMC) -- see below for more information.
WaveTrend 4D is a "📡 Signal Provider" in the 🌸 GoemonYae Trading System (GYTS) 🌸. Multiple 📡 Signal Providers connect to a GYTS "🧬 Flux Composer" to find confluence. On its turn, the Flux Composer can be connected to the GYTS "🎼 Order Orchestrator" for backtesting and trade automation. However, WaveTrend 4D is a wonderful indicator on its own as well.
🌸 --- MAIN FEATURES --- 🌸
- The focus is on two type of signals: divergences between the overall trend and the waves (GDM) and the weakening of strong trends (QMC)
- The name "WaveTrend 4D" is derived from the usage of 4 dimensions, representing different frequencies or timeframes. This gives the opportunity to use 2 sets of 3 frequencies to find divergences. Next to the "fast", "normal" and "slow" frequency, the fourth frequency is called "lethargic" (very slow).
- High probability trading involves diligently determining the significance of signals. For this purpose, a novel "Gradient Divergence Measure" (GDM) is developed to signify the strength of divergence signals and are drawn as triangles next to the divergence circles.
- Another and powerful approach is to use the frequencies' crossing of the median (zero) line. We seek to only signal reversals after a significant trend, and call this the "Quantile Median Crosses" (QMC).
More information the GDM and QMC and details of all features are described below.
🌸 --- GRADIENT DIVERGENCE MEASURE (GDM) --- 🌸
💮 Introduction
--
The GDM dynamically calculates a composite measure based on multiple factors. Unlike traditional binary divergence indicators, GDM employs a continuous value system to capture the nuanced dynamics of market behaviour. This methodology allows traders and analysts to assess the potency of divergence signals with greater precision, facilitating more informed decision-making processes.
💮 Methodology
--
The GDM is calculated using a composite formula that integrates various market dynamics. At its core, it consists of six components listed below, each weighted to optimize the indicator's responsiveness to market conditions:
The magnitude of relative change between waves -- A larger difference between the waves, i.e. lower high or higher low could signify a stronger divergence.
The absolute value of the latest wave -- The strength of the latest wave provides insight into the extremity of the market conditions.
Slope of the divergence -- The slope between the two points of divergence essentially measures the rate of change in the frequency\'s value over time. It captures both the direction and the steepness of the indicator’s move between two waves.
The magnitude of relative change of the price -- A divergence means that the oscillator shows an opposite pattern than price action. Thus, if the price makes a significantly higher high or lower low, but the indicator does not, this discrepancy can be used to measure the divergence strength. This components measures the price's extrema during the crosses of the indicator's waves.
Higher timeframe's frequency trend -- Similarly, instead of looking at the price directly, this component measures the more general trend of the price by using the higher timeframe frequency (i.e. the slow frequency when looking at divergences of the normal frequency).
Time duration -- Lastly, the time duration between the two points of a divergence can also be a factor. A divergence that spans over a longer period might indicate a more significant market sentiment shift.
Note that these 6 components are not independent, e.g. the slope is actually the result of the magnitude between waves, the absolute value and time duration. However, the default GDM is carefully tuned to include all these features without being too sensitive to outliers.
💮 Tuning the GDM
--
At the same time, different people have different ideas of what factors are important to denote a "strong" divergence. For this reason, in the 🧰 Professional Edition of this indicator, as opposed to the 🤲 Community Edition, the user can select between different "GDM profiles" that resemble a certain approach:
Upon initiating the GDM indicator, users are prompted to select one of six distinct profiles. Each profile adjusts the indicator’s parameters to optimize performance under different market scenarios:
balanced : Offers a general approach, with a balanced assessment of market conditions without specific focus on any one aspect.
regular divergence : Emphasises price action, ideal for identifying classical divergence patterns where price and momentum diverge.
wavetrend focus : Minimises the influence of price action, concentrating on the WaveTrend oscillator’s behaviour for trend analysis.
short-term waves : Prioritises the slope of the waves, targeting traders interested in short-term market movements and potential inflection points.
long-term waves : Extends the analysis period, focusing on longer-term market trends and wave duration for strategic positioning.
overbought/oversold : Highlights extreme conditions in market valuation, useful for identifying potential reversal points from overbought or oversold levels.
The 🎩 Ultimate Edition takes it a step further and gives full freedom to dial in weights for each of the 6 components. The GDM formula is set up in such way to accommodate ease of use and react logically to these parameters. Having said that, the default GDM calculation should be more than sufficient for most cases.
Another way of tuning the GDM is to dial in the "sensitivity". This controls the extent of normalisation between signals, and essentially affects how often strong GDMs appear. At the conservative end (higher sensitivity), the strong GDMs are less frequent but are relatively significant, while with a lower sensitivity the strong GDMs appear more frequent.
💮 GDM on the Oscillator
--
Coming back to the indicator, the GDMs are represented by triangles and their value represents the strength. A value close to `1` signifies a strong bearish divergence and thus a possible reversal of continuation of a downtrend. Similarly, a value close to `-1` signifies a strong bullish divergence.
Note that there are two colour sets which can be enabled and disabled. One uses crosses between the fast and normal frequencies (with the slow frequency acting as the price trend with which there should be an opposite interaction -- "divergence"). Similarly, crosses between the normal and slow frequencies (with the lethargic (the most slow) frequency acting as the price trend) are used to find divergences on a higher timeframe.
🌸 --- QUANTILE MEDIAN CROSSES (QMC) --- 🌸
💮 Introduction
--
A different and powerful approach is to use the frequencies' crossing of the median (zero) line. This would signify a continuation of the reversal. However, also here, not all of those crossings would be trades with a high probability of success. For this reason, we seek to only consider reversals after the most strong trends start to show weakness. We call these reversals the "Quantile Median Crosses" (QMC), derived from the methodology.
💮 Methodology
--
To find this "most strong trends", we calculate the integral ("the area") of a frequency between all historical median crosses, and take an upper quantile of those integrals. This means that when the series is crossing the median in often (consolidation), the ares between those crosses would be small. But if there was a strong momentum, and the series would separate itself significantly from the median and would do so for a long time, its area would be large.
So after considering all the past integrals, we take the upper quantile of those (i.e. sort all integral and for example take the top 5%) and if the latest trend's integral was in this upper quantile, it is considered "significant". Hence, the name "quantile" in the name "Quantile Median Cross"
💮 Tuning the QMC
--
The QMC is easily tuned by its "sensitivity". This basically represents a set of quantile bounds for the normal, slow and lethargic series. We have set these 3 parameters for each sensitivity profile after careful testing. The 🎩 Ultimate Edition gives full control for each quantile bound.
💮 QMC on the Oscillator
--
The QMC is shown as a label "🔴" above the median or with "🟢" below the median. In the 🎩 Ultimate Edition, the user instead sees the exact quantile and the number of samples. The normal frequency has a "bronze" colour, the slow frequency "silver" and the lethargic is "gold". In addition to the labels, there are also diamond shapes in the same colour drawn on the median in the oscillator. This represents the previous median crossing, and helps the user to see between which two points the integral is calculated.
🌸 --- DETAILED FEATURES --- 🌸
As discussed, at its core, the main signals are the Gradient Divergence Signals (GDM) and Quantile Median Crosses (QMC). However, there are more very powerful features that this 📡 Signal Provider can include. Below is a list of all features and we differentiate the availability of a feature per 📡 Signal Provider version by using these icons: 🤲 Community Edition; 🧰 Professional Edition; 🎩 Ultimate Edition.
Before going into the features, there are two important aspects to note: As this is a 📡 Signal Provider, it can be connected to the GYTS 🧬 Flux Composer and this is possible for each edition (i.e. the 🤲 Community Edition 📡 Signal Composer works with the 🤲 Community Edition 🧬 Flux Composer, and the same holds for the 🧰 Professional and 🎩 Ultimate Editions). Contrary to most other indicators that connect with each other, the signals that are passed are not just binary signals ("buy" or "sell") but pass the actual GDM and QMC values. This gives the opportunity in the 🧬 Flux Composer to more accurately use multiple signals with different strengths to finally give an overall signal.
The second important aspect is that for the 🤲 Community Edition, there are two versions of this 📡 Signal Provider: one that has the GDM feature and another the QMC feature. Besides that, the list below depicts a fairly complete overview of all the features across different versions:
( 🤲 🧰 🎩 ) Four Dimensions -- All four dimensions are available for each edition. The input data can also be transformed with an EMA or CoG as in the original WaveTrend 3D.
( -- 🧰 🎩 ) Both GDM and QMC -- Only the Pro and Ult versions include both the GDM and QMC in one indicator
( 🤲 🧰 🎩 ) Custom indicator name -- There's an option to give a name to the indicator which will be displayed on the chart. On its own, it might not be helpful, but in the GoemonYae Trading System (GYTS) suite, it helps to identify the different Signal Providers.
( 🤲 🧰 🎩 ) Visual improvements -- As in the original WaveTrend 3D, there are various ways the indicator can be displayed, including emphasising a certain frequency, a "mirror mode" and separating each frequency. We have expanded on some of these options. For example, the divergences, GDMs and QMCs are also displayed when the frequencies are separated, the mirror mode works with the emphasised frequency, there are more options to control the width of the emphasised frequency and each frequency can be enabled or disabled.
( 🤲 🧰 🎩 ) Support for HTF -- The indicator works on higher timeframes than the current chart and all parameters and calculations are scaled accordingly.
( __ 🧰 🎩 ) Support for other tickers -- There is also an option to select another ticker than the current chart. This especially makes sense in the 🌸 GYTS suite 🌸, where multiple Signal Providers are combined to find confluence. For example, a common approach is to use a certain ETF (or BTC in crypto) on a higher timeframe as filter to determine overall market direction.
( __ __ 🎩 ) Disable "only true divergences" -- In the Ultimate Edition, less signals can be filtered out when disabling looking at the third frequency. In general, this is not the best idea but it can be helpful when filtering signals with other means.
( __ 🧰 __ ) GDM profiles -- As mentioned, the GDM is carefully tuned and we consider it an excellent method to signify the strength of a divergence. Therefore, the standard calculation in the Community Edition is sufficient. Nevertheless, the Pro Edition has profiles (as previously described) so the user can select how (s)he feels a "strong divergence" should be.
( __ __ 🎩 ) GDM weights -- Full control over the weights of the 6 components of the GDM instead of using the profiles. The GDM algorithm is set up in such way that this is possible in an intuitive way.
( __ __ 🎩 ) Disable asymmetric GDM calculation -- Calculate the bullish and bearish GDMs independently (asymmetric calculation) or normalise them altogether (symmetric calculation). This can sometimes be helpful to filter out weaker GDMs depending on market conditions.
( 🤲 🧰 🎩 ) QMC calculation -- Using the QMC is possible in all versions, and each of the Normal, Slow and Lethargic frequencies can be toggled on and off.
( __ 🧰 __ ) QMC sensitivity -- Similar to the GDM profiles, in the Pro version there are presets to make the sensitivity higher (and thus get more signals) or lower.
( __ __ 🎩 ) QMC quantile threshold -- Instead of the sensitivity presets, in the Ult Edition the quantile threshold for each frequency is set. The user also sees the actual quantile and number of samples in the label
( 🤲 🧰 🎩 ) WaveTrend 4D settings -- Possibility to adjust the core WaveTrend settings
( 🤲 🧰 🎩 ) Alerts -- When alerts are enabled, TradingView will notify when there is a bullish/bearish strong GDM (i.e. within the zone) and a bullish/bearish QMC.
Signalsprovider
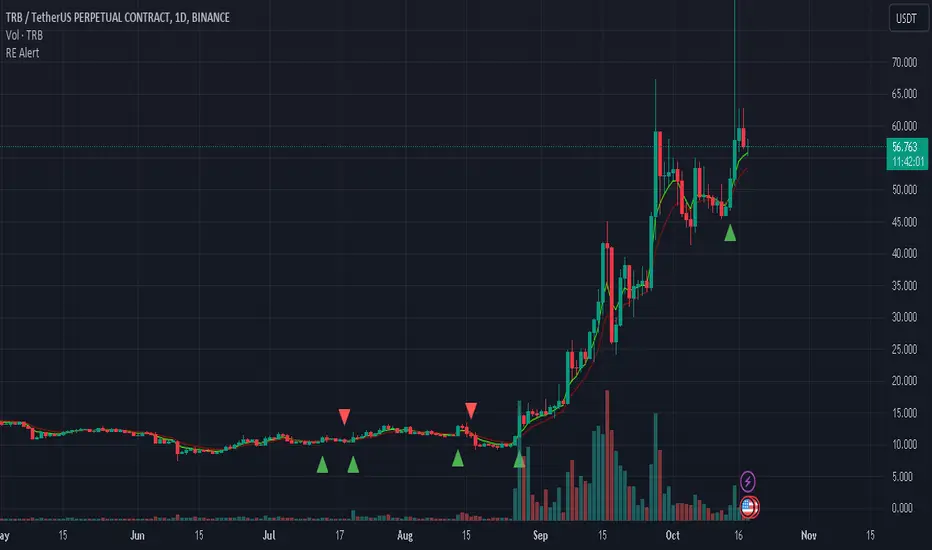
REMA CROSSOVER BY JUGNUThis indicator triggers alerts for long and short positions on DAILY TIME FRAME for SWING trades based on the conditions which described below. This script will generate alerts when the following conditions are met:
LONG POSITION:
RSI(14) above 50.
EMA(5) crosses above EMA(10).
Indicator Triangle Green below price bars
SHORT POSITION:
RSI(14) below 50.
EMA(5) crosses down EMA(10).
Indicator Triangle RED above price bars
This script plots green and red triangles below and above the price bars to indicate long and short alert conditions, respectively. It also triggers alerts when these conditions are met.
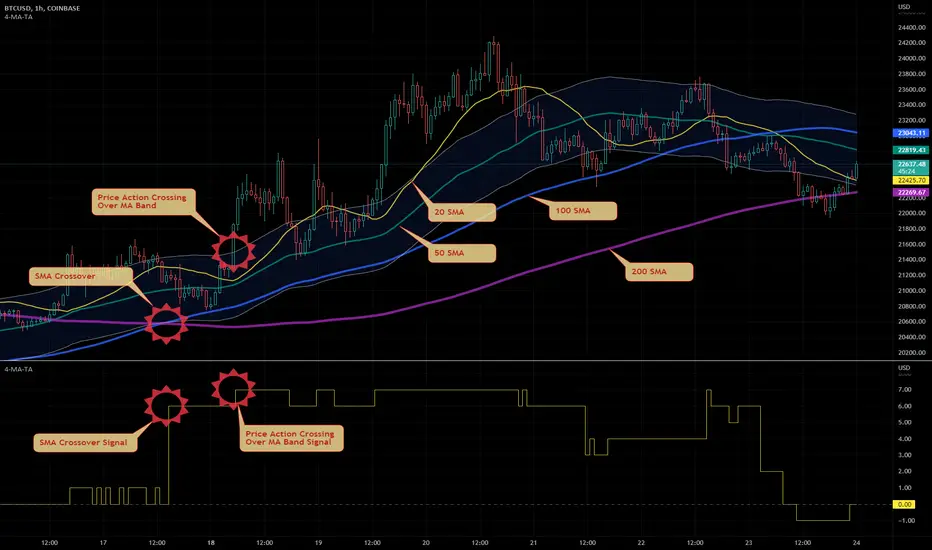
HTF 4 MA Trend Analysis by Prosum SolutionsIntroduction
This indicator will render up to four (4) moving averages on the chart in any higher timeframe and provide a "MA Bullish/Bearish Strength Signal" as a plot output that can be used to link with other indicators on the chart that use the `input.source()` function.
How is it original and useful?
The indicator allows you to use up to four (4) different moving average types of various types, each at different lengths. The moving average types that are supported are:
SMA - Simple Moving Average
EMA - Exponential Moving Average
RMA - RSI Moving Average
WMA - Weighted Moving Average
VWMA - Volume-Weighted Moving Average
SWMA - Symmetrically-Weighted Moving Average
This indicator makes use of the security() function and applies the best-practices as provided by the PineCoders' script called " `security()` revisited PineCoders " so that the indicator will not repaint when you refresh the chart or re-open it at a later date.
What does it do and how does it do it?
Using the four moving averages, each with increasing lengths, allows you to confirm bullish and bearish trends using a weighted rating system to compute a trend strength signal value. Specifically, the indicator provides a plot data series called "MA Bullish/Bullish Strength Signal" the is simply the summation of the bullish/bearish trend weight values between the four moving averages. The bullish/bearish trend weight values are determined by the position of the moving average lines relative to each other. For example, when Moving Average 1 is above Moving Average 2, this is considered a bullish trend and the weight value will be 1. The weight values can be changed to in the settings to define your own specific weights/values to rate the trend strength. The following list defines the meaning of the "MA Bullish/Bullish Strength Signal" value.
-6 = Strong bearish
-2 = Moderate bearish
2 = Moderate bullish
6 = Strong bullish
An additional option allows you to add a band around a specific moving average using a deviation percentage to further evaluate the candles being above or below the upper/lower bands. When the candle's close value is above or below the bands, you can add another weighted value to the signal result. As a result, an additional plot series called "MA Bull/Bear+Band Signal" is provided to include the moving average band weight.
Lastly, the chart example above demonstrates how you can use the indicator as an overlay to the price chart or as a separate panel above or below the price chart. The indicator can change what to plot based on an input setting called "Display Mode". When set to `Overlay`, the indicator will draw only the MA and MA Band plots. When set to `Pane`, the indicator will draw only the signal plots over a zero line to visualize the signal changes with the chart events.
Enjoy! 😊👍
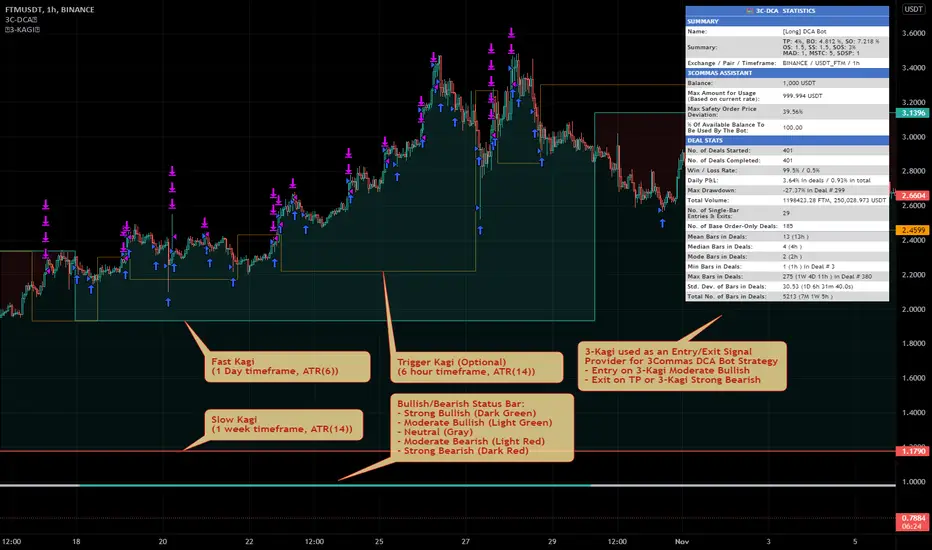
MTF Triple Kagi Indicator v1.0Introduction
The indicator attempts to implement three (3) time-based, multi-timeframe, non-repainting Kagi lines as an overlay to your chart and applying a trend bullish/bearish trend strength evaluation based on the position of the Kagi close prices between the Fast Kagi and Slow Kagi.
How is it original and useful?
This indicator is unique in that it combines a Fast and Slow Kagi timeframes and applies the following trend analysis to determine bullish/bearish strength:
Strong Bullish = when both Fast and Slow Kagi are below the current price and Slow is less than or equal to Fast Kagi.
Moderate Bullish = when both Fast and Slow Kagi are below the current price and Slow is greater than Fast Kagi.
Neutral = when current price is between the Fast and Slow Kagi.
Moderate Bearish = when both Fast and Slow Kagi are above the current price and Slow is less than Fast Kagi.
Strong Bearish = when both Fast and Slow Kagi are above the current price and Slow greater than or equal to Fast Kagi.
In addition, the indicator adds a Trigger Kagi that you can optionally use as a faster Kagi to see more confirmation of trend within the Fast/Slow Kagi combination. It is not used in the bullish/bearish comparison analysis but is simply informative in confirming the trend with a smaller timeframe than the Fast Kagi.
How does it compare to other scripts in the Public Library?
This indicator makes use of the security() function and applies the best-practices as provided by the PineCoders' script called `security()` revisited so that the indicator will not repaint when you refresh the chart or re-open it at a later date. In addition, at the time of initial publishing, this indicator is the only publicly available indicator that combines multiple time-based Kagi lines to offer a simple trend analysis status for short-term or long-term traders.
What does it do and how does it do it?
When applied to the chart for the first time, the default settings will work to produce Kagi lines from the beginning of the chart history up to the real-time bar. All three Kagi lines will default to the current chart's timeframe, therefore it is expected that you open the settings and adjust the Fast and Slow Kagi settings to provide the full effects of the indicator's features. The example chart above is using a 1-Hour chart with a Fast Kagi of 1 day (ATR(6)), a Slow Kagi of 1-Week (ATR(6)) and a Trigger Kagi of 6-Hours (ATR(14)). These settings are not universal for all markets; thus, it will require trial and error adjustments to tune the indicator to the specific market you are evaluating.
Lastly, the example chart above is illustrating how this indicator could be used with the 3Commas DCA Bot Strategy to provide entry and exit signals to simulate a bot's performance using the powerful Strategy Tester within TradingView to further evaluate the indicators influence on hypothetical trading conditions. The indicator provides a plot data point called "Kagi Bullish/Bearish Signal" that can be used in other chart strategies as a signal provider. The following is the meaning of the numeric signal value for this data point:
Strong Bullish = 2
Moderate Bullish = 1
Neutral = 0
Moderate Bearish = -1
Strong Bearish = -2
Enjoy! 😊👍
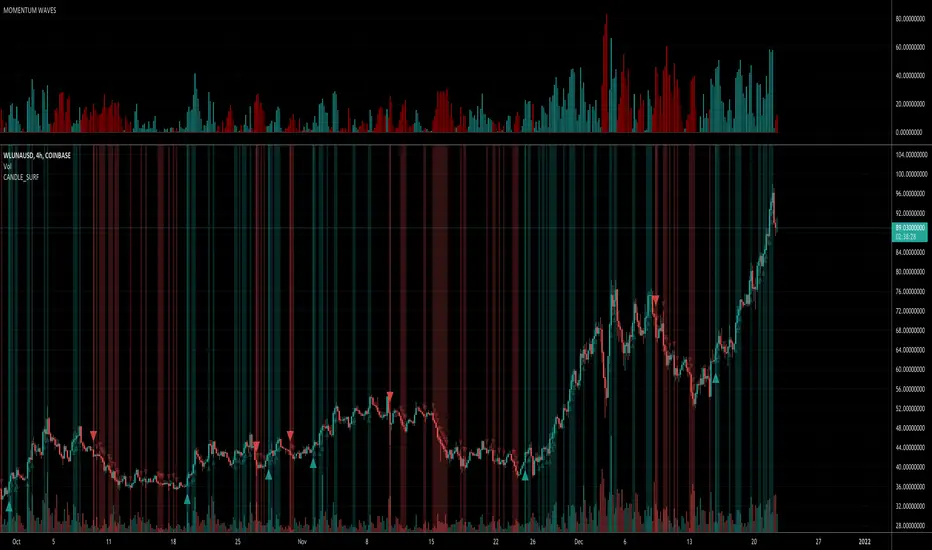
Candle Surf SignalThis script works very well for all assets across various timeframe charts. Good for use with scalping, long term swings, or in combination with multi-timeframe trading.
Surf the candles!
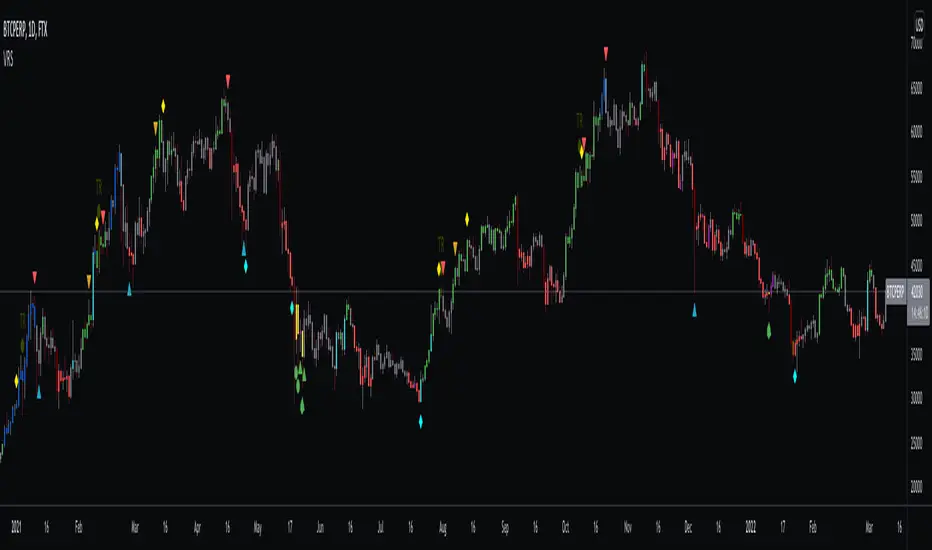
VR Crayons (Signals, Trend and Reversal Indicator)This indicator is a combination of many different basic technical analysis tools, such as RSI, Bollinger Bands, Moving Averages and others.
It's main goal is to provide a fast and reliable visual representation of the current price action and possible entry and exit points for trades.
Explanation of the individual functions:
The indicator includes 2 different functions:
1) The crayons (colors of the candles) show the current state of price action and trend
and can be used to find oversold or overbought areas as well price reversal points.
The colors can be turned off and/or changed in the settings.
2) The signals that can be used to enter or exit trades. There are 4 different types of signals:
Mini signals, high/low timeframe signals and special signals.
All of them can be turned on and off in the settings.
Further explanations
Crayons:
There are 3 general colors, gray, green and red.
Red signals a general downtrend,
Green a general uptrend,
Gray sideways action.
There are also multiple other colors to visualize special situations:
Blue signals overbought areas
Orange signals oversold areas
Yellow and purple signalling heavy oversold areas and a possible trend reversal to the upside
Dark Green signals heavy overbought areas and a possible trend reversal to the downside (Also marked with "R")
Lastly there are two special candle colors, dark red and light blue.
Those are volume weighted indicators of heavy dumping/pumping. I implemented them to signal higher than
average volume which dan be useful when looking for breakouts/-downs or to avoid fomoing into huge pumps or dumps
Signals:
As mentioned above, there are 4 different signal categories.
Signals for Lower Timeframes (5-30m) and Higher Timeframes (1h-D), special signals working on all timeframes
and mini signals which can be taken as TP points but also as entry points for trades.
The placement of the signals shows if it's a "BUY" (below the candles) or a "SELL" (above the candles).
Even-though signals are named "LTF signals", from my experience they can be used on all timeframes.
HTF signals do not work as good on lower timeframes.
For the best visualisation, disable candle borders in settings and turn the wick color to gray.
!! DISCLAIMER !!
All of these signals and bar colors are just visual helpers to find possible entry and exit points for your trades
and to get a quick overview of the current market conditions.
I would always recommend to use at least some basic technical analysis in combination.
And as always in trading, please use proper risk management! None of these signals can an will be 100% accurate!
!! All of these signals and colors are only valid AFTER candle close !!
!! This indicator is NOT repainting !!
Please don't use the comment section to ask for access to this indicator, you can always write me a PM.
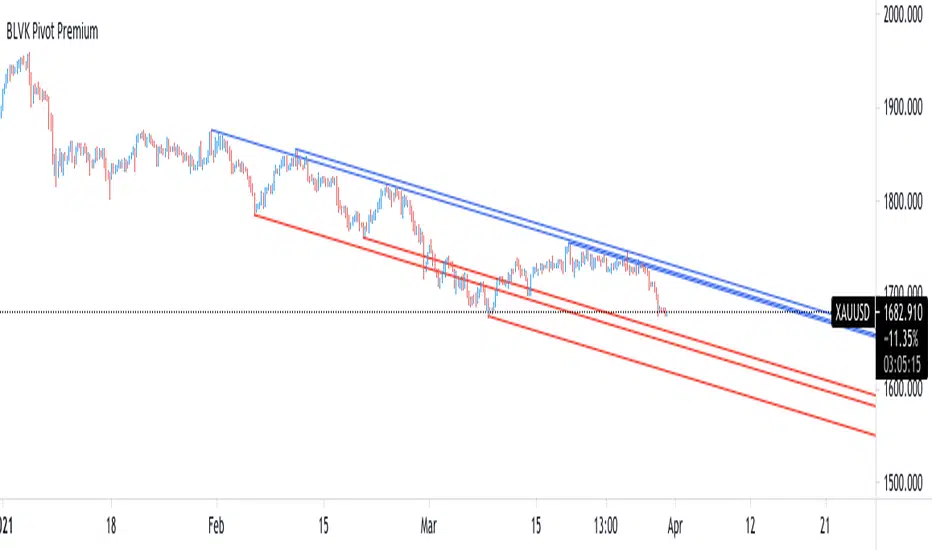
BLVK Pivot PremiumDisplays lines connecting past pivot high/low points with each line having the slope of a linear regression . This slope can also be controlled by the user with the 'Slope' setting. Each line can be used as a support or resistance by the user.
Settings
Length : Pivot length. Use higher values for having lines connected to more significant pivots points.
Lookback : Number of lines connecting a pivot high/low to display, with a total of lines equal to Lookback*2
Slope : Allows the user to multiply the linear regression slope by a number within -1 and 1
Limitations
The script has currently several real time behavior limitations. Lines are displayed retrospectively and will not update with the arrival of new bars. Readjusting the indicator to newer pivots will require the user to either hide/unhide the indicator or change its settings.
High Length or Lookback values might not return any lines if the location of a pivot point is outside the defined buffer size of the indicator (set as 5000 bars).
How To Use
The indicator can be used to get supports and resistances and is more so closer to a drawing tool due to its limitations. The lines not updating with the arrival of new bars have the advantage of providing fixed supports/resistances.
The Slope setting allows the user to control the angle and direction of the lines. Using a Slope of 1 will return lines with the same slope as the one of a linear regression fit from the farthest pivot point displayed by the indicator to the most recent bar.
Conclusion
We hope you like this indicator (drawing tool) and find it useful for drawing your support & resistances in a unique way!
OH2B Trading Indicator Ver2.0OH2B TRADING INDICATOR
The OH2B Trading Indicator is an indicator built for beginners.
It gives you entry points for BUY and SELL based on Trend Channel and Ema-Crossover.
It also gives you EXIT POINTS for taking profits based on the Average Directional Index and Relative Strength Index.
TRADING WITH OH2B INDICATOR
The OH2B Trading Indicator gives you entry points for BUY or SELL .
When the ema1 crosses above ema2, the trend channel will be painted GREEN in color, and a BUY signal will appear. = BUY
When the ema1 crosses below ema2, the trend channel will be painted RED in color, and a SELL signal will appear. = SELL
When a BUY or SELL signal appears on the chart, don't rush into any trade.
Please allow a few hours for confirmation of signals .
After confirmation, it is suggested to enter 50% first and another 50% near the Trendlines .
After entering a trade, please remember to set a stop-loss alert of an opposite signal.
To TAKE PROFIT , please follow the Triangles indicated on the chart
RED Triangles are the Take-Profit targets for the BUY (long) signal
GREEN Triangles are the Take-Profit targets for the SELL (short) signal
*After taking profit, please set a Stoploss to at least break-even level to protect your profits.
Often the price goes to the Trendlines after the signal, so keep some funds to increase the position or even open all position near the Trendlines , or use it for re-enter with SL after you closed position on TPs.
Setting alerts for Trade
Remember to set an alert so that you won't miss any opportunity.
TradingView will notify you immediately when a new signal pops up on the chart.
Tips for the beginners:
Recommended using the indicator at 1H - 2H Timeframe .
Recommended using the indicator for Spot Trading at both Crypto and Stock Market.
Do not use leverage above 5x.
No more than 5% of the deposit in one trade.
Do not rush into any trade when a new signal pops up, please allow a few hours for confirmation of signals.

Bull Vs Bear: (Scalping Signal Generator)A useful indicator for scalpers who try to make profits out of small price movements intraday basis. I reckon with the combination of this indicator with other trading tools short term traders might gain some further trading edge in the market. The beauty of this indicator is that it tells any traders in a glance that what current market sentiment outlook is with those beautiful tiny bears and bulls character. The indicator has been created by the fusion of Exponential Moving Average (EMA) and Moving Average Convergence Divergence (MACD) with conjunction to normal arithmetic conditional calculations. It is especially for the short term traders (scalper/scalping) who rely on the short price changes throughout the day on any financial market assets class. The purpose of this indicator is to serve a short term trader buy or sell signals which we can clearly see through the sweet character "Bull" which indicates the "Long/Buy" signal where character "Bear" indicates "Short/Sell" signal. One can immediately trade when the signal is generated and must switch the direction without any delay if the opposite direction signal has emerged so as not to get caught in potential risk or even loses. This indicator can also be used for midterm trade so there are no limits in the scope for use of this indicator and it all depends on users who need to test and feel on multiple timeframes and different financial assets class. It supports the alert feature too so a user can activate it to stay aware of new signals by receiving notification on every new signal generation. In the end, nothing is guaranteed in the financial market, and profits and losses are part of games so to avoid any losses or trade wisely this indicator should be used in conjunction with other useful trading tools in this way the odds should increase with a good trading edge in the market.

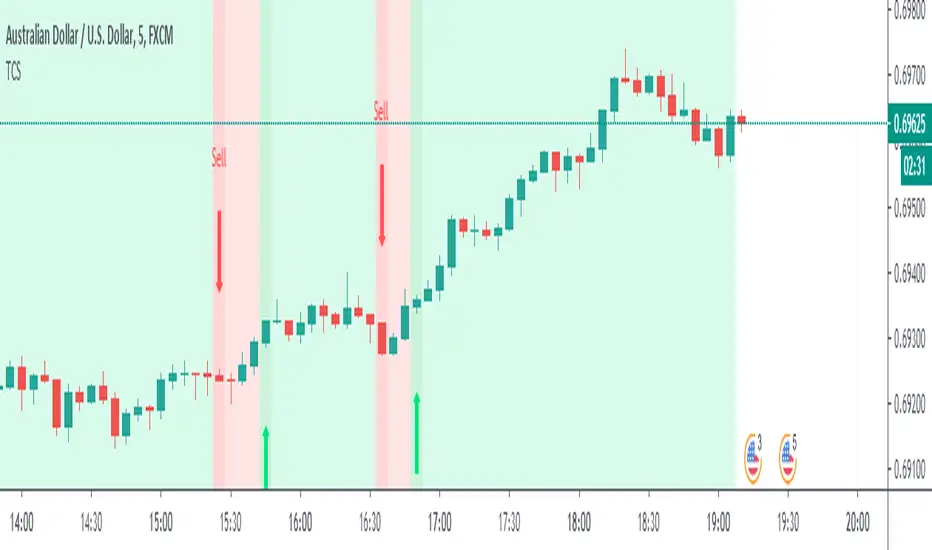
Triple-CandleStick-Strategy (AKA : TCS)Triple Candlestick Strategy
An indicator that helps us to evaluate current and future possible price direction through the background colors. Green for bullish and Red for a bearish market. This indicator shoots signals either long or short depending on which direction the triple candlestick pattern is formed. Three candles up will fire a long signal while three candles down a short signal. The light-dark shaded background color with arrows (either up or down) is the new entry at the certain direction of the market for the chosen symbol (in our case AUDUSD). Useful for glance view of overall market sentiment and one can use alert features for getting aware of the situation.
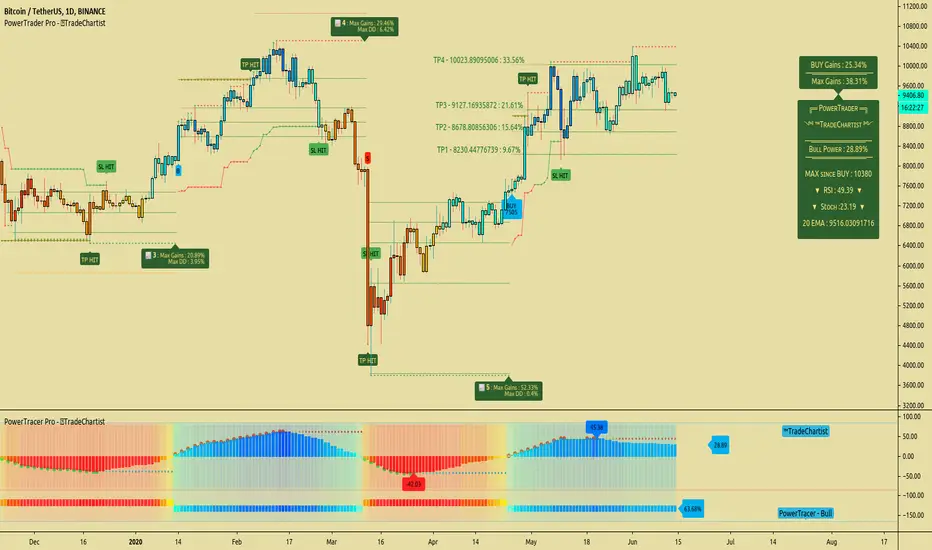
TradeChartist PowerTrader ProTradeChartist PowerTrader Pro is a versatile Signal generator and Signal plotter on the main price chart based on signals from other compatible scripts like TradeChartist PowerTracer Pro . This elegantly designed script plots the following based on user preference.
BUY and SELL signals based on external compatible signal source
Automatic Targets if opted from settings
Trailing or Fixed Stop Loss based on user input
Take Profit % and Quantity to trade based on user input
PowerTrader Dashboard displaying 14 period RSI, Stoch and 20 EMA
Real-Time Gains Tracker displaying Max Gains and open PnL
Past Performance labels displaying Max Gains and Max Drawdown for each trade
Higher Highs since BUY and Lower Lows since SELL
Once the external Signal is connected to the script, the results based on signal backtester ( TradeChartist PowerTracer Pro Backtester ) can be used to optimise the settings to generate plots and also to set Alerts for the following.
Long and Short Signals
Long and Short Stop Loss Hit
Long and Short TP Hit
Move up/down Trailing SL
To create alerts, the user must choose PowerTrader Pro from the alert condition drop-down and choose the required alert. Since the signals are generated only after confirmation, "Once per bar" must be used for Alerts.
===================================================================================================================
This is not a free to use indicator. Get in touch with me (PM me directly if you would like trial access to test the indicator)
Premium Scripts - Trial access and Information
Trial access offered on all Premium scripts.
PM me directly to request trial access to the scripts or for more information.
===================================================================================================================
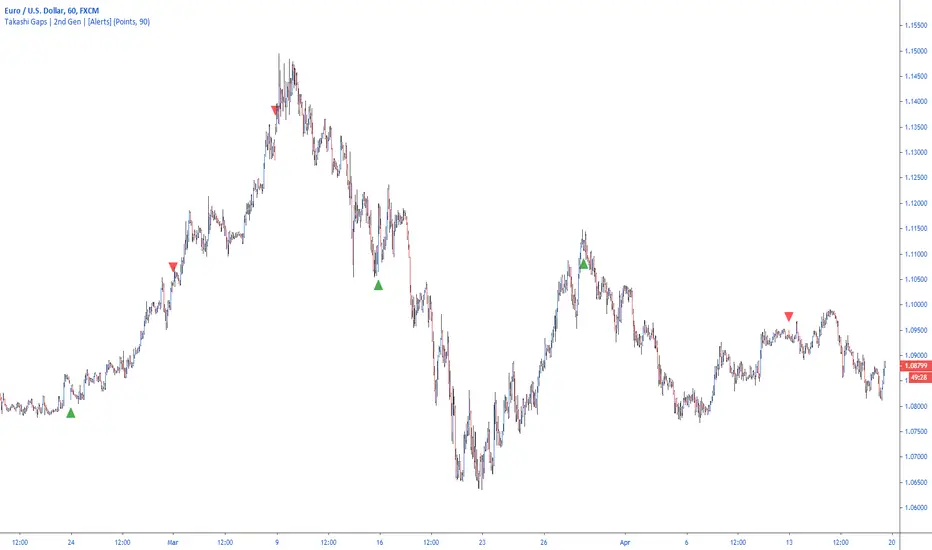
Takashi Gaps | 2nd Gen | [Alerts]Spot gaps between bars and benefit from the correction of the market as the price restores its position.
Inputs
Value In
Options input. Defines if the gap between bars will be checked by Points or Percent.
Gap Size
Float input. Value to trigger a signal if the gap between bars is bigger than.
To get access to this and other scripts check links below.
Bullyena SignalsWhat is Bullyena Signals?
-It is an indicator that aids the trader in making entry/exit decisions.
-Note that this is optimized for swing traders but you can also use this for scalping.
-The algorithm contains multiple modern indicators and some of them are proprietary.
Bullyena Signals usage:
-Gives entry/exit signals
-Shows the trend of the price using a bar color overlay.
-Shows trailing stops
-Shows buy/long and take profit signals
-Ichimoku cloud for trend confirmation
Installation
- For candlestacks, make sure to Right click > Settings > Symbol > disable wicks and borders.
Access and Documentation
- Message or PM me to know how to get access

Simple EMA Trading SignalUse it on:
1. Heiken Ashi, Bitstamp: BTCUSD , M15
2. Heiken Ashi, Bitstamp: BTCUSD, D1
3. USOIL Candlesticks H1
4. EURUSD Daily Candlesticks
5. GBPUSD Daily Candlesticks
6. SPX W1 Candlesticks
7. SPX H1 Heiken Ashi
8. XAUUSD Daily

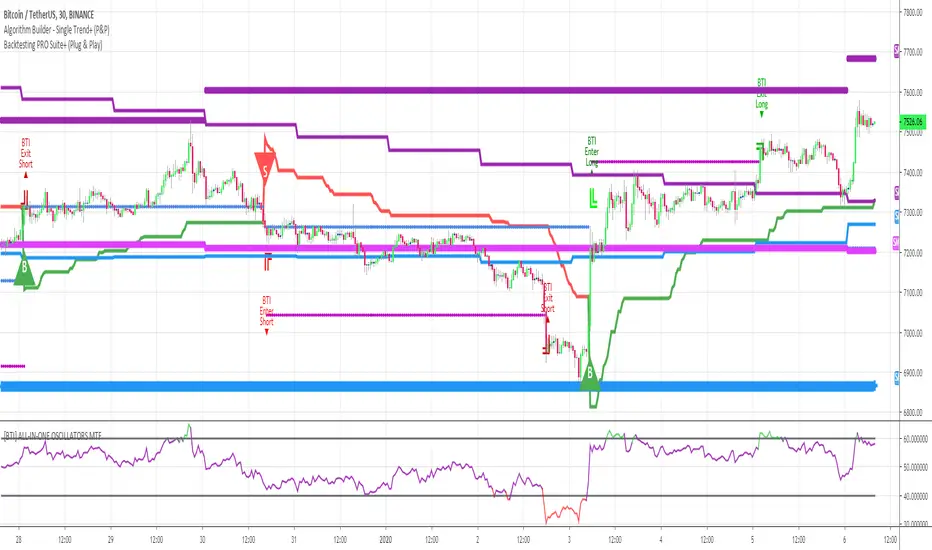
Algorithm Builder - Single Trend+ (Plug&Play)Hello traders
I. SCRIPTS ACCESS AND TRIALS
1. For the trial request access, they have to be done through my website .
2. My website URL is in this script signature at the very bottom (you'll have to scroll down a bit and going past the long description) and in my profile status available here : Daveatt
Due to the new scripts publishing house rules, I won't mention the URL here directly. As I value my partnership with TradingView very much, I prefer showing you the way for finding them :)
3. You may also contact me directly for more information
II. Algorithm Builder - Single Trend+ Plug&Play
2.1 Concept
That script is an upgrade of the Single Trend:
The Algorithm Builder - Single Trend+ (Plug & Play) is made to detect the convergence of many unrelated indicators, and give a BUY or SELL signal whenever all the selected sub-indicators are converging in the same direction.
The Single Trend+ (Plug & Play) gives one single entry per identified trend - unlike the Multiple Trends editions (also available on my scripts page) which may give more than 1 entry per trend.
The traders select the sub-indicators they want, and see in real-time the BUY and SELL triangles being updated.
III. Plug & Play
Hope you're ready to be impressed. Because, what I'm about to introduce, is my best-seller feature - and available across many of my indicators.
In TradingView, there is a feature called "Indicator on Indicator" meaning you can use an external indicator as a data source for another indicator.
I'm using that feature to connect any external indicator to our Algorithm Builder Single Trend+ Plug & Play (hence the plug and play name).
Let's assume you have your RSI divergence indicator - which is not part of the Algorithm Builder - but noticed that the convergence of an RSI divergence and a MACD gives strong signals.
I mentioned an RSI divergence, but you may connect any oscillator (MACD, On balance volume, stochastic RSI, True Strenght index, and many more..) or non-oscillator (divergence, trendline break, higher highs/lower lows, candlesticks pattern, price action, harmonic patterns, ...) indicators.
Any indicator that displays visual signals are eligible for this feature .... in other words.... all possible indicators. You're welcome :)
THE SKY IS (or more likely your imagination) is the limit :)
Fear no more. The Plug&Play technology allows you to connect it and use it in the convergence/confluence calculations.
Hence, whenever the MACD and RSI divergence will be in the same direction for the first time, you'll get a signal. For the first time only because this is a Single trend edition - you may enter multiple times using our Algorithm Builders - Multiple Trends editions.
To connect your external indicator to ours, we're using a native TradingView feature, which is not available for all users.
It depends on your TradingView subscription plan ( More info here )
If you intend to use our Algorithm Plug&Play indicator, and/or our Backtest Plug&Play suites, then you must upgrade your TradingView account to enjoy those features.
We value our relationship with our customers seriously, and that's why we're warning you that a compatible TradingView account type is required - at least PRO+ or PREMIUM to add more than 1 Plug&Play indicator per account.
We go in-depth on our website why the Plug&Play is an untapped opportunity for many traders out there - URL available on my profile status and signature
IV. Why the Algorithm Builder Single Trend+ (Plug&Play) may help you
I worked with many traders during my career, and their feedback about trading is often pretty similar.
They all tried a lot of complicated indicators, losing their capital, and finally getting back to the basics (even to the basic indicators if I might say)
The art is finding a good combination of indicators and setting strict money/risk management rules.
Easy in concept, but more than 90+% of traders lose money on the markets... which teach us that trading is not only about drawing trendlines, or using cool indicators but finding ways to ease our psychology while trading.
4.1 The Algorithm Builder trading framework
The sub-indicators (full list on our website) weren't chosen randomly. They're based on a trading method we've developed over the last 6 years - while working with traders and other trading quants.
The Algo Builders are made to detect a convergence - and as such, will give a signal once a trend has been identified.
They're not made to detect reversal but have been designed to give a signal when all sub-indicators are either ALL bullish (green) or ALL bearish (red).
We provide a framework based on indicators we selected because they:
1. make sense to be used altogether
2. work on asset classes like INDEX, CRYPTO, STOCK OPTIONS, FOREX, COMMODITIES
3. it may expand your knowledge about what detecting a convergence with pre-selected indicator really means
4.2 Supports and Resistances
The indicator displays the main algorithmic supports and resistances according to our trading method.
I think they're relevant for all asset classes, but you're absolutely free to use any different supports/resistances logic if you want to.
I'm not against it because I know that pivots, Fibonacci levels, etc. may work very well also.
4.3 Choose your favorite risk management algorithm
1/ Pre-defined Algo S/R method using:
- a supertrend of the stop-loss
- the nearest algorithmic resistances for the take profit levels.
2/ Define your own Stop-loss and Take-profits level in real-time
Stop-Loss Management
For what's following, let's assume that 2 is the stop-loss value you inserted in the indicator, and the Algorithm Builder gives a BUY signal.
This is NOT a recommendation at all, only an example to explain how this feature works.
- %Trailing: The Stop-Loss starts 2% away from the entry price - and will move up (because we're on a BUY trade as per our example) every time your trade will gain 2% profit
- Percentage: The Stop-Loss stays static 2% away from the entry price. There is no trailing here
- TP Trailing: This is a very awesome feature. The stop-loss is set 2% away when the trades start.
When the TP1 is hit, the stop-loss will be moved to the Entry price (also called breakeven).
When the TP2 is hit, the SL is moved to the previous TP1 position
- Fixed: Set the Stop-Loss at a fixed position (value should be in currency/units)
Take Profits Management
You can manage up to 2 take profit levels defined as a percentage or price value.
The expected input is in percentage value (for instance, setting the % target of TP1 to 2% will set the TP1 level 2% away from the entry price
4.4 Built-in Trade Manager
This is very likely the most loved utility script that we shared on TradingView.
It's included in your Algorithm Builder - Single Trend+, and will certainly help you immensely to analyze your charts and your trades.
We made sure that all the graphical elements on the chart will be updated in real-time whenever our user change anything on the indicator configuration.
You'll also be able to change the Trade Manager labels positions as you wish :)
4.5 Built-in Risk-to-Reward Panel
The good stuff doesn't stop here.
You'll notice that this sometimes green (when in a LONG), sometimes red (when in a SHORT) panel at the right of your chart.
It displays for the selected trading algorithmic (see 2.3.2 above), a ton of useful real-time analytics.
- Entry Price: the price when the Algorithm Builder will give a signal.
- The Trade PnL in percentage.
- Entry Stop Loss: Distance (in currency/units) between the selected stop-loss algorithm (percent, trailing, TP trailing, etc.) and the entry price.
- Entry TP1: Distance (in currency/units) between the entry price and the first take profit
- Entry TP2: Distance (in currency/units) between the entry price and the second take profit
- Risk/Reward TP1: Using the Stop-loss distance at entry, and Take Profit 1 at entry to compute the risk-to-reward ratio.
- Risk/Reward TP2: Using the Stop-loss distance at entry, and Take Profit 2 at entry to compute the risk-to-reward ratio.
For more details, please check the guides section of my website. Links are in my signature and profile status.
4.6Hard Exits
Our trading method is known for the hard exits, also called invalidation.
The Single Trend+ includes a hard exit based on a MACD - settings are flexible and you may update them.
Having a stop-loss protecting your trade is a best practice - Protecting your stop-loss also from getting hit is incredible.
We prefer invalidate a few positions, even if sometimes we don't want to. Rather than the market hard exiting on us, and leaving with our hard-working money.
4.7 Alerts
Alerts are enabled for:
- BUY/SELL triangles signals
- Trade Manager (SL, TP1, TP2)
- Hard Exits
V. Pain points that we're trying to solve with our Algorithm Builders
Issue #1 There are many informations / indicators / strategies / backtests / noise. Finding the right ones is not a simple task.
Solution #1 A reliable system that removes the external noise is much needed in trading to stay "in the game".
Issue #2 Trading could be quite stressful - The majority doesn't lose in trading because technical analysis is hard, but because managing our psychology is one of the hardest things a human can do.
Solution #2 Some ways to reduce the "trading stress" could be: getting better quality signals and trading like a "machine". Forgetting about Twitter and trusting the system you designed.
Issue #3 Trading without strict rules and only based on what we feel, or what we think the market should do is the fastest way to kiss our money goodbye.
Only 1 indicator generally is not enough. Traders generally use a combination of several indicators but they're monitoring them individually.
It's normal then to feel exhausted at the end of the day ^^ (to say the least)... and exhaustion leads to mistakes which leads to..... (I'm sure you got it) ... capital loss.
Solution #3 As a trader, I needed a trading framework and a method. I offer our trading method but they're plenty others out there. We cannot claim obviously it's the best ever ....but let's say we're using those exact same
scripts ourselves for our trading. And this what we've been recommending our clients to trade with for the past years. Also, having a tool detecting the convergence of several indicators and giving 1 unique signal
for BUY/SELL position will save you a lot of time/energy, and perhaps might help you out getting better trading performance.
VI. Resolving a complex puzzle and having fun in the process
Trading has to stay a passion and not (only be) a source of intense stress.
The most successful traders I know are "trading geeks" - literally always looking for optimizing, searching for the best possible entries, setups, indicators, tools, etc.
For them, it's not even about the money anymore, but only about beating their previous performance.
Why are they doing this? Because it's fun
Might appears as a bold statement, but I guarantee that looking for setups is fun.
One of our users even told us, that it's like playing with "Legos" and we couldn't possibly agree more.
VII. Designing a system that "makes sense"
Another bold statement now. Brace yourselves ladies and gentlemen
The Algorithm Builders allow to design trading systems quickly. What could takes days/weeks/months to find out... might be now within your reach in less than a few hours.
With a bit of practice, less than an hour might be enough per asset/timeframe to find a system that makes sense to you and adapted to your trading capital and psychology.
Assuming our users read our guides and are fully committed to learning a new way of trading - then we do guarantee you'll be able to design kick-ass trading systems that make sense.
"Making sense" doesn't mean at all it's guaranteed to win, it means you're the one defining the convergence of indicators, using your Algorithm Builder, and observe that most of the time - whenever there is a BUY signal, the candlesticks are going upwards - whenever there is a SELL signal, it's going downwards.
This is a necessary step to make real progress from a trading analyst perspective - and hopefully could lead to profits.
VII. Algorithm Builder versus the main trader enemy(=psychology)
This indicator has the goal to help solving one of the MAIN issues encountered by traders.
Most of traders realize, they can't perform with only 1 indicator (or 1 price pattern or 1 price action) and need a combination of multiple indicators before getting in a trade.
Far from being a magic pill, if it could at least reduce the stress you have while trading, then we'll consider we made a great job - it's a technical "useless noise remover", and needs to be followed strictly.
Such trust in a trading system can only be built by testing your Algorithm Builder configuration on either:
1. a demo account
2. or a live account with small bids. And then, increasing progressively the bids if your capital increases progressively.
Though, you should still use your common sense. (for instance: if we get a BUY signal right on a big timeframe resistance we're hitting for the first time).
I'm aware this is a new way of trading but for many, and while we cannot foresee the future, neither predict performance, we believe it might save you a lot of time to find good signals.
My maximum level of happiness will be reached the day when our users will contact me and showing me setups being mine.
I'm sure that even I can learn from my users and, we can all learn from each other Algorithm Builder configuration
VIII. What is a wrong or bad configuration?
Simply put. If you see that most of your signals react such as described below:
1. a buy triangle predicts, most of the time an upwards move
2. a sell triangle predicts, most of the time a downwards move
3. you estimated yourself the stop-loss needed to give enough room for your trades.
4. take profits based on algorithmic support and resistances or your own take profit method.
So what's a good Algorithm Builder configuration? A configuration you're happy with and makes sense.
A better Algorithm Builder setup is one used in demo or a live account w/ small bids for a few weeks, and you're consistent in your trading performance.
If you have any doubt or question, please hit me up directly or ask in the comments section of this script.
I'll never claim I have the best trading methodology or the best indicators. You only will be the judge, and I'll appreciate all the questions and feedback you're sending my way.
They help me a ton to develop indicators based on all the requests I received.
Kind regards,
Dave
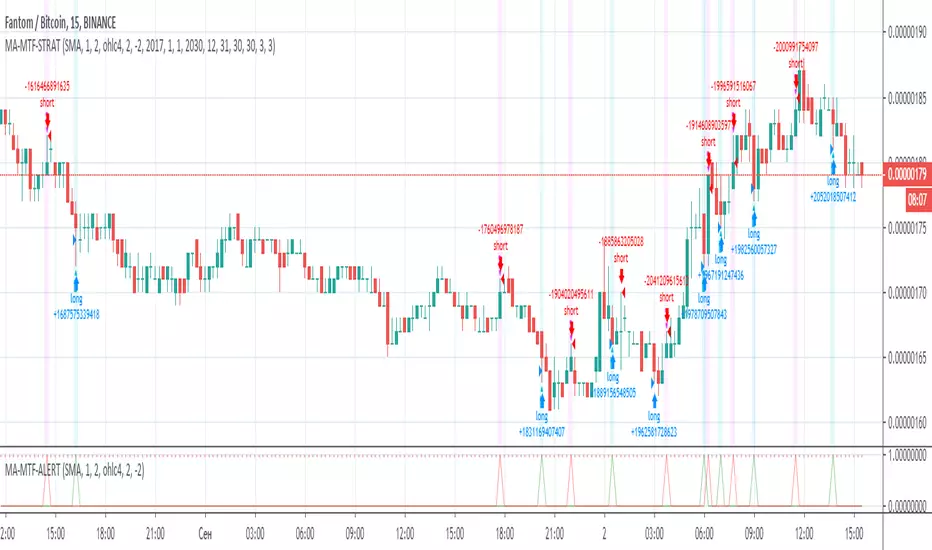
MA-MTF-ALERT// Alerts based on SMA strategy
// Time frame 5M, 10M, 15M
// Created and based on Binance chart
// Working with comission
// No repaints
Kairos [Signals]Kairos bot looks for the opportune time to buy low and sell high at targets
It provides signals to open and close trades, and indicates favorable positions for a stop loss and profit taking
The Kairos bot can be used on any chart and on any time frame
---BACKTESTER---
Using the backtester script the user can look at a chart's history between selected dates to find optimal bot settings and optimal time frames
The backtester is based on general percentages for profit taking as indicated below:
-------------T1 T2 T3 T4 T5 T6 CLOSE
1 Target: 50% 50%
2 Targets: 50% 25% 25%
3 Targets: 40% 30% 20% 10%
4 Targets: 40% 25% 20% 10% 5%
5 Targets: 35% 25% 20% 10% 5% 5%
6 Targets: 30% 25% 20% 10% 5% 5% 5%
ie: If 2 targets are selected:
- 50% of investment will be taken at target 1
- 25% of investment will be taken at target 2
- and the remainder 25% will be taken when the trade is closed on a close signal
However, it is up to the user's own risk appetite to determine where and how much profit to take
Note that the backtester does not have any on screen indicators other than OPEN and CLOSE, however profit taking can be indicated by ticking the Style -> Trades on Chart tick box on the settings userform
---SIGNALS---
The signals script can be used for automation and can indicate up to 6 potential Profit Targets, as well as a Stop Loss based on how many bars back needs to be taken into consideration
The signals (Open/Close) can be automated using TradingView alerts, however the Stop Loss and Profit Taking are only indicators and are for the users own interpretation
The user does not have to place a Stop Loss or take profit at the Targets if so wished, the bot can be used to simply buy on an OPEN signal and sell on a CLOSE signal, however, the backtester will indicate that it is far more profitable to take profits.
It is advised to take profits just below indicated Targets as these are potentially high selling zones and price action can sometimes turn down just short of these targets.
---INVITE-ONLY SCRIPT---
This is an invite-only script, so if you would like to try out Kairos Bot, send me a message

Two MM Cross (Signal version)Hi everyone
This is a dummy two MM cross script to be used for the Trade Manager
I'll publish a video explaining how to use the Trade Manager as I received many questions.
This was my fault for not being clear enough. A video will do great wonders here
Dave


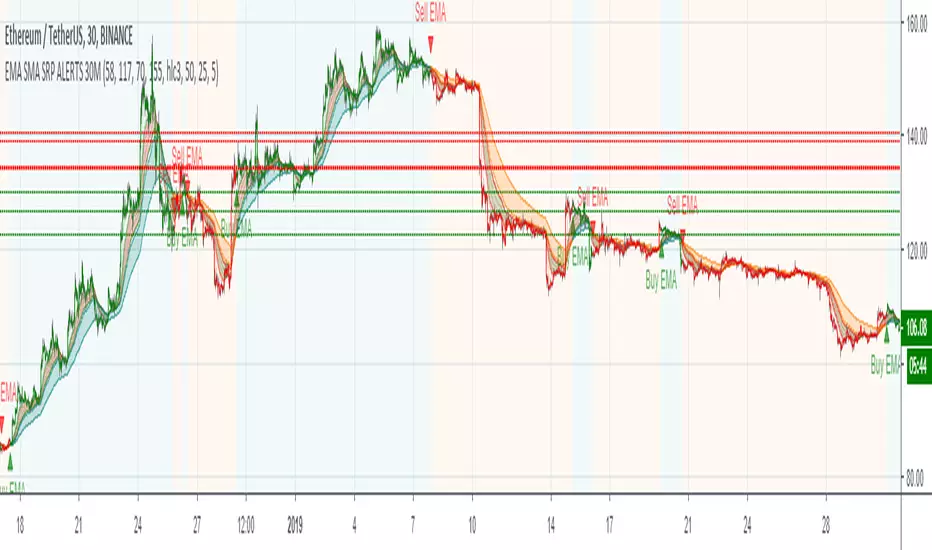
EMA SMA SRP ALERTS 30MThe Alerts is based on indicators:
Exponential Moving Average ( EMA )
Simple Moving Average ( SMA )
Support and Resistance Levels
Allows to find entry/exit points
Adapted for:
Chart: 30 minutes
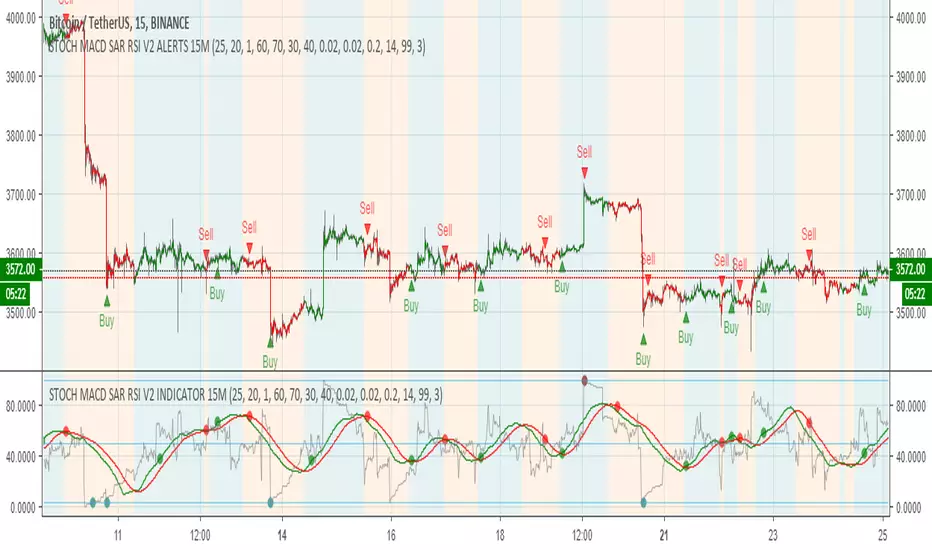
STOCH MACD SAR RSI V2 INDICATOR 15M// Indicator based on Oscillators such as Stochastic ( STOCH ), Moving Average Convergence/Divergence ( MACD ),
// Parabolic Stop and Reverse (PSAR) and Relative Strength Index ( RSI )
// Adapted for 15M time frame on Binance chart
// Working with comission
// No repaints
STOCH MACD SAR RSI V2 ALERTS 15M// Alerts based on Stochastic Oscillator ( STOCH ), Moving Average Convergence / Divergence ( MACD) , Parabolic Stop and Reverse (PSAR) and Relative Strength Index (RSI)
// In the second version RSI added
// Adapted for15M time frame
// Created and based on Binance chart
// Working with comission
// No repaints
