Smooth Moving Average (SMA) MTF Trend PanelDescription:
The SMA MTF Trend Panel is a multi-timeframe (MTF) trend visualization tool designed to help traders quickly assess market conditions across multiple timeframes based on the Simple Moving Average (SMA). This script calculates the trend direction (Bullish, Bearish, or Neutral) and the trend strength percentage for each selected timeframe. It displays the information in an intuitive panel that is dynamically updated in real-time.
How It Works:
1. SMA Calculation:
• For each timeframe, the script calculates the SMA based on a user-defined length (default: 50).
2. Trend Identification:
• Compares the current price to the SMA and assigns a label: “Bull,” “Bear,” or “Neutral.”
3. Panel Display:
• Displays trends, strengths, and shifts for each timeframe in an interactive table.
4. Real-Time Updates:
• Continuously monitors price movements and updates the panel to reflect the latest data.
Customizable Inputs:
1. Panel Settings:
• Orientation: Choose vertical or horizontal layout.
• Position: Select panel location on the chart.
• Border Width/Color: Adjust panel borders for better visualization.
2. Trend Colors:
• Define custom colors for bullish, bearish, neutral, and shift conditions.
3. SMA Length:
• Adjust the SMA period to suit your trading style (e.g., short-term scalping or long-term trend following).
4. Timeframes:
• Set specific timeframes to analyze based on your trading strategy.
Media mobile semplice (SMA)

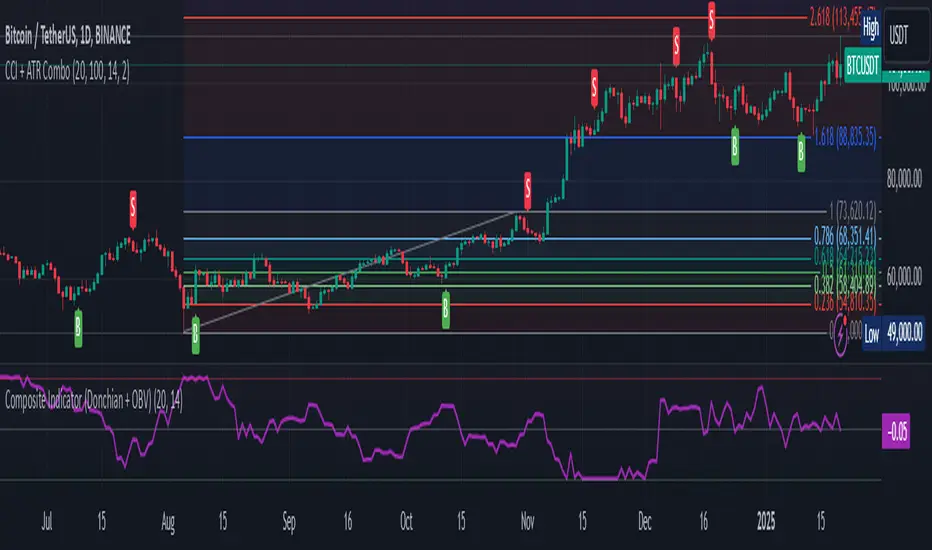
Composite Indicator (CCI + ATR)Composite Indicator (CCI + ATR)
The Composite Indicator (CCI + ATR) combines the Commodity Channel Index (CCI) with the Average True Range (ATR) , providing traders with a dynamic tool for identifying entry and exit points based on momentum and volatility. This indicator is particularly useful for markets like cryptocurrencies, which often exhibit sharp sell-offs and gradual upward trends.
Key Features
Momentum Analysis with CCI: The CCI calculates price momentum by comparing the current price level to its average over a specific period. The indicator generates signals when CCI crosses predefined thresholds.
- Buy Signal: Triggered when CCI crosses above the lower threshold (e.g., -100).
- Sell Signal: Triggered when CCI crosses below the upper threshold (e.g., +100).
Volatility Filtering with ATR: The ATR measures market volatility, ensuring signals occur only during significant price movements.
Separate multipliers for buy and sell signals allow tailored filtering based on market behavior.
Stop Loss Calculation: Dynamic stop loss levels are calculated using the ATR multiplier to adapt to market volatility, offering better risk management.
How It Works
CCI Calculation: The CCI is calculated using the typical price ((High + Low + Close) / 3) and a user-defined length. It detects momentum changes by measuring deviations from the average price.
ATR Calculation: The ATR determines the average price range over a specified period, identifying the market’s volatility. The ATR SMA acts as a baseline to filter signals.
Buy Signal: A buy signal is triggered when:
- CCI crosses above the lower threshold (e.g., -100).
- ATR exceeds its SMA multiplied by the buy multiplier (e.g., 1.0).
Sell Signal: A sell signal is triggered when:
- CCI crosses below the upper threshold (e.g., +100).
- ATR exceeds its SMA multiplied by the sell multiplier (e.g., 0.95).
Stop Loss Integration:
- Long positions: Stop loss = Low – (ATR * ATR Multiplier)
- Short positions: Stop loss = High + (ATR * ATR Multiplier)
Advantages
Combines momentum (CCI) and volatility (ATR) for precise signal generation.
Customizable thresholds and multipliers for different market conditions.
Dynamic stop loss ensures better risk management in volatile markets.
Suggested Parameter Settings
CCI Length: 20 (default). Adjust as follows:
- 10–15: Shorter timeframes (e.g., 5-15 minutes).
- 20: General use for 1-hour timeframes.
- 30–50: Longer timeframes (e.g., 4-hour or daily charts).
CCI Threshold: 100 (default). Adjust as follows:
- 50–75: For more frequent signals in ranging markets.
- 100: Balanced for most trading conditions.
- 150–200: For strong trends to reduce noise.
ATR Length: 14 (default). Adjust as follows:
- 10–14: For assets with moderate volatility.
- 20: For assets with lower volatility.
ATR Buy Multiplier: 1.0 (default). Adjust as follows:
- 0.9–1.0: For gradual uptrends in crypto markets.
- 1.1–1.2: For stronger trend filtering.
ATR Sell Multiplier: 0.95 (default). Adjust as follows:
- 0.8–0.95: For sharp sell-offs.
- 1.0–1.1: For stable downward trends.
ATR Multiplier (Stop Loss): 1.5 (default). Adjust as follows:
- 1.0–1.2: For shorter timeframes or less volatile markets.
- 2.0–2.5: For highly volatile markets like cryptocurrencies.
Example Use Cases
Scalping (5-15 minute charts): Use CCI Length = 10, CCI Threshold = 75, ATR Buy Multiplier = 0.9, ATR Sell Multiplier = 0.8.
Day Trading (1-hour charts): Use CCI Length = 20, CCI Threshold = 100, ATR Buy Multiplier = 1.0, ATR Sell Multiplier = 0.95.
Swing Trading (4-hour or daily charts): Use CCI Length = 30, CCI Threshold = 150, ATR Buy Multiplier = 1.2, ATR Sell Multiplier = 1.0.
Final Thoughts The Composite Indicator (CCI + ATR) is a versatile tool designed to enhance trading decisions by combining momentum analysis with volatility filtering. Whether scalping or swing trading, this indicator provides actionable insights and robust risk management to navigate complex markets effectively.

Composite Indicator (Donchian + OBV)Composite Indicator (Donchian + OBV)
The Composite Indicator (Donchian + OBV) is a powerful tool designed to evaluate the strength of market breakouts and momentum trends , offering traders a comprehensive perspective on price action. This indicator combines the Donchian Channel with On-Balance Volume (OBV) to create a dynamic and easy-to-interpret metric scaled between -1 and 1 .
Key Features
Breakout Strength Analysis:
- The indicator assesses the strength of price breakouts relative to the upper and lower bounds of the Donchian Channel.
- Positive values close to 1 indicate a strong bullish breakout.
- Negative values close to -1 indicate a strong bearish breakout.
Momentum Detection with OBV:
- On-Balance Volume (OBV) tracks the cumulative buying and selling volume to gauge market momentum.
- The smoothed OBV trend ensures the momentum component aligns with price action, reducing noise.
Integrated Composite Value:
- Combines breakout strength and OBV momentum into a single metric for enhanced clarity.
- The final composite value highlights whether the market is bullish, bearish, or neutral.
Divergence Detection:
- Spot bullish divergences when the indicator rises while price falls, suggesting a potential upward reversal.
- Identify bearish divergences when the indicator falls while price rises, hinting at a potential downward reversal.
How It Works
Donchian Channel Analysis:
- Calculates the highest high and lowest low over a user-defined period to establish the upper and lower channels .
- Breakouts beyond these channels contribute to the breakout strength component.
OBV Momentum:
- Measures cumulative volume trends to validate price movements.
- Momentum is derived from the rate of change in smoothed OBV values.
Composite Calculation:
- Combines breakout strength and OBV momentum, normalized and scaled to -1 to 1 for clarity.
How to Use
Bullish Breakout:
- When the indicator value approaches 1 , it signals a strong upward breakout supported by positive OBV momentum.
- Example Action: Consider a Buy if price breaks the upper Donchian Channel with increasing OBV.
Bearish Breakout:
- When the indicator value approaches -1 , it indicates a strong downward breakout supported by negative OBV momentum.
- Example Action: Consider a Sell if price breaks the lower Donchian Channel with decreasing OBV.
Neutral Market:
- When the value is near 0 , the market is likely balanced with no significant breakout or momentum detected.
Divergence Opportunities:
- Bullish Divergence: Price makes lower lows, but the indicator trends upward → Potential upward reversal.
- Bearish Divergence: Price makes higher highs, but the indicator trends downward → Potential downward reversal.
Customization Options
Donchian Channel Length: Adjust the period for the upper and lower bounds.
OBV Smoothing Length: Modify the smoothing period for OBV to fine-tune momentum detection.
Scaling Adjustments: The composite value is automatically normalized for consistency across timeframes.
Ideal Use Cases
Breakout Trading: Identify and confirm strong breakouts in volatile markets.
Momentum Confirmation: Validate price movements with volume-based momentum.
Reversal Detection: Leverage divergences to spot potential market reversals.
Example Applications
Strong Bullish Signal:
- Price breaks the upper channel , and OBV shows increasing volume → Composite value near 1 .
- Action: Enter a Buy position and set a Stop Loss below the upper channel.
Strong Bearish Signal:
- Price breaks the lower channel , and OBV shows decreasing volume → Composite value near -1 .
- Action: Enter a Sell position and set a Stop Loss above the lower channel.
Neutral Market:
- Composite value near 0 suggests indecision or consolidation. Wait for a breakout.
Limitations
Best used alongside additional tools like RSI or MACD for filtering noise and improving decision-making.
Requires careful parameter tuning based on the asset and timeframe.
Final Thoughts
The Composite Indicator (Donchian + OBV) offers traders a versatile tool to navigate complex markets. By blending breakout analysis with volume-based momentum, this indicator provides an actionable edge for identifying high-probability opportunities and potential reversals.
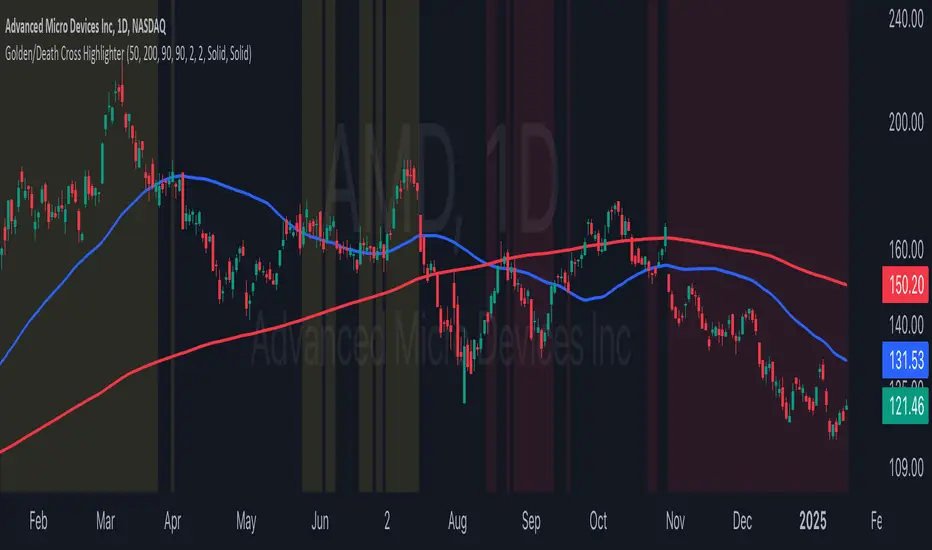
Golden/Death Cross HighlighterThis indicator helps you easily identify and visualize Golden Cross and Death Cross patterns combined with price action confirmation. It highlights chart backgrounds when specific conditions are met, making it easy to spot potential trend changes.
🔑 Key Features:
Highlights Golden Cross conditions (50 SMA crosses above 200 SMA) when price closes above both MAs
Highlights Death Cross conditions (50 SMA crosses below 200 SMA) when price closes below both MAs
Customizable MA lengths (default: 50 and 200)
Adjustable highlight opacity
Built-in alerts for cross events
Clear visualization of both moving averages
📈 Color Guide:
Yellow Background: Golden Cross active + price above both MAs
Red Background: Death Cross active + price below both MAs
⚙️ Settings:
Fast MA Length: Length of faster moving average (default 50)
Slow MA Length: Length of slower moving average (default 200)
Golden Cross Highlight Opacity: Adjust visibility of bullish highlights
Death Cross Highlight Opacity: Adjust visibility of bearish highlights
💡 Usage Tips:
Use in combination with other indicators for confirmation
Set up alerts for potential trend changes
Adjust opacity to match your chart style
Works best on higher timeframes (4H, Daily, Weekly)
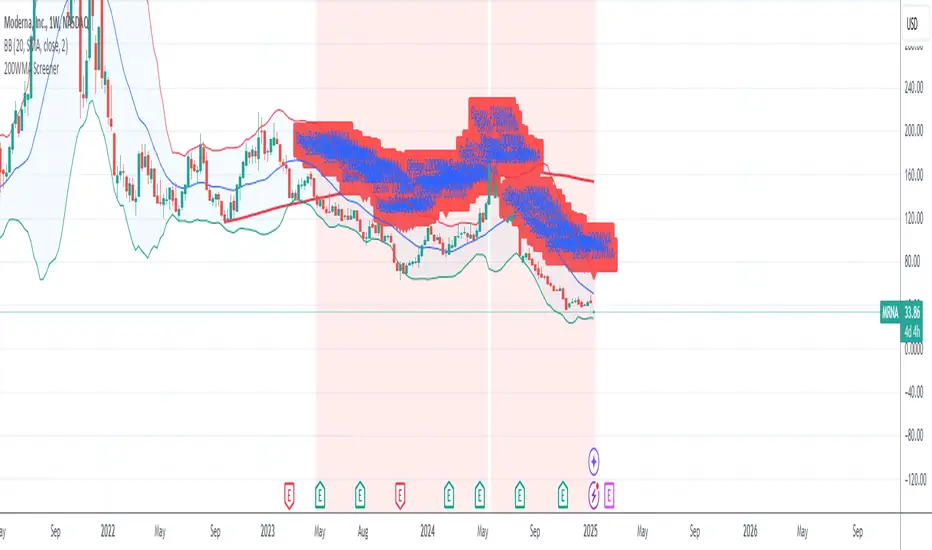
200WMA ScreenerDescription:
This custom indicator helps identify stocks trading below their 200-week moving average (200WMA), a key technical indicator often used to analyze long-term trends. The script calculates the 200WMA using weekly close prices and provides the following features:
Visual Plot: Displays the 200WMA as a smooth line on the chart for easy trend analysis.
Background Highlight: Automatically highlights the chart background when the current price is below the 200WMA, signaling a potential bearish trend or undervalued stock.
Alert System: Includes an alert condition to notify you when a stock trades below its 200WMA, so you never miss an opportunity.
Compatibility: Works across all assets (stocks, forex, crypto) and automatically adapts to the selected ticker.
This script is ideal for traders and investors looking for long-term opportunities, identifying potential trend reversals, or spotting undervalued stocks.
2 MA Simplified Sideways Candle ColorsHow to Use the Indicator: A Simple Guide
This custom indicator colors candlesticks to help you quickly identify market conditions based on two moving averages (9-period and 21-period). Here’s how to get started:
Add the Indicator to Your Chart:
Copy the provided Pine Script code.
Open TradingView and navigate to the Pine Editor.
Paste the code into a new script, save it, and then add the indicator to your chart.
Understand the Candlestick Colors:
Green Candles (Bullish):
Indicates a bullish market when the price is above the 9-period SMA and the 9 SMA is above the 21 SMA.
Red Candles (Bearish):
Indicates a bearish market when the price is below the 21-period SMA and the 9 SMA is below the 21 SMA.
Yellow Candles (Sideways):
Indicates a sideways (neutral) market when:
Condition 1: Price is below the 9 SMA but above the 21 SMA, with the 9 SMA above the 21 SMA, or
Condition 2: The 9 SMA is below the 21 SMA, and the price lies between them.
White Candles (No Clear Signal):
Used when none of the above conditions apply.
Interpreting the Signals:
When you see green candles, the market is showing bullish momentum.
When you see red candles, bearish pressure is dominant.
Yellow candles suggest the market is moving sideways without a strong trend.
White candles mean that none of the specific conditions (bullish, bearish, or sideways) are currently met.
Chart Reference:
The script also plots two moving averages on your chart (a blue line for the 9-period SMA and an orange line for the 21-period SMA). These lines help visualize how price interacts with these averages.
Using the Indicator in Practice:
Once added to your chart, monitor the color of the candlesticks:
Green signals may be opportunities to consider long positions.
Red signals may indicate a good time to consider short positions or tighten stops.
Yellow signals suggest caution as the market isn’t trending strongly.
White candles indicate no strong signal, so it might be a period of consolidation or indecision.
This simple visual cue system allows you to quickly assess market sentiment and make more informed trading decisions based on the relationship between price and the two moving averages.

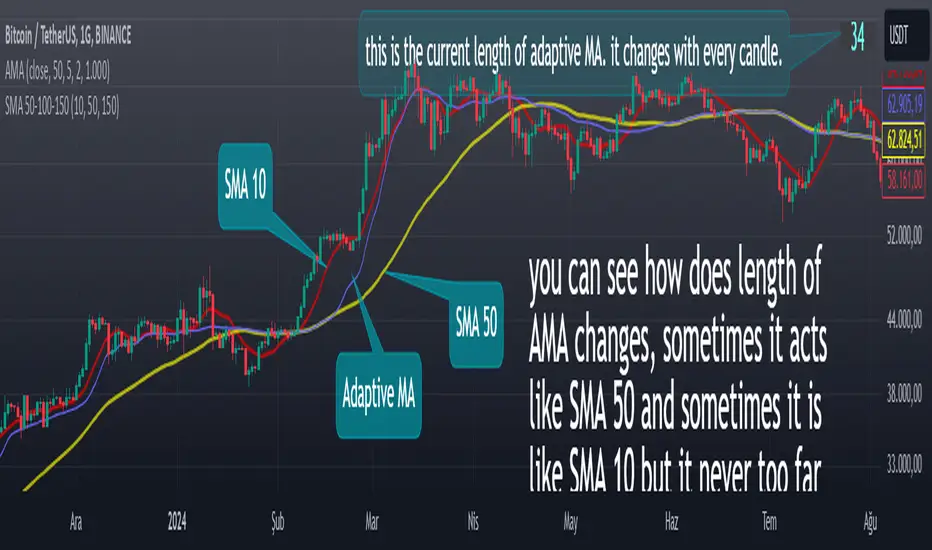
Adaptive Moving Averagewhat is the purpose of the indicator?
When short-length moving averages are used as trailing stops, they cause exiting the trade too early. Keeping the length value too high will result in exiting the transaction too late and losing most of the profits earned. I aimed to prevent this problem with this indicator.
what is "Adaptive Moving Average"?
it is a moving average that can change its length on each candle depending on the selected source.
what it does?
The indicator first finds the average lengths of the existing candles and defines different distances accordingly. When the moving average drawn by the indicator enters the area defined as "far" by the indicator, the indicator reduces the length of the moving average, preventing it from moving too far from the price, and continues to do so at different rates until the moving average gets close enough to the price. If the moving average gets close enough to the price, it starts to increase the length of the average and thus the adaptation continues.
how it does it?
Since the change of each trading pair is different in percentage terms, I chose to base the average height of the candles instead of using constant percentage values to define the concept of "far". While doing this, I used a weighted moving average so that the system could quickly adapt to the latest changes (you can see it on line 17). After calculating what percentage of the moving average this value is, I caused the length of the moving average to change in each bar depending on the multiples of this percentage value that the price moved away from the average (look at line 20, 21 and 22). Finally, I created a new moving average using this new length value I obtained.
how to use it?
Although the indicator chooses its own length, we have some inputs to customize it. First of all, we can choose which source we will use the moving average on. The "source" input allows us to use it with other indicators.
"max length" and "min length" determine the maximum and minimum value that the length of the moving average can take.
Apart from this, there are options for you to add a standard moving average to the chart so that you can compare the adaptive moving average, and bollinger band channels that you can use to create different strategies.
This indicator was developed due to the need for a more sophisticated trailing stop, but once you understand how it works, it is completely up to you to combine it with other indicators and create different strategies.
BS | Buy&Sell Signals With EMAKey Features:
EMA Intersections: Generates clear buy and sell signals based on predefined EMA crossings.
5 EMA Lines: Visualize market trends with five distinct EMA lines plotted on the chart.
Support and Resistance Levels: Easily identify crucial support and resistance levels with our integrated marker.
Comprehensive Indicator Panel: At the bottom of the chart, track Stochastic, RSI, Supertrend, and SMA across multiple timeframes (1m, 5m, 15m, 1H, 4H, Daily, Weekly).
Fully Customizable: Almost every indicator within the tool is adjustable to suit your preferences and trading style.
Alarm Feature: Set up alarms to stay informed of important market movements.
Unlock the full potential of your trading strategy with BS | Buy&Sell Signals With EMA. Customize, analyze, and trade with confidence.
created by @bahadirsezer

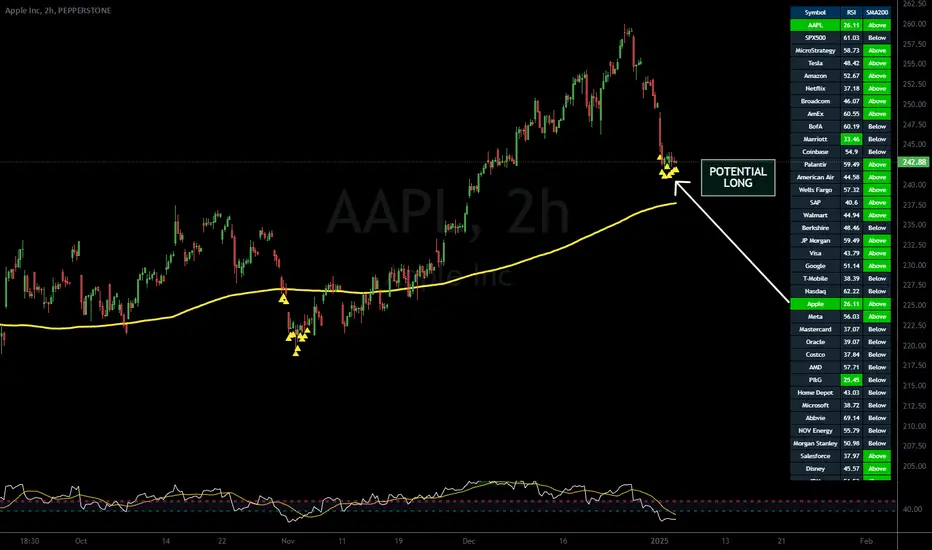
Stock Scanner - 38 AssetsPullback Scanner and Trading Strategy:
The Scanner's Purpose:
This tool helps identify stocks and futures from a set-list that are in a strong uptrend (above 200 SMA) but experiencing a temporary pullback (RSI below 38), creating potential buying opportunities.
Load 38 Favourite Stocks. They need to be bullish ie: Trading usually above 200 SMA. A drop down switch lets you choose which group. You can find suitable stocks using the filter at FINVIZ:
use on 4hr Timeframes and Above
You must use this on at least the 4hr timeframe, otherwise the 200SMA is not truly placed correctly and a valid trade depends upon the price action being ABOVE the 200SMA.
finviz.com
Key Components:
200 Simple Moving Average (SMA)
Acts as a trend filter
Price above 200 SMA indicates a long-term uptrend
Helps avoid trading against the main trend
Relative Strength Index (RSI)
Set to 38 as the oversold threshold
Identifies temporary weakness in strong trends
Acts as the pullback confirmation. You could add an RSI indicator to the chart for monitoring.
Visual Signals:
Green row: Indicates both conditions are met (price > 200 SMA and RSI < 38)
Yellow triangle: Appears at price bottom when RSI drops below 38
Yellow 200 SMA line: Shows the trend direction and potential support
Trade Setup:
First Requirement: Price must be trading above the 200 SMA
Second Requirement: Wait for RSI to drop below 38
Entry Trigger: When both conditions align (row turns green)
Risk Management: Set stop loss below recent swing low
Exit: When RSI moves above 53 or price crosses below 200 SMA
The scanner monitors multiple instruments simultaneously, allowing traders to identify setups across different markets without manually checking each chart. When a row turns green, that instrument deserves closer attention for potential trade setup.
Example Trade:
Looking at the chart of Apple (AAPL), the yellow triangles show where RSI dropped below 38 while price remained above the rising 200 SMA, providing multiple long entry opportunities in an established uptrend. Actually Apple may be better with RSI below 26.
If you use ctrader, I have made a cbot version of this to automatically take trades on the ctrader platform: eg: XAUUSD i.postimg.cc
Enhanced SMA Signal Box With TargetsEnhanced SMA Signal Box With Targets
The Enhanced SMA Signal Box With Targets indicator is a versatile tool designed to help traders identify buy and sell signals based on various technical analysis methods, including Simple Moving Averages (SMA), Exponential Moving Averages (EMA), and Average True Range (ATR). This indicator provides clear visual signals and target levels to assist traders in making informed decisions.
Key Features
Simple Moving Averages (SMA):
20 SMA: Represents short-term price trends.
50 SMA: Represents long-term price trends.
Exponential Moving Average (EMA):
50 EMA: Adds additional trend confirmation to the SMA.
Signal Visualization:
Buy Signals: Displayed with a green "🚀" emoji below the candle when the closing price crosses above the 20 SMA.
Sell Signals: Displayed with a red "💣" emoji above the candle when the closing price crosses below the 20 SMA.
Yellow Box: Highlights the signal candle, making it easy to identify the most recent and historical signals.
Target Prices:
First Target: Based on the size of the signal candle.
Second and Third Targets: Calculated using the ATR multiplied by a user-defined factor to help set profit-taking levels.
Customizable Filters:
MACD Filter: Users can enable this filter to use MACD line crossings for signal confirmation.
Higher Timeframe SMA Filter: Users can set a higher timeframe SMA to filter signals based on the long-term trend.
Volume Filter: Users can set a minimum volume threshold for signals.
Alerts:
Users can enable alerts for buy and sell signals, ensuring they never miss a trading opportunity.
Customizable Settings:
Line Colors and Thickness: Users can adjust the colors and thickness of the SMAs, EMA, and signal boxes.
Signal Emojis: Users can choose custom emojis for buy and sell signals.
How It Works
Trend Calculation: The indicator calculates short-term and long-term trends using the 20 SMA, 50 SMA, and 50 EMA.
Signal Generation: Buy and sell signals are generated when the price crosses the 20 SMA, with optional confirmation from MACD and volume filters.
Target Calculation: Profit targets are based on the size of the signal candle and ATR, helping traders set realistic profit-taking levels.
Important Notice
This indicator is designed for educational purposes and should not be considered as financial advice. Past performance does not guarantee future results. Users should conduct their own research and analysis before making any trading decisions. Trading involves substantial risk and is not suitable for every investor. Always consider your financial situation, investment objectives, and risk tolerance before trading. Please ensure you comply with all the relevant regulations and TradingView's house rules while using this indicator.

Bitcoin Pi Cycle TrackerThe Bitcoin Pi Cycle Tracker is based on the widely recognized Pi Cycle Top Indicator, a concept used to identify potential market cycle tops in Bitcoin's price. This implementation combines the 111-day Simple Moving Average (SMA) and the 350-day SMA (multiplied by 2) to detect key crossover points. When the 111-day SMA crosses above the 350-day SMA x2, it signals a potential market peak.
Key Features:
Plots the 111-day SMA (blue) and the 350-day SMA x2 (red) for clear visualization.
Displays visual markers and vertical lines at crossover points to highlight key moments.
Sends alerts for crossovers, helping traders stay ahead of market movements.
This tool is an implementation of the Pi Cycle concept originally popularized by Bitcoin market analysts. Use it to analyze historical price cycles and prepare for significant market events. Please note that while the Pi Cycle Indicator has been historically effective, it should be used alongside other tools for a comprehensive trading strategy.

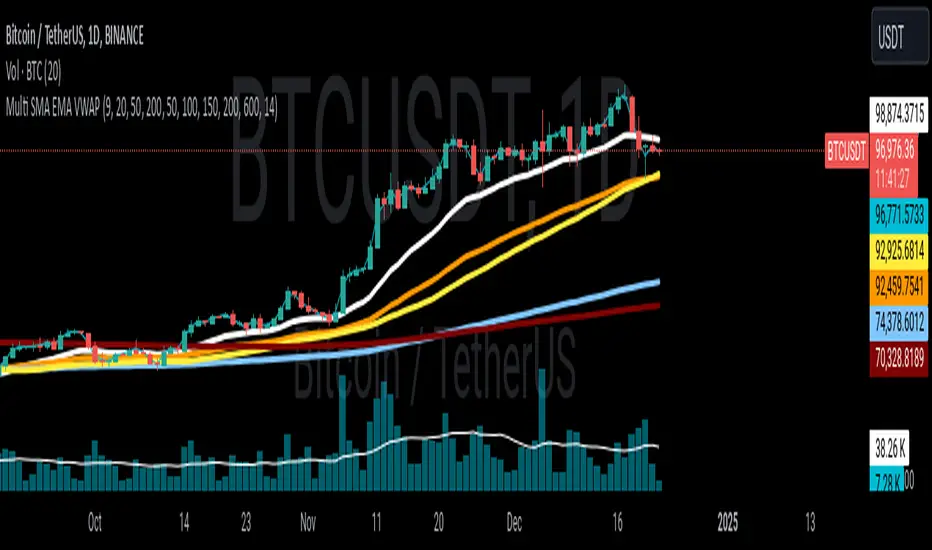
Multi SMA EMA VWAP1. Moving Average Crossover
This is one of the most common strategies with moving averages, and it involves observing crossovers between EMAs and SMAs to determine buy or sell signals.
Buy signal: When a faster EMA (like a short-term EMA) crosses above a slower SMA, it can indicate a potential upward movement.
Sell signal: When a faster EMA crosses below a slower SMA, it can indicate a potential downward movement.
With 4 EMAs and 5 SMAs, you can set up crossovers between different combinations, such as:
EMA(9) crosses above SMA(50) → buy.
EMA(9) crosses below SMA(50) → sell.
2. Divergence Confirmation Between EMAs and SMAs
Divergence between the EMAs and SMAs can offer additional confirmation. If the EMAs are pointing in one direction and the SMAs are still in the opposite direction, it is a sign that the movement could be stronger and continue in the same direction.
Positive divergence: If the EMAs are making new highs while the SMAs are still below, it could be a sign that the market is in a strong trend.
Negative divergence: If the EMAs are making new lows and the SMAs are still above, you might consider that the market is in a downtrend or correction.
3. Using EMAs as Dynamic Support and Resistance
EMAs can act as dynamic support and resistance in strong trends. If the price approaches a faster EMA from above and doesn’t break it, it could be a good entry point for a long position (buy). If the price approaches a slower EMA from below and doesn't break it, it could be a good point to sell (short).
Buy: If the price is above all EMAs and approaches the fastest EMA (e.g., EMA(9)), it could be a good buy point if the price bounces upward.
Sell: If the price is below all EMAs and approaches the fastest EMA, it could be a good sell point if the price bounces downward.
4. Combining SMAs and EMAs to Filter Signals
SMAs can serve as a trend filter to avoid trading in sideways markets. For example:
Bullish trend condition: If the longer-term SMAs (such as SMA(100) or SMA(200)) are below the price, and the shorter EMAs are aligned upward, you can look for buy signals.
Bearish trend condition: If the longer-term SMAs are above the price and the shorter EMAs are aligned downward, you can look for sell signals.
5. Consolidation Zone Between EMAs and SMAs
When the price moves between EMAs and SMAs without a clear trend (consolidation zone), you can expect a breakout. In this case, you can use the EMAs and SMAs to identify the direction of the breakout:
If the price is in a narrow range between the EMAs and SMAs and then breaks above the fastest EMA, it’s a sign that an upward trend may begin.
If the price breaks below the fastest EMA, it could indicate a potential downward trend.
6. "Golden Cross" and "Death Cross" Strategy
These are classic strategies based on crossovers between moving averages of different periods.
Golden Cross: Occurs when a faster EMA (e.g., EMA(50)) crosses above a slower SMA (e.g., SMA(200)), which suggests a potential bullish trend.
Death Cross: Occurs when a faster EMA crosses below a slower SMA, which suggests a potential bearish trend.
Additional Recommendations:
Combining with other indicators: You can combine EMA and SMA signals with other indicators like the RSI (Relative Strength Index) or MACD (Moving Average Convergence/Divergence) for confirmation and to avoid false signals.
Risk management: Always use stop-loss and take-profit orders to protect your capital. Moving averages are trend-following indicators but don’t guarantee that the price will move in the same direction.
Timeframe analysis: It’s recommended to use different timeframes to confirm the trend (e.g., use EMAs on hourly charts along with SMAs on daily charts).
VWAP
1. VWAP + EMAs for Trend Confirmation
VWAP can act as a trend filter, confirming the direction provided by the EMAs.
Buy Signal: If the price is above the VWAP and the EMAs are aligned in an uptrend (e.g., short-term EMAs are above longer-term EMAs), this indicates that the trend is bullish and you can look for buy opportunities.
Sell Signal: If the price is below the VWAP and the EMAs are aligned in a downtrend (e.g., short-term EMAs are below longer-term EMAs), this suggests a bearish trend and you can look for sell opportunities.
In this case, VWAP is used to confirm the overall trend. For example:
Bullish: Price above VWAP, EMAs aligned to the upside (e.g., EMA(9) > EMA(50) > EMA(200)), buy.
Bearish: Price below VWAP, EMAs aligned to the downside (e.g., EMA(9) < EMA(50) < EMA(200)), sell.
2. VWAP as Dynamic Support and Resistance
VWAP can act as a dynamic support or resistance level during the day. Combining this with EMAs and SMAs helps you refine your entry and exit points.
Support: If the price is above VWAP and starts pulling back to VWAP, it could act as support. If the price bounces off the VWAP and aligns with bullish EMAs (e.g., EMA(9) crossing above EMA(50)), you can consider entering a buy position.
Resistance: If the price is below VWAP and approaches VWAP from below, it can act as resistance. If the price fails to break through VWAP and aligns with bearish EMAs (e.g., EMA(9) crossing below EMA(50)), it could be a good signal for a sell.
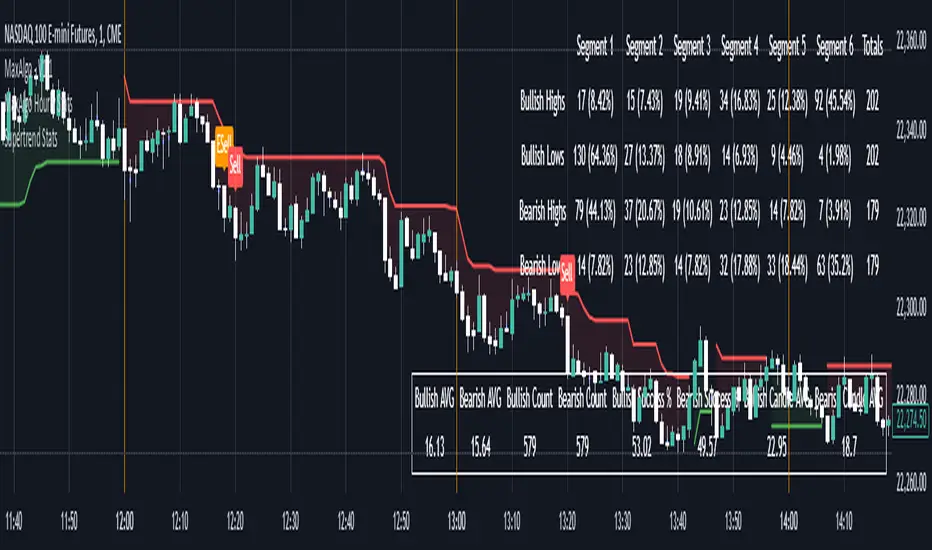
Supertrend StatsSupertrend with Probabilistic Stats and MA Filter
Overview: The Supertrend with Probabilistic Stats and MA Filter is a comprehensive TradingView Pine Script indicator designed to enhance trading strategies by combining the trend-detection capabilities of the Supertrend indicator with the trend-confirmation strength of Moving Averages (MA). Additionally, it offers robust statistical tracking to provide traders with valuable insights into the performance and reliability of their trading signals.
Key Features:
Supertrend Indicator Integration:
Trend Detection: Utilizes the Supertrend algorithm to identify prevailing market trends.
Buy/Sell Signals: Generates clear buy and sell signals based on trend reversals.
Customizable Parameters: Allows adjustment of ATR period and multiplier to suit different trading styles and market conditions.
Visual Aids: Plots Supertrend lines on the chart and highlights trend areas for easy visualization.
Moving Average (MA) Filter:
Trend Confirmation: Filters buy signals to occur only when the open price is above the MA and sell signals only when the open price is below the MA.
Customizable MA Types: Supports various MA types, including SMA, EMA, SMMA (RMA), WMA, and VWMA.
Flexible Configuration: Offers options to enable/disable the MA filter, select MA type, set MA length, and adjust MA source and offset.
Statistical Tracking:
Trimmed Mean Calculation: Computes trimmed means for bullish and bearish movements, removing outliers to provide a more accurate average movement.
Success Rate Metrics: Calculates the success rates (%) for both bullish and bearish signals, indicating the percentage of signals that resulted in favorable price movements.
Candle Count Analysis: Tracks the average number of candles each bullish and bearish move lasts, offering insights into the duration of trends.
Data Visualization: Presents all statistical data in a neatly formatted table on the chart, allowing for quick reference and analysis.
Customizable Statistics Table:
Text Color Customization: Provides an option to change the table text color to match personal preferences or chart aesthetics, enhancing readability.
Comprehensive Metrics: Displays key statistics such as Bullish/Bearish Averages, Counts, Success Rates, and Average Candle Counts.
Optional Pinbar Filtering:
Signal Refinement: Adds an additional layer of signal confirmation by filtering buy and sell signals based on pinbar candlestick patterns.
Adjustable Thresholds: Allows customization of the pinbar wick threshold to fine-tune signal accuracy.
Visual Enhancements:
Markers: Optionally displays markers on the first and last candles of bullish and bearish moves for better trend identification.
Highlighter: Shades the chart background to indicate current trend direction, aiding in visual trend recognition.
How It Works:
Trend Identification with Supertrend:
The indicator calculates the Supertrend based on user-defined ATR periods and multipliers.
It plots the Supertrend lines and generates buy/sell signals when the price crosses these lines, indicating a potential trend reversal.
Filtering Signals with Moving Average:
When the MA filter is enabled, the indicator ensures that buy signals are only considered valid if the candle's open price is above the selected MA, and sell signals only if the open price is below the MA.
This additional confirmation aligns trades with the broader market trend, potentially increasing signal reliability.
Statistical Analysis:
Upon triggering a buy or sell signal, the indicator records the entry price and tracks the subsequent price movements.
It calculates trimmed means to assess average movements while excluding extreme outliers.
Success rates are computed by comparing the closing price against the entry price, indicating how often signals result in favorable outcomes.
The average number of candles per move provides insight into trend duration and volatility.
Visualization and Customization:
All statistical data is presented in a table on the chart, with customizable text colors for enhanced readability.
Optional pinbar filtering and visual markers further refine and illustrate trading signals, aiding in decision-making.
Benefits to Traders:
Enhanced Signal Reliability:
By combining Supertrend with an MA filter, the indicator ensures that only signals aligning with the broader market trend are considered, potentially reducing false signals.
Data-Driven Decision Making:
The comprehensive statistical tracking offers traders insights into the performance of their signals, enabling informed adjustments to their trading strategies based on empirical data.
Trend Confirmation and Alignment:
The MA filter acts as a trend confirmation tool, ensuring that trades are placed in the direction of the prevailing trend, which can enhance the probability of successful trades.
Performance Metrics at a Glance:
The statistics table provides all necessary performance metrics in a single view, allowing traders to quickly assess the effectiveness of their strategy without sifting through extensive data.
Customization and Flexibility:
With options to adjust MA types, lengths, and table text colors, traders can tailor the indicator to fit their specific preferences and trading environments.
Visual Clarity and Aids:
The plotted Supertrend lines, MA line, signal markers, and highlighter enhance visual clarity, making it easier to identify trends and potential trade opportunities on the chart.
Usage Instructions:
Adding the Indicator:
Copy the Script: Select and copy the entire Pine Script provided.
Open TradingView: Navigate to TradingView and open your desired asset's chart.
Access Pine Editor: Click on the Pine Editor tab at the bottom of the TradingView interface.
Paste and Add to Chart: Paste the script into the editor and click "Add to Chart" to apply the indicator.
Configuring Settings:
Supertrend Parameters: Adjust the ATR period and multiplier to suit your trading style and the asset's volatility.
MA Filter Settings:
Enable MA Filter: Toggle "Enable MA Filter?" to ON to activate the filter.
Select MA Type: Choose from SMA, EMA, SMMA (RMA), WMA, or VWMA.
Set MA Length: Define the period for the MA calculation.
MA Source and Offset: Choose the price source (default is close) and set any desired plot offset.
Statistical Tracking:
Trimmed Mean Percentage: Set the percentage to trim outliers in mean calculations.
Show Cross Markers: Toggle to display or hide markers on the first and last candles of bullish and bearish moves.
Table Customization:
Table Text Color: Select your preferred text color for the statistics table to match your chart's theme or enhance readability.
Pinbar Filtering (Optional):
Enable Pinbar Filtering: Toggle to refine signals based on pinbar patterns.
Set Pinbar Wick Threshold: Adjust the threshold to define the characteristics of a valid pinbar.
Interpreting the Indicators:
Buy/Sell Signals: Look for labeled "BUY" and "SELL" signals on the chart that align with Supertrend reversals and MA conditions.
Statistics Table: Refer to the table located at the bottom right of the chart to assess:
Bullish/Bearish Averages: Average price movements following signals.
Counts: Total number of bullish and bearish signals.
Success Rates (%): Percentage of signals that resulted in profitable trades.
Candle Averages: Average duration of bullish and bearish moves in terms of candle counts.
Markers and Highlighter: Utilize visual markers and shaded trend areas to better understand market trends and the context of each signal.
Making Informed Decisions:
Assess Signal Performance: Use the success rates and averages to evaluate the effectiveness of your current settings and make necessary adjustments.
Adjust Parameters: Modify Supertrend and MA parameters based on observed performance and changing market conditions to optimize signal accuracy.
Combine with Other Analysis: Integrate insights from this indicator with other technical analysis tools and fundamental factors to form a holistic trading strategy.
Conclusion: The Supertrend with Probabilistic Stats and MA Filter indicator offers a powerful combination of trend detection, signal filtering, and statistical analysis. By providing detailed performance metrics and ensuring that trades align with the broader market trend, this indicator empowers traders to make more informed, data-driven decisions. Whether you're a novice seeking clarity or an experienced trader aiming to refine your strategy, this tool serves as a valuable asset in your trading toolkit.
If you have any further questions or require additional customizations, feel free to reach out!
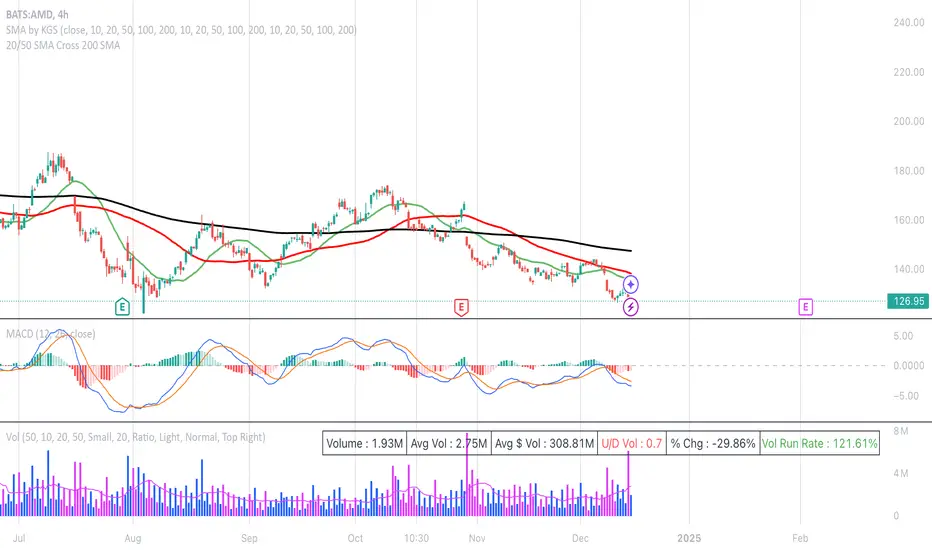
20/50 SMA Cross 200 SMAThis Pine Script code is designed to identify and visualize crossovers of two shorter-term Simple Moving Averages (SMAs), a 20-period SMA and a 50-period SMA, with a longer-term 200-period SMA on a price chart. It also includes alerts for these crossover events. Here's a breakdown:
**Purpose:**
The core idea behind this script is to detect potential trend changes. Crossovers of shorter-term moving averages over a longer-term moving average are often interpreted as bullish signals, while crossovers below are considered bearish.
**Key Components:**
1. **Moving Average Calculation:**
* `sma20 = ta.sma(close, 20)`: Calculates the 20-period SMA of the closing price.
* `sma50 = ta.sma(close, 50)`: Calculates the 50-period SMA of the closing price.
* `sma200 = ta.sma(close, 200)`: Calculates the 200-period SMA of the closing price.
2. **Crossover Detection:**
* `crossUp20 = ta.crossover(sma20, sma200)`: Returns `true` when the 20-period SMA crosses above the 200-period SMA.
* `crossDown20 = ta.crossunder(sma20, sma200)`: Returns `true` when the 20-period SMA crosses below the 200-period SMA.
* Similar logic applies for `crossUp50` and `crossDown50` with the 50-period SMA.
3. **Recent Crossover Tracking (Crucial Improvement):**
* `lookback = 7`: Defines a lookback period of 7 bars.
* `var bool hasCrossedUp20 = false`, etc.: Declares `var` (persistent) boolean variables to track if a crossover has occurred *within* the last 7 bars. This is the most important correction from previous versions.
* The logic using `ta.barssince()` is the key:
* If a crossover happens (`crossUp20` is true), the corresponding `hasCrossedUp20` is set to `true`.
* If no crossover happens on the current bar, it checks if a crossover happened within the last 7 bars using `ta.barssince(crossUp20) <= lookback`. If so, it keeps `hasCrossedUp20` as `true`. After 7 bars, it becomes `false`.
4. **Plotting Crossovers:**
* `plotshape(...)`: Plots circles on the chart to visually mark the crossovers.
* Green circles below the bars for bullish crossovers (20 and 50).
* Red circles above the bars for bearish crossovers (20 and 50).
* Different shades of green/red (green/lime, red/maroon) distinguish between 20 and 50 SMA crossovers.
5. **Plotting Moving Averages (Optional but Helpful):**
* `plot(sma20, color=color.blue, linewidth=1)`: Plots the 20-period SMA in blue.
* Similar logic for the 50-period SMA (orange) and 200-period SMA (gray).
6. **Alerts:**
* `alertcondition(...)`: Triggers alerts when crossovers occur. This is essential for real-time trading signals.
**How it Works (in Simple Terms):**
The script continuously calculates the 20, 50, and 200 SMAs. It then monitors for instances where the 20 or 50 SMA crosses the 200 SMA. When such a crossover happens, a colored circle is plotted on the chart, and an alert is triggered. The key improvement is that it remembers if a crossover occurred in the last 7 bars and continues to display the circle during that period.
**Use Case:**
Traders use this type of indicator to identify potential entry and exit points in the market. A bullish crossover (shorter SMA crossing above the longer SMA) might be a signal to buy, while a bearish crossover might be a signal to sell.
**Key Improvements over Previous Versions:**
* **Correct Lookback Implementation:** The use of `ta.barssince()` and `var` variables is the correct and efficient way to check for crossovers within a lookback period. This fixes the major flaw in earlier versions.
* **Clear Visualizations:** The use of `plotshape` with distinct colors makes it easy to distinguish between 20 and 50 SMA crossovers.
* **Alerts:** The inclusion of alerts makes the script much more practical for real-time trading.
This improved version provides a robust and useful tool for identifying and tracking SMA crossovers.
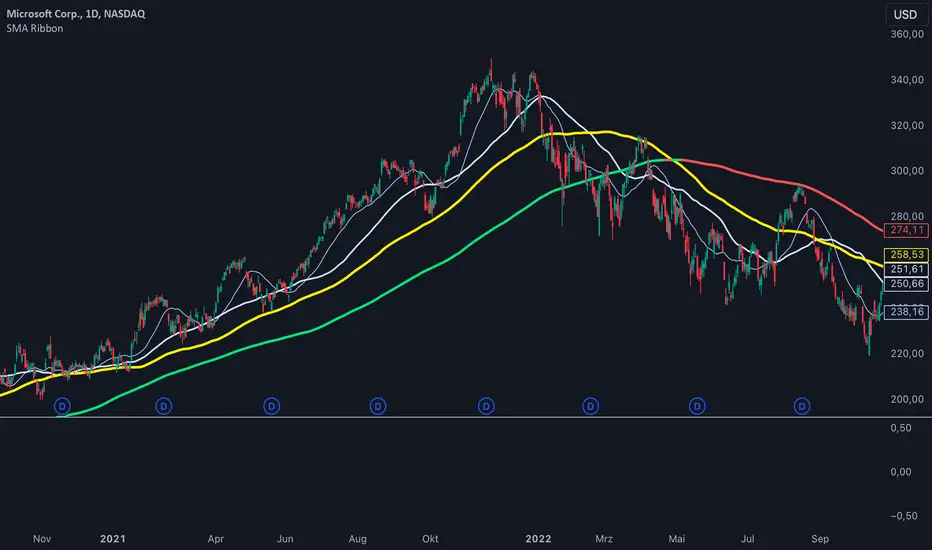
SMA Ribbon [A]SMA Ribbon with Adjustable MA200
20, 50, 100, and 200 -period Simple Moving Averages (SMAs) for trend analysis.
The SMA200 dynamically changes color based on its direction—green when rising and red when falling. Additionally, you can lock the SMA200 to the daily timeframe , allowing it to display the 200-day moving average on lower timeframes, such as 4-hour or 1-hour charts.
Features:
Dynamic SMA200 Color: Automatically adjusts to show upward (green) or downward (red) trends.
Daily SMA200 Option: Enables the SMA200 to represent the 200-day moving average on intraday charts for long-term trend insights.
Smart Adaptation: The daily SMA200 setting is automatically disabled on daily or higher timeframes, ensuring accurate period calculations.
How to Use:
Use this script to identify key support/resistance levels and overall market trends.
Adjust the "Daily MA for MA200" option in the settings to toggle between timeframe-specific and daily-locked SMA200.
This script is ideal for traders seeking a clean and customizable tool for long-term and short-term trend analysis.
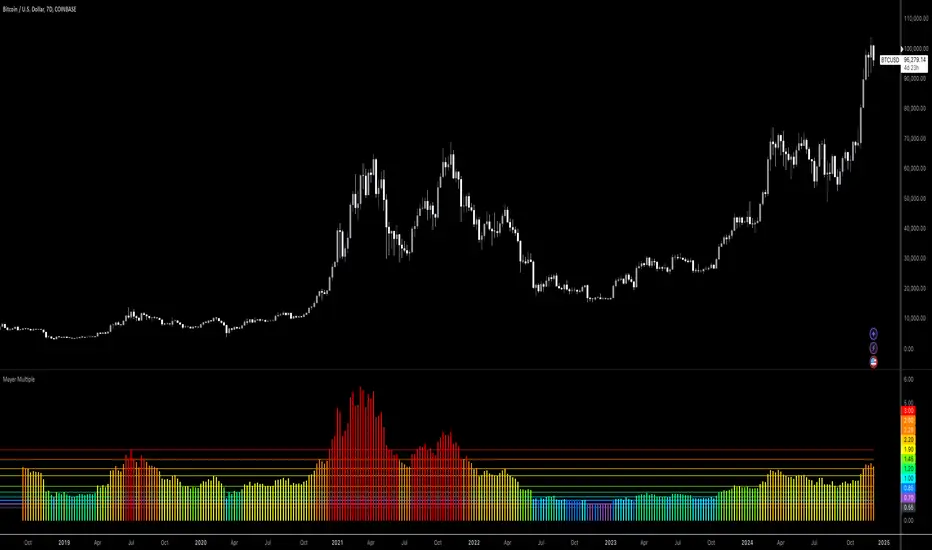
Bitcoin: Mayer MultipleMayer Multiple Indicator
The Mayer Multiple is a powerful tool designed to help traders assess market conditions and identify optimal buying or selling opportunities. It calculates the ratio between the current price and its 200-day simple moving average (SMA), visualizing key thresholds that indicate value zones, caution areas, and overheated markets.
Key Features:
Dynamic Market Zones: Clearly marked levels like "Smash Buy," "Boost DCA," and "Extreme Euphoria" to guide your trading decisions.
Customizable Input: Adjust the SMA length to fit your strategy.
Color-Coded Signals: Intuitive visualization of market sentiment for quick analysis.
Comprehensive Thresholds: Historical insights into price behavior with plotted reference levels based on probabilities.
This indicator is ideal for traders aiming to enhance their long-term strategies and improve decision-making in volatile markets. Use it to gain an edge in identifying potential turning points and managing risk effectively.
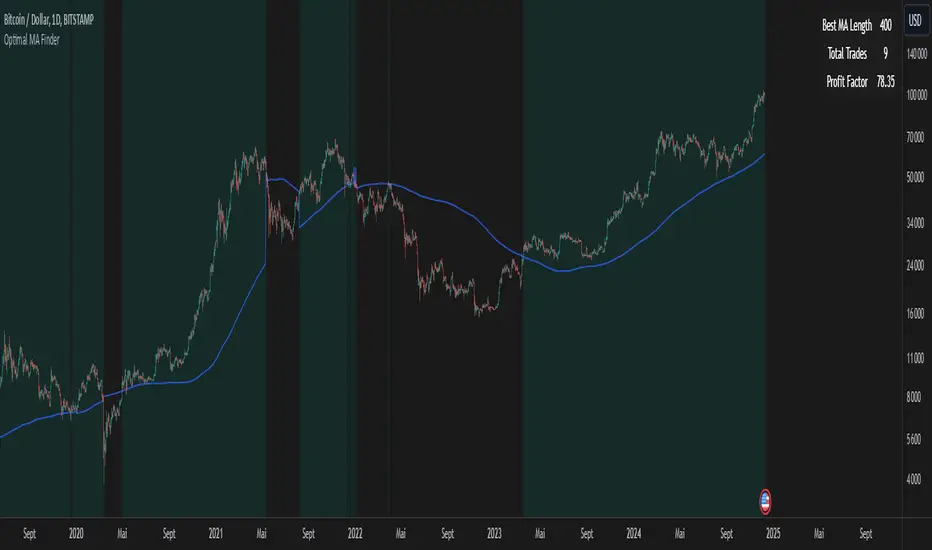
Optimal MA FinderIntroduction to the "Optimal MA Finder" Indicator
The "Optimal MA Finder" is a powerful and versatile tool designed to help traders optimize their moving average strategies. This script combines flexibility, precision, and automation to identify the most effective moving average (MA) length for your trading approach. Whether you're aiming to improve your long-only strategy or implement a buy-and-sell methodology, the "Optimal MA Finder" is your go-to solution for enhanced decision-making.
What Does It Do?
The script evaluates a wide range of moving average lengths, from 10 to 500, to determine which one produces the best results based on historical data. By calculating critical metrics such as the total number of trades and the profit factor for each MA length, it identifies the one that maximizes profitability. It supports both simple moving averages (SMA) and exponential moving averages (EMA), allowing you to tailor the analysis to your preferred method.
The logic works by backtesting each MA length against the price data and assessing the performance under two strategies:
Buy & Sell: Includes both long and short trades.
Long Only: Focuses solely on long positions for more conservative strategies.
Once the optimal MA length is identified, the script overlays it on the chart, highlighting periods when the price crosses over or under the optimal MA, helping traders identify potential entry and exit points.
Why Is It Useful?
This indicator stands out for its ability to automate a task that is often labor-intensive and subjective: finding the best MA length. By providing a clear, data-driven answer, it saves traders countless hours of manual testing while significantly enhancing the accuracy of their strategies. For example, instead of guessing whether a 50-period EMA is more effective than a 200-period SMA, the "Optimal MA Finder" will pinpoint the exact length and type of MA that has historically yielded the best results for your chosen strategy.
Key Benefits:
Precision: Identifies the MA length with the highest profit factor for maximum profitability.
Automation: Conducts thorough backtesting without manual effort.
Flexibility: Adapts to your preferred MA type (SMA or EMA) and trading strategy (Buy & Sell or Long Only).
Real-Time Feedback: Provides actionable insights by plotting the optimal MA directly on your chart and highlighting relevant trading periods.
Example of Use: Imagine you're trading a volatile stock and want to optimize your long-only strategy. By applying the "Optimal MA Finder," you discover that a 120-period EMA results in the highest profit factor. The indicator plots this EMA on your chart, showing you when to consider entering or exiting positions based on price movements relative to the EMA.
In short, the "Optimal MA Finder" empowers traders by delivering data-driven insights and improving the effectiveness of trading strategies. Its clear logic, combined with robust automation, makes it an invaluable tool for both novice and experienced traders seeking consistent results.
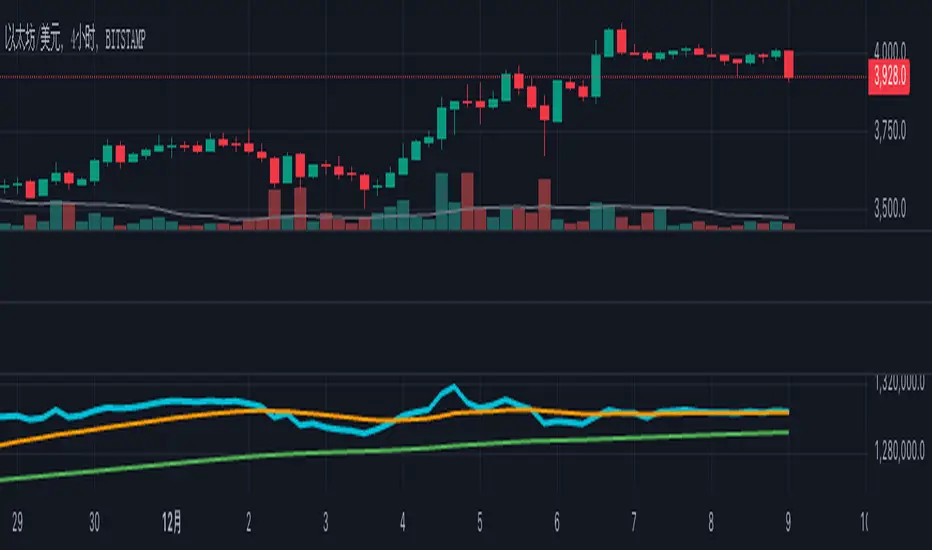
OBV + Custom MA StrategyFor a long time, the use of the OBV indicator has been relatively monotonous, with its expression and content lacking diversity. Therefore, I'm considering trying new ways of representation.
This "OBV + Custom MA Strategy" indicator combines the On-Balance Volume (OBV) with customizable moving averages (SMA, EMA, or WMA) to provide advanced insights into market trends. The indicator calculates OBV manually and overlays two moving averages: a short-term and a long-term MA. Key features include:
OBV plotted alongside short-term and long-term moving averages for better trend visualization.
Signals generated when OBV crosses the short-term MA or when the short-term MA crosses the long-term MA.
Alerts for bullish and bearish crossovers to help identify potential buy or sell opportunities.
This indicator is suitable for traders looking to incorporate volume dynamics into their strategy while customizing their moving average type and periods.
中文说明
此“OBV + 自定义均线策略”指标结合了成交量指标OBV与可定制的移动均线(SMA、EMA或WMA),为市场趋势分析提供了更多的视角。该指标手动计算OBV,并叠加短期与长期均线,主要特点包括:
绘制OBV以及短期和长期均线,以更清晰地观察趋势。
当OBV上穿/下穿短期均线或短期均线上穿/下穿长期均线时,生成买卖信号。
提供多种看涨和看跌信号的警报,帮助识别潜在的买入或卖出机会。
此指标适合希望将成交量动态纳入策略的交易者,并支持自定义均线类型和周期以满足个性化需求。
2-Year MA Multiplier [UAlgo]The 2-Year MA Multiplier is a technical analysis tool designed to assist traders and investors in identifying potential overbought and oversold conditions in the market. By plotting the 2-year moving average (MA) of an asset's closing price alongside an upper band set at five times this moving average, the indicator provides visual cues to assess long-term price trends and significant market movements.
🔶 Key Features
2-Year Moving Average (MA): Calculates the simple moving average of the asset's closing price over a 730-day period, representing approximately two years.
Visual Indicators: Plots the 2-year MA in forest green and the upper band in firebrick red for clear differentiation.
Fills the area between the 2-year MA and the upper band to highlight the normal trading range.
Uses color-coded fills to indicate overbought (tomato red) and oversold (cornflower blue) conditions based on the asset's closing price relative to the bands.
🔶 Idea
The concept behind the 2-Year MA Multiplier is rooted in the cyclical nature of markets, particularly in assets like Bitcoin. By analyzing long-term price movements, the indicator aims to identify periods of significant deviation from the norm, which may signal potential buying or selling opportunities.
2-year MA smooths out short-term volatility, providing a clearer view of the asset's long-term trend. This timeframe is substantial enough to capture major market cycles, making it a reliable baseline for analysis.
Multiplying the 2-year MA by five establishes an upper boundary that has historically correlated with market tops. When the asset's price exceeds this upper band, it may indicate overbought conditions, suggesting a potential for price correction. Conversely, when the price falls below the 2-year MA, it may signal oversold conditions, presenting potential buying opportunities.
🔶 Disclaimer
Use with Caution: This indicator is provided for educational and informational purposes only and should not be considered as financial advice. Users should exercise caution and perform their own analysis before making trading decisions based on the indicator's signals.
Not Financial Advice: The information provided by this indicator does not constitute financial advice, and the creator (UAlgo) shall not be held responsible for any trading losses incurred as a result of using this indicator.
Backtesting Recommended: Traders are encouraged to backtest the indicator thoroughly on historical data before using it in live trading to assess its performance and suitability for their trading strategies.
Risk Management: Trading involves inherent risks, and users should implement proper risk management strategies, including but not limited to stop-loss orders and position sizing, to mitigate potential losses.
No Guarantees: The accuracy and reliability of the indicator's signals cannot be guaranteed, as they are based on historical price data and past performance may not be indicative of future results.

Fourier Extrapolation of PriceThis advanced algorithm leverages Fourier analysis to predict price trends by decomposing historical price data into its frequency components. Unlike traditional algorithms that often operate in lower-dimensional spaces, this method harnesses a multidimensional approach to capture intricate market behaviors. By utilizing additional dimensions, the algorithm identifies and extrapolates subtle patterns and oscillations that are typically overlooked, providing a more robust and nuanced forecast.
Ideal for traders seeking a deeper understanding of market dynamics, this tool offers an enhanced predictive capability by aligning its calculations with the complexity of real-world financial systems.

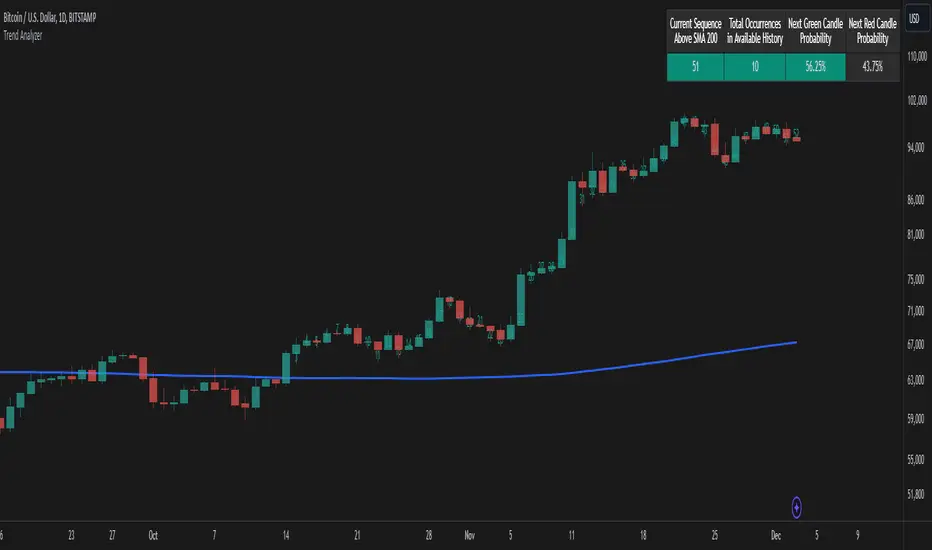
Trend AnalyzerThe Trend Analyzer is designed to help traders identify and analyze market trends. Here's a simple explanation of its logic:
Main Features
Customizable Moving Average: The indicator plots a moving average on the chart. Users can choose from various types (SMA, EMA, WMA, VWMA, HMA, SMMA, TMA) and set the period. This flexibility allows traders to adapt the indicator to different trading styles and timeframes.
Trend Detection: It determines whether the current price is above or below the moving average, providing a clear visual representation of the current trend direction.
Sequence Counter: The indicator counts consecutive candles above or below the moving average. This feature helps traders identify trend strength and persistence, which can be crucial for timing entries and exits.
Statistical Analysis: It calculates probabilities for the next candle's direction based on historical data. This unique feature gives traders a statistical edge in predicting short-term price movements.
Visual Candle Counter: An optional feature that displays the number of consecutive candles above or below the moving average directly on the chart, enhancing visual analysis.
How It Works
The indicator continuously tracks the position of price relative to the chosen moving average.
It maintains a count of how many candles in a row have been above or below the moving average.
For each sequence length, it records historical data on how often the trend continued or reversed in the past.
This historical data is used to calculate probabilities for the next candle's direction, providing a statistical insight into potential price movements.
The indicator displays this information directly on the chart, allowing for quick and easy interpretation.
Practical Applications
Trend Confirmation: Use the indicator to confirm the strength and direction of current trends.
Entry and Exit Signals: The sequence counter and probability calculations can help in timing trades more effectively.
Risk Management: Understanding the statistical likelihood of trend continuation can aid in setting appropriate stop-loss and take-profit levels.
Market Analysis: The indicator provides valuable insights into market behavior and can be used for both short-term and long-term analysis.
While the Trend Analyzer provides valuable insights based on historical data and statistical analysis, it's important to remember that past performance does not guarantee future results. The financial markets are complex and influenced by numerous factors. This indicator should be used as part of a comprehensive trading strategy and not as a sole decision-making tool. Always practice proper risk management and consider seeking advice from financial professionals before making investment decisions.
Adapted RSI w/ Multi-Asset Regime Detection v1.1The relative strength index (RSI) is a momentum indicator used in technical analysis. RSI measures the speed and magnitude of an asset's recent price changes to detect overbought or oversold conditions in the price of said asset.
In addition to identifying overbought and oversold assets, the RSI can also indicate whether your desired asset may be primed for a trend reversal or a corrective pullback in price. It can signal when to buy and sell.
The RSI will oscillate between 0 and 100. Traditionally, an RSI reading of 70 or above indicates an overbought condition. A reading of 30 or below indicates an oversold condition.
The RSI is one of the most popular technical indicators. I intend to offer a fresh spin.
Adapted RSI w/ Multi-Asset Regime Detection
Our Adapted RSI makes necessary improvements to the original Relative Strength Index (RSI) by combining multi-timeframe analysis with multi-asset monitoring and providing traders with an efficient way to analyse market-wide conditions across different timeframes and assets simultaneously. The indicator automatically detects market regimes and generates clear signals based on RSI levels, presenting this data in an organised, easy-to-read format through two dynamic tables. Simplicity is key, and having access to more RSI data at any given time, allows traders to prepare more effectively, especially when trading markets that "move" together.
How we calculate the RSI
First, the RSI identifies price changes between periods, calculating gains and losses from one look-back period to the next. This look-back period averages gains and losses over 14 periods, which in this case would be 14 days, and those gains/losses are calculated based on the daily closing price. For example:
Average Gain = Sum of Gains over the past 14 days / 14
Average Loss = Sum of Losses over the past 14 days / 14
Then we calculate the Relative Strength (RS):
RS = Average Gain / Average Loss
Finally, this is converted to the RSI value:
RSI = 100 - (100 / (1 + RS))
Key Features
Our multi-timeframe RSI indicator enhances traditional technical analysis by offering synchronised Daily, Weekly, and Monthly RSI readings with automatic regime detection. The multi-asset monitoring system allows tracking of up to 10 different assets simultaneously, with pre-configured major pairs that can be customised to any asset selection. The signal generation system provides clear market guidance through automatic regime detection and a five-level signal system, all presented through a sophisticated visual interface with dynamic RSI line colouring and customisable display options.
Quick Guide to Use it
Begin by adding the indicator to your chart and configuring your preferred assets in the "Asset Comparison" settings.
Position the two information tables according to your preference.
The main table displays RSI analysis across three timeframes for your current asset, while the asset table shows a comparative analysis of all monitored assets.
Signals are colour-coded for instant recognition, with green indicating bullish conditions and red for bearish conditions. Pay special attention to regime changes and signal transitions, using multi-timeframe confluence to identify stronger signals.
How it Works (Regime Detection & Signals)
When we say 'Regime', a regime is determined by a persistent trend or in this case momentum and by leveraging this for RSI, which is a momentum oscillator, our indicator employs a relatively simple regime detection system that classifies market conditions as either Bullish (RSI > 50) or Bearish (RSI < 50). Our benchmark between a trending bullish or bearish market is equal to 50. By leveraging a simple classification system helps determine the probability of trend continuation and the weight given to various signals. Whilst we could determine a Neutral regime for consolidating markets, we have employed a 'neutral' signal generation which will be further discussed below...
Signal generation occurs across five distinct levels:
Strong Buy (RSI < 15)
Buy (RSI < 30)
Neutral (RSI 30-70)
Sell (RSI > 70)
Strong Sell (RSI > 85)
Each level represents different market conditions and probability scenarios. For instance, extreme readings (Strong Buy/Sell) indicate the highest probability of mean reversion, while neutral readings suggest equilibrium conditions where traders should focus on the overall regime bias (Bullish/Bearish momentum).
This approach offers traders a new and fresh spin on a popular and well-known tool in technical analysis, allowing traders to make better and more informed decisions from the well presented information across multiple assets and timeframes. Experienced and beginner traders alike, I hope you enjoy this adaptation.

Onchain Analysis - BTCIntroduction
This indicator is designed to equip traders with actionable insights into long-term BITSTAMP:BTCUSD market dynamics through a blend of on-chain metrics and technical tools. It provides a streamlined visualization of market sentiment and critical price levels using unique and proprietary methodologies.
The script features:
NUPL (Net Unrealized Profit/Loss) with advanced bar color coding.
350DMA and 350DMAx2, offering insights into key Bitcoin cycle levels.
Logarithmic Fibonacci Extension, aiding in precise target setting during price discovery phases.
Core Functionality
NUPL Analysis
NUPL reflects the network's aggregate unrealized profit or loss, calculated as (Market Cap − Realized Cap) / Market Cap. Bars are color-coded dynamically to simplify the interpretation of market sentiment. The emotional states (e.g., euphoria, fear) are visually represented for quick analysis, making this indicator particularly valuable for traders monitoring Bitcoin's macro cycles. This implementation improves clarity by aggregating NUPL across all holders rather than separating short- and long-term holders.
350DMA and 350DMAx2
The 350DMAx2 line has historical relevance as a key level during Bitcoin bull cycles, often acting as a resistance point during price rallies. This implementation also includes precise visualization of price interaction with the 350DMA, enabling traders to anticipate potential retracement or breakout zones. Furthermore, to minimize chart clutter, the 350DMA and 350DMAx2 lines are designed to dynamically appear only when the price is near these levels. This ensures that traders can focus on relevant data without unnecessary visual distractions.
Logarithmic Fibonacci Extensions
Unlike traditional Fibonacci extensions, logarithmic levels better suit assets like Bitcoin that grow exponentially. The calculated levels provide traders with clear targets in price discovery phases, enhancing the utility of this feature.
Key Advantages and Unique Features
Enhanced Visualization : NUPL bar color-coding simplifies sentiment analysis, allowing traders to instantly identify key turning points in market psychology.
Historical Context : The script incorporates insights derived from past market cycles, emphasizing the significance of 350DMAx2 levels.
Customization : Traders can adapt settings like lookback periods (e.g., 500 for daily, 100 for weekly) to fit their preferred timeframe and trading strategy.
Proprietary Insights : The script integrates logarithmic Fibonacci levels in a unique manner, optimizing their application to logarithmic assets.
Why This Indicator is Valuable
This indicator is not a simple combination of existing tools; it is a carefully curated suite of functionalities designed to address specific needs of crypto traders. The advanced NUPL representation and integration of logarithmic Fibonacci make it a distinct addition to any trader's toolkit. It provides clarity in interpreting long-term trends and offers actionable insights for navigating Bitcoin's cyclical nature.
How to Use
NUPL Monitoring
Pay close attention to initial color changes, e.g. orange and red, since it may establish clear pull-back. Especially, when bars turn black, it suggests that the market is heavily in profit, often signaling a market top.
350DMAx2 Interaction
If the price is trading below or near the 350DMAx2 level, it often reflects a key resistance zone. Historically, price rejections from this level are common, offering traders critical insights into potential retracement scenarios.
Logarithmic Fibonacci Extensions
Logarithmic Fibonacci extension levels are especially valuable for assets like BITSTAMP:BTCUSD , which exhibit logarithmic growth. These levels provide:
Target Identification: During price discovery phases, the logarithmic Fibonacci levels act as critical resistance or support points, enabling traders to set realistic price targets.
Market Top Detection: When extreme NUPL values (e.g., black bars) align with price interaction near logarithmic Fibonacci levels, the likelihood of a market top increases significantly. This alignment offers a robust method for identifying overbought or overextended market conditions.
Combining Concepts
When NUPL's extreme signals (e.g., red or black bars) align with price movements near the 350DMAx2 level, the likelihood of a significant pullback increases. Additionally, these scenarios can be further validated by observing logarithmic Fibonacci resistance levels, which can provide added confidence in identifying market tops during price discovery phases.
