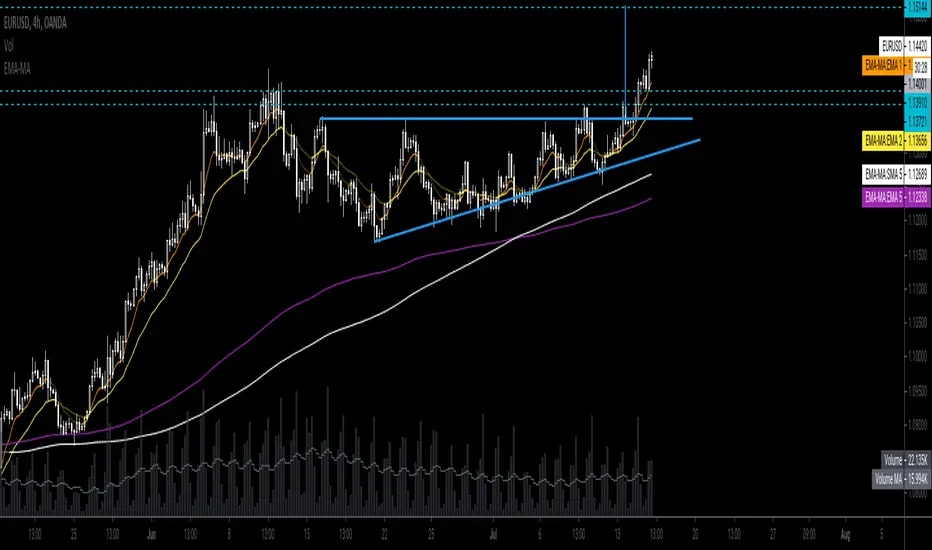
EMA/MA ComboThis is a simple combined EMA/MA indicator that also identifies the slope of the moving averages.
Media mobile semplice (SMA)
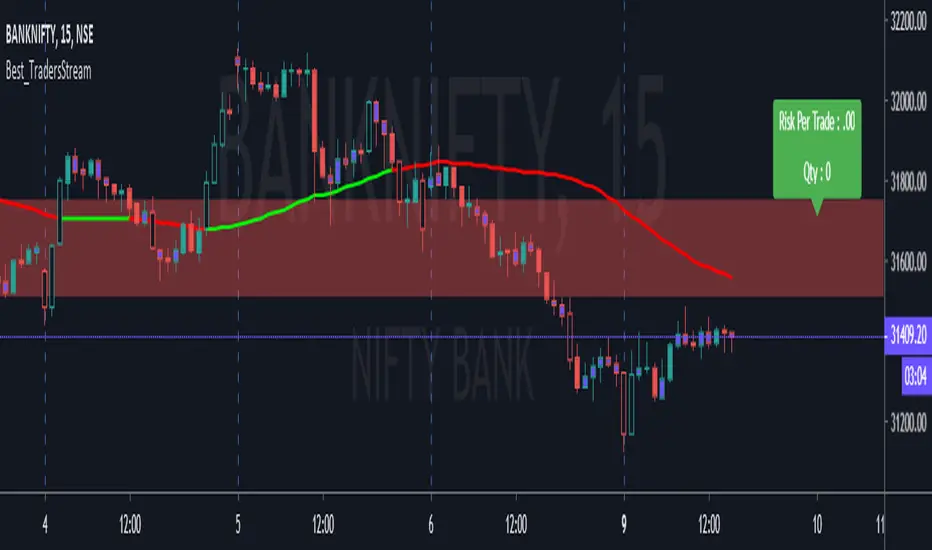
Best_TradersStreamIn this Indicator you will find SMA 50, SMA 30 and 40 Cross Over, Bollinger Band filled with Green and Red Colors and Finally Risk calculator to calculate Risk per Trade and Qty per Trade. This tool is Especially useful to Intraday Trading.
Ori Visual MACDMACD is about a relationship between two Moving Averages. Visual Macd draws these two moving averages and shows MACD with color on them. It is helpful for understanding MACD.

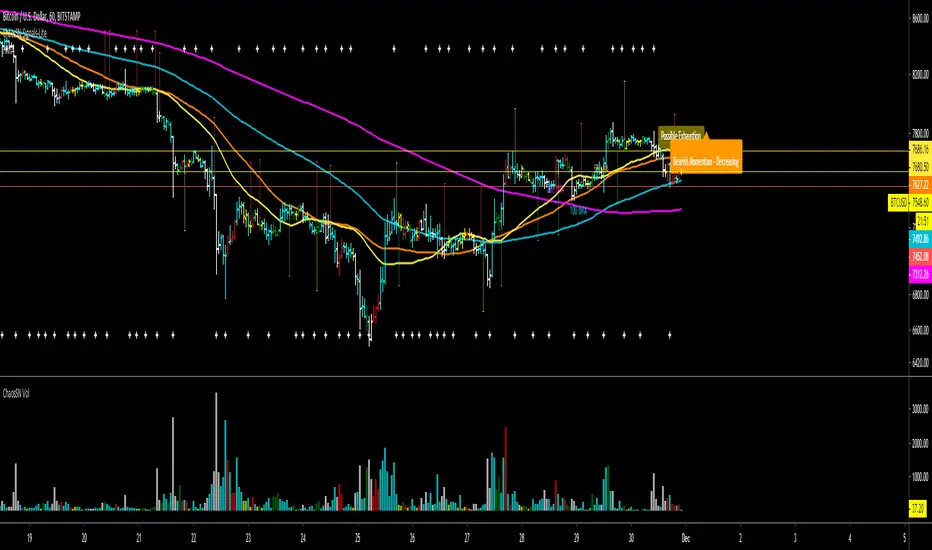
Fibonacci Moving AverageFibonacci extensions on a moving average. Useful for finding potential levels of support and resistance. Look for confluence with horizontal support/resistance and momentum oscillators.
PHI MACDPhiCube calibrated 3-line MACD with candle coloring function at intersections! NOTE: Interesting to use in conjunction with PHI EMAs + MAs.
Personal Preferences: I use the Series 4 parameters, averages 72 17 34 and 144, but you can set it in the Flow Diffuser parameters 55 21 34 and 144, or according to your preferences.
Hope you like it!

PHI EMAs + MAsPhiCube calibrated EMAs + MAs pack with candle coloring at intersections! NOTE: Interesting to use together with PHI MACD.
Personal Preferences: I operate only with 17 72 and 305 always on display, the other parameters, use only in confirmation situations, such as: View range 610, or see support and resistance levels of larger lines, such as 1292 and 2584, for example...
Hope you like it!

Ultimate RSIRSI w/BBands and 12 period moving average.
BBands show the standard deviation of the RSI, and can therefore suggest if a trend is oversold or overbought in conjunction with the 30 and 70 RSI values. A tightening of the BBands also suggests a major move/trend change is immanent.
The RSI moving average can suggest if the RSI is in a bullish or bearish trend . So if RSI>RSIMA then bullish trend , and if RSI

Multi Moving Averages @Hendo 4C (14 Types)A script containing 14 different types of Moving Averages, a total of 4 can be added per chart (allowing multiple Moving Averages under a smaller TradingView plan).
It also comes with: Adaptive coloring, settings for the source of calculations, customizable colors and lengths. Most importantly, as mentioned: 14 different types found below.
Simple Moving Average (SMA)
Exponential Moving Average (EMA)
Double Exponential Moving Average (DEMA)
Triple Exponential Moving Average (TEMA)
Running Moving Average (RMA)
Kaufman's Adaptive Moving Average (KAMA)
Hull's Moving Average (HMA)
Least Square Moving Average (LSMA)
Weighted Moving Average (WMA)
A. Legoux Moving Average (ALMA)
Volume Weighted Moving Average (VWMA)
Symetrically Weighted Moving Average (SWMA)
Smoothed Moving Average (SMMA)
Elastic Volume Weighted Moving Average (eVWMA)
The goal of creating this script was to allow people with a small TradingView subscription to have access to multiple Moving Averages. Of course it’s not unique in that use case, the thing that makes this script is unique is the fact that it comes with 14 different Moving Averages that can be selected independently. You want a RMA paired with 2 EMA’s and one HMA? Go ahead!
I’m open to add any requests that you guys might have. Feel free to ask so in the comments.
Check out my “Volatility Stop Loss Helper” too! And happy trading.
Last: I think it’s pretty clear to say that this was not “my idea” to build. But I found most of the similar scripts available pretty lacking in terms of settings and additions.
{{Settings overview}}
“Adaptive Colouring”: If enabled the Moving Average colours will be determined by their relation to price. If price is above the Moving Average it’s green, and red if price is below.
“Plot First MA”: Disable or enable the first moving average
“Moving Average Type 1”: The type of Moving Average that the first MA should be. 14 choices.
“Moving Average Length 1”: The length of the first Moving Average.
“Source of Calculation MA1”: The source that is used to calculate the Moving Average. Default is “Close”.
“Plot Second MA”: Enable if you want to use 2 Moving Averages
Settings are the same as described above. But then for the second MA.
“Plot Third MA”: Enable if you want to use 3 Moving Averages
Settings are the same as described above. But then for the third MA.
“Plot Fourth MA”: Enable if you want to use 4 Moving Averages
Settings are the same as described above. But then for the fourth MA.
It is recommended to click the little left arrow to hide your indicators in the top corner while using this indicator. Due to the length of the settings menu.
Settings can be added due to requests. Please check the update notes below:

CBC 5MA DRSShowing Multiple Moving Averages (5 MAs) in one 1 indicator with color coding. Very useful for CBC community.

$0 Exponential & Simple MAs with HigherTFMultiple Moving Averages (Simple/SMA & Exponential/EMA) in one indicator
Support for a fixed time frame for the MAs
MAs default period length are key ones, provided by experienced traders in crypto, greetings to xpressive
Live update or Non-repainting modes support: with the non-repainting mode the previous candle's close is considered instead of latest/current bar's changing close
Features:
7 EMAs with editable length
4 SMAs with editable length
Choice of the price/data source from a predefined list
Activate or not the usage of an higher TF
Target Higher time frame resolution. Not using the predefined lists for more possibilities, e.g M1="M", H12="720", D3="3D", 5M="5"
Configurable lines' width in one setting. Hide or change the MAs color from the indicator's style settings

MrCryptoBos - EMA/SMAThe MrCryptoBos - EMA/SMA indicator contains essential Exponential Moving Averages and Simple Moving Averages that matches with important levels on the timeframes.

[BA] Multi Time Frame Moving Averages for BTCThis is a multi time frame moving average script. It includes 7 moving averages. Most of them are SMAs and WMAs but EMA were also used. Time frame was set to 1 day. It means that you can change the time frame of your chart freely without losing your lines. Levels will not change.
I wrote this script just to trade BTC. I prefer daily and weekly charts with this script but lower time frames are also preferable.
Since some of the lengths are too high; older exchanges are recommended due to their relatively deep historical data.
While MA1 is for taking actions like 'take profit' or 'stop loss' or just to follow 'price action' easily, other MAs are for seeing supports and resistances.
MA6 and MA7 are disabled by default in order to minimize the confusion but you can enable them from settings if you need to.
Since some newer exchanges have less historical data, you may not see MA4 and MA5 on the daily chart. In such circumstances MA6 and MA7 might be helpful to use as substitution. Some may like to use all of them.
I am using this script just for BTC but it can be useful for other coins as well.

Multi Timeframe Moving AveragesThis indicator allows you to view a moving average (EMA or SMA) of your choosing on other time frames than what you are currently on.
The reason I wanted to develop this was for use as a filter. Let's say you wanted to make sure the daily time frame was trading above a certain moving average so you could be sure you were playing with the trend. But you wanted to make your entries and exits on a smaller time frame. This Multi-Timeframe Moving Average indicator can then be used to keep an eye on that daily moving average while looking at the shorter term time frames on the same chart.

Hashem OBV+EMA/MAThe On Balance Volume indicator (OBV) is used to measure buying and selling pressure.
It is a cumulative indicator meaning that on days where price went up, that day's volume is added to the cumulative OBV total. If price went down, then that day's volume is subtracted from the OBV total.
The OBV value is then plotted as a line for easy interpretation. OBV is primarily used to confirm or identify overall price Trends or to anticipate price movements after Divergences .
In addition to OBV, EMA and SMA are included. the EMA is used for Support and Resistances for the OBV. and the SMA is used by its Slope (can be S/R as well).

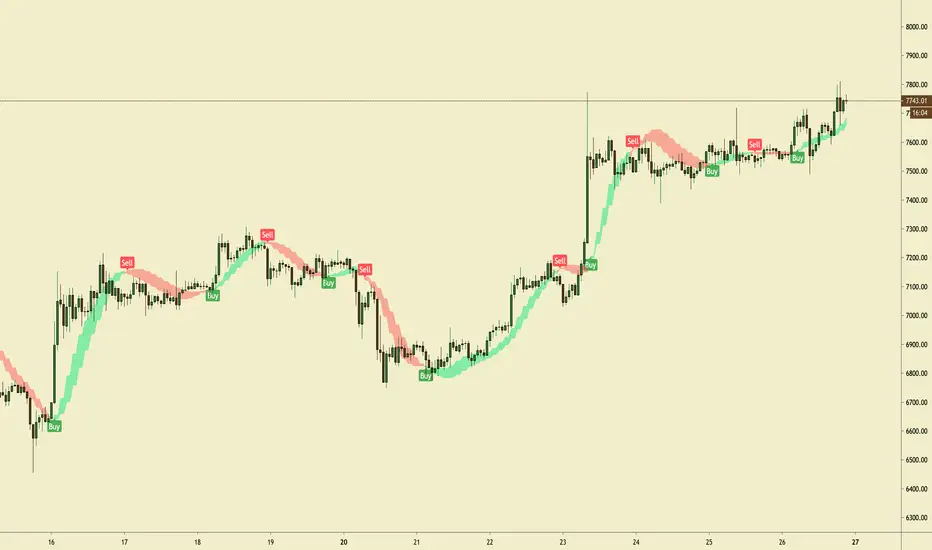
Direction TradeDirection Trade is a moving average based indicator which combines power of SMA and WMA together.
The Buy/Sell (Arrow) signals comes from the combination of SMA and Hull MAs and works on multiple time frames.
The cross of yellow and blue indicates major trend change on bigger TFs, especially on Daily, these are also highlighted in the background color change.
In addition this indicator also adds power of Ichimoku which uses an optimized settings for crypto.

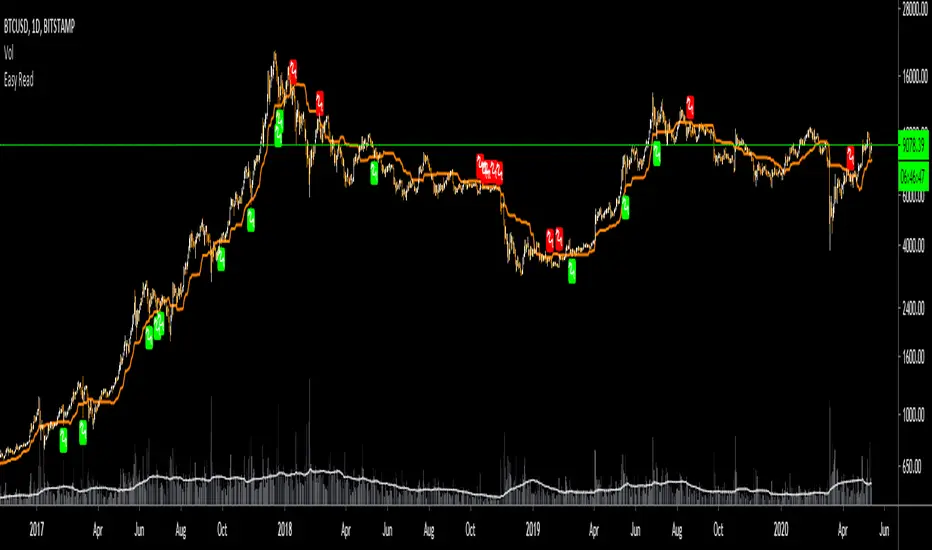
Easy Read_Combo IndicatorEasy Read is a combo indicator. It is designed to plot,
5 SMAs: 20, 50, 100, 144, 200 (with Golden and Death Cross)
6 EMAs: 21, 55, 89, 144, 200, 377 (with Golden and Death Cross)
2 Bollinger Bands with 1st and 2nd standard deviation and a 'Trend Line'
Cobra Indicator with cobra line and cobra buy/sell signals
Buy and take profit signals based on over bought levels in RSI and STOCH
The indicator is pretty straight forward to use. The buy-sell signal show you long/short entries and MAs will help you decide the take profit zone.
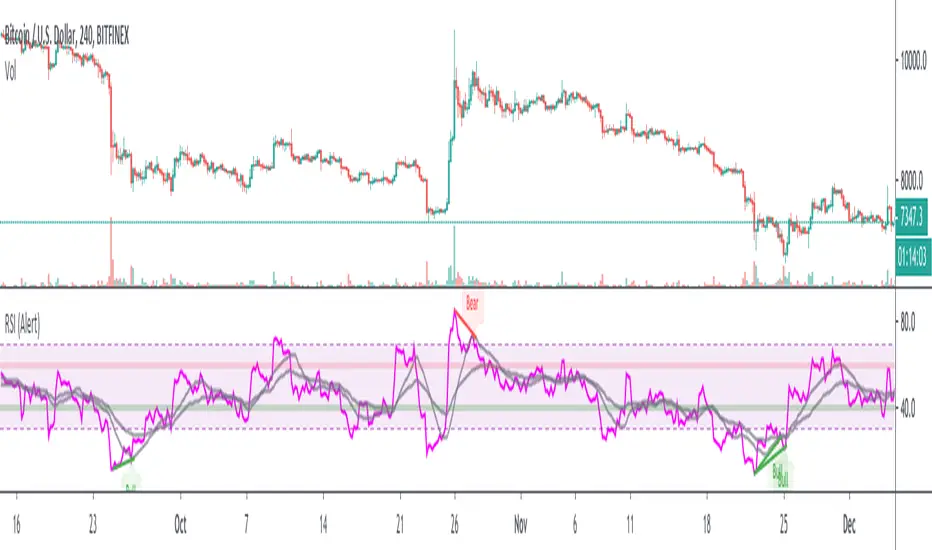
RSI w/ MAs & Divergences (Alert)This script fires off real-time RSI Divergence alerts.
To best use the RSI Divergence indicators, adjust the following settings accordingly.
• RSI Bullish Divergence Under: 20 – 45 (lower for larger volatility and more bearish markets)
• RSI Bearish Divergence Above: 55 – 80 (higher for larger volatility and more bullish markets)
Key Notes:
1. Set "Once Per Bar" instead of "Once Per Bar Close" alert.
The strategy already uses prior bar close (instead of current bar close) for calculation. This ensures that the signals will stay as they are after fired off, even when the current bar price is still changing.
2. It's OKAY to see the "alert may trigger differently than expected" warning.
Reason why you are seeing this warning is because we used a function called valuewhen() in our strategy. This function does not look at the entire history of data and has several limitations. For instance, on a 30min resolution, at the end of 2018, the function will be able to find past occurrences of BTC exceeding 16k. However, the function won't be able to find such occurrences at the end of 2019. Since our strategy is only concerned with very recent events, these limitations will not impact our results or cause repainting. You can find out more about this in the TradingView Wiki .
RSI w/ MAs & DivergencesTo best use the RSI Divergence indicators, adjust the following settings accordingly.
• RSI Bullish Divergence Under: 20 – 45 (lower for larger volatility and more bearish markets)
• RSI Bearish Divergence Above: 55 – 80 (higher for larger volatility and more bullish markets)
THIS SCRIPT DOES NOT REPAINT AND IS COMPLETELY FREE.

Moving Average(MA) CollectionA simple collection of Simple Moving Averages and Exponential Moving Averages. 4 moving averages enabled by default from a total of 10.
Turn MAs on/off and edit the line style/colour via MA Collection settings.
Default Moving Averages and Default Line Styles
21 EMA (Thin, Purple)
50 SMA (Medium, Yellow)
100 EMA (Medium, Dove Gray)
200 SMA (Thick, Radical Red)
Other Optional Moving Averages and Default Line Styles
5 SMA (Thin, Gray)
8 EMA (Thin, Strkemaster)
13 EMA (Thin, Stiletto)
40 EMA (Medium, Rio Grande)
100 SMA (Medium, Silver)
314 EMA (Thick, Olive)

Easy Loot BandsEasy Loot Bollinger Bands:
This indicator is a bollinger band that also auto-generates a trendline, giving you the best opportunities to buy & sell. That's it.
You can use this on any time-frame, any stock, and any cryptocurrency.
Dr_All indicators V1.0Free users have many restrictions on their use in TradingView.
I put together a lot of indicators I use often.
5 moving average
1 parabolic SAR
1 bollinger band
1 ichimoku cloud
(but it's only cloud)
as always
It's open source.
enjoy!

Zone Moving Average Color Direction Detection This indicator generates a zone for a moving average by means of the high and low source of the same average, the moving average should be worked as zones not as a line, by default a simple average of 200 periods is configured, the indicator has direction detection and represents it by the green and red colors, it also has padding with the same characteristic, it is possible to configure the following:
- Type: SMA, EMA, WMA, VWMA, SMMA, DEMA, THEME, HULLMA, ZEMA, TMA, SSMA
- Period / Length
- Source
- Color Direction Detection
Release Notes: Add a field to change the reaction in the change of color and direction of the Media, set to 1 is the fastest, a larger number filters the address better but is slower, 3 is set by default.
