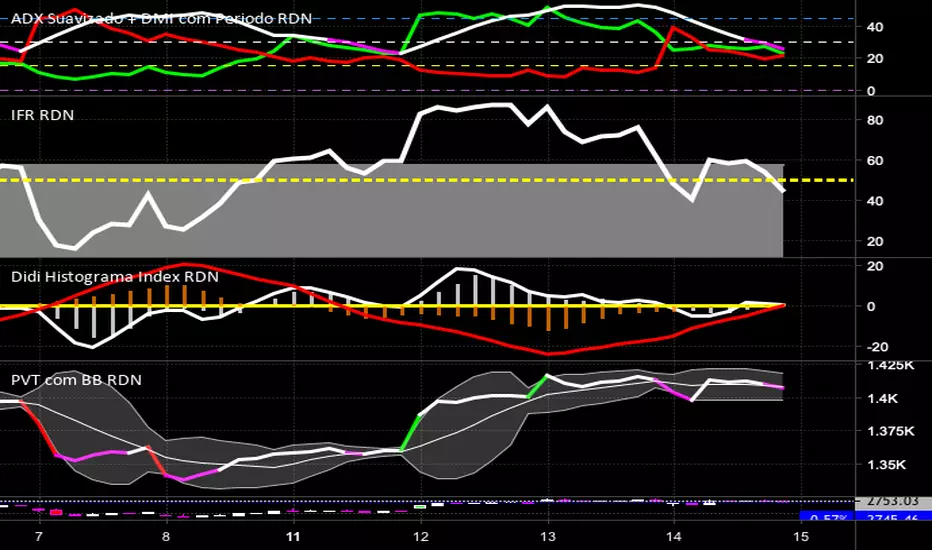
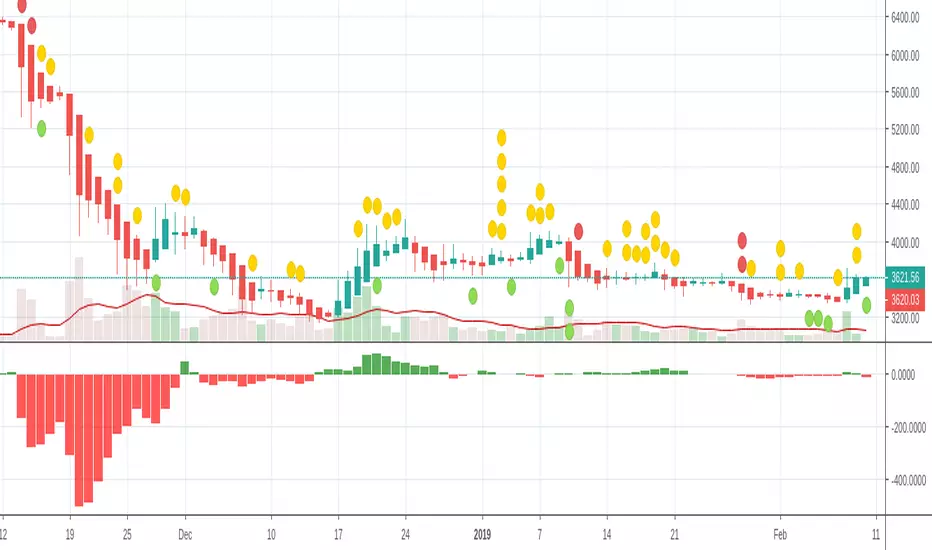
Didi Histograma Index RDN
Adicione rafdourado para maiores informações de uso ou dicas para aprimoramento
Add rafdourado for more usage information or tips for improvement
Media mobile semplice (SMA)

Multiple Simple Moving AveragesOne no-fuss indicator for SMA for 6 different time period (10, 20, 50, 100, 200, 250), styled with sharp and thin line for shorter time period to light-coloured and wide line for longer time period.

SMA Cross (Short X Long)Its a graph for detecting the SMA cross points.
When short SMA crosses the long SMA downside up it may be a buy signal and the opposite is may be a sell signal.
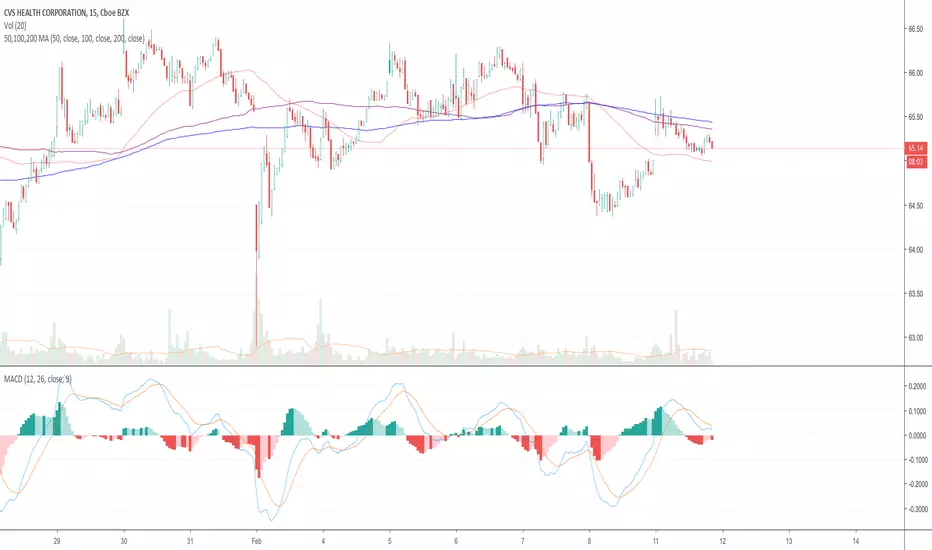
50,100,200 MA50, 100, and 200 simple moving averages in a single indicator. Fixed versions published by other members where 100 and 200 were plotted incorrectly and overlaying each other. Also removed close plot.
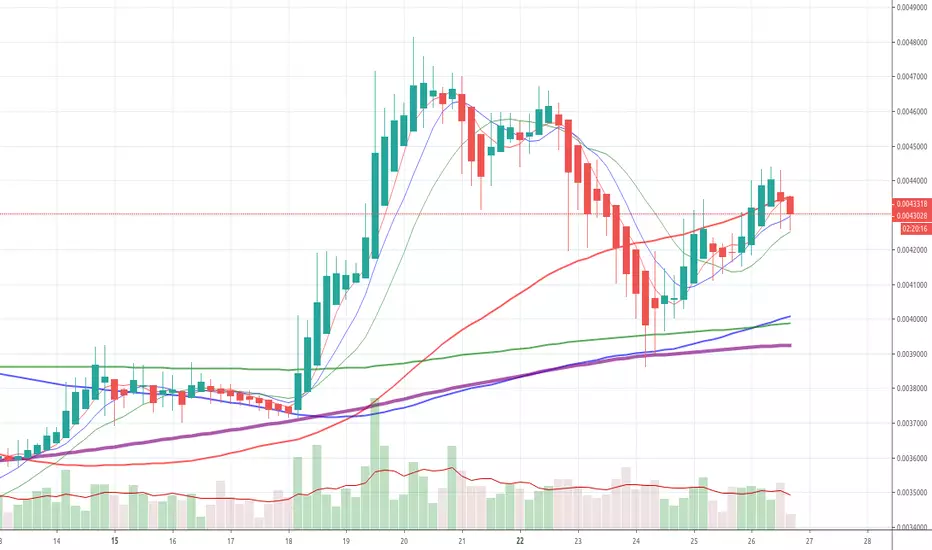
VWMA - SMAVWMA - SMA is very strong indication of trend direction and strength
See here for a description of this trading strategy: www.tradingsetupsreview.com
Multi SMAPlot all of the most important SMA values.
SMA 5, 8, 13 are based on Fibonaci values and frequently used in day trading frequently.
SMA 50, 100, 200 are important support/resistance lines.
Especially, SMA 50, 100, 200 are the most important support/resistance on BTC 1W. Dont forget to look at the weekly prices when trading :)

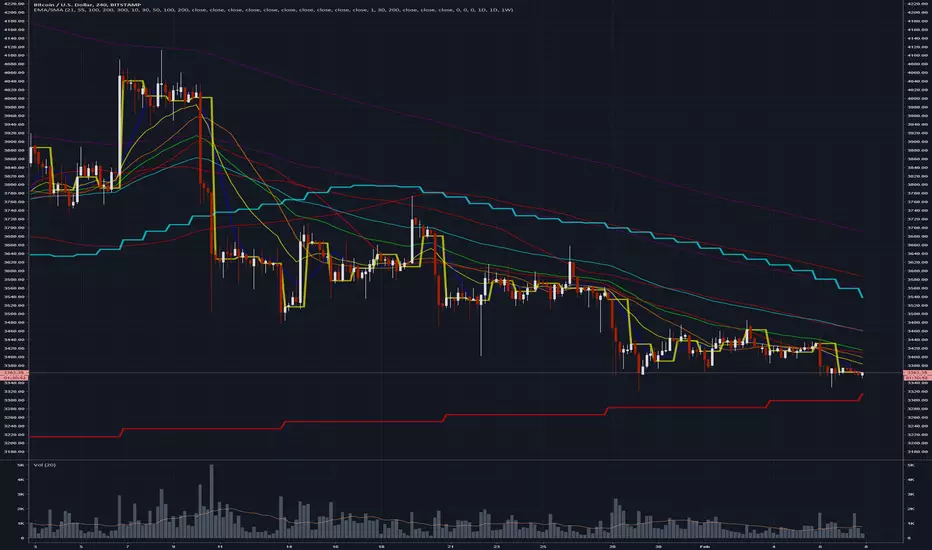
EMA SMA MultiCombo 2.0This script gives you up to 5 EMAs and 5 SMAs with custom length, close and color parameters.
Also, you can set up to 3 SMA with fixed, static timeframe input nondependent of the chart timeframe.
So, for example, you can set your chart to 5 min timeframe and see where 1D, 30D, 200W MA is.
Enjoy!

EMA SMA MultiCombo 2.0This script gives you up to 5 EMAs and 5 SMAs with custom length, close and color parameters.
Also, you can set up to 3 SMA with fixed, static timeframe input nondependent of the chart timeframe.
So, for example, you can set your chart to 5 min timeframe and see where 1D, 30D, 200W MA is.
EMA SMA MultiComboJust a simple combo of 5 EMAs and 5 SMAs.
Custom lenght, custom color and custom source.

ProfitTrailer Example TradingView Signals [v2019-01-31]ProfitTrailer Example TradingView Signal
This script provides an example of a TradingView Signal for use with ProfitTrailer's
new SIGNALS functionality and it's new TradingView integration capability.
This signals script implements a simple Moving Average Cross strategy
that works on any chart timeframe.
It allows you to pick the Price source i.e. Open, Close (default), etc.
You are able to choose between EMA (default) or SMA moving average
calculations.
You can define the fast and slow period lengths for use within the
moving average calculations.
If you get some value out of this indicator please consider making
a small donation to my favourite charity the Save the Childrens Fund.
Every donation will make a difference to the lives of children.
All donations over $2 are tax deductable. You can donate here:
savethechildrenfundraising.org.au
Copyright (c) 2019, Grant Cause aka CryptoCoyns

Multiple EMA/SMACreate and customize up to 6 EMAs and 6 SMAs. Useful for both long-term and short-term trading. Comes configured with the moving averages I use for trading.

SMA 4-602 скользящие средние линии ( simple moving average ) с периодами 4 и 60. Отлично показывает точки входа (в момент пересечения). подходит для краткосрочной торговли на валютных парах.

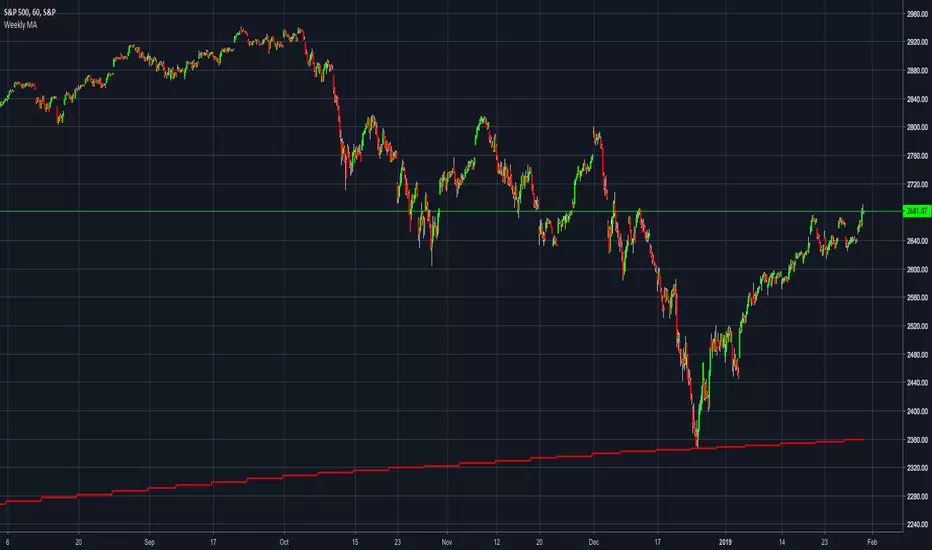
MACD/EMA Long StrategyThis incredibly simple strategy uses a combination of the 20 EMA and bullish/bearish MACD crosses as a low risk method of getting in and out of markets.
Depending on whether the market is above or below the 200 SMA, the script determines if the market is in bullish or bearish territory. Above the 200 SMA, the script will ignore the 20 EMA as a buy condition and buy solely on the confirmation of a bullish MACD cross upon the close of a candle. In this bullish market, the script will only enable the sell condition if both the MACD is bearish AND a close below the 20 EMA occurs. This is to reduce the chances of the script selling prematurely in the event of a bearish MACD cross, if the market is still in overall bullish territory.
When the market is below the 200 SMA, the confirmation occurs in the opposite direction. The buy condition will only be met if both the MACD is bullish AND a close above the 20 EMA occurs. However, the sell condition ignores the 20 EMA and will sell solely on the confirmation of a bearish MACD cross upon the close of the candle.
This strategy can be used in both bullish and bearish markets. This conservative strategy will slightly underperform in a bull market, with the sell condition occasionally being met and then potentially buying back higher. However, it will successfully get you out of a turning market and automatically switch into a more 'risk-off' mentality during a bear market. This strategy is not recommended for sideways markets, as trading around the 20 EMA coupled with a relatively flat MACD profile can cause the strategy to buy the peaks and sell troughs easily.

CryptoCoyns Cross Indicator [v2018-12-10]CryptoCoyns Cross
I use EMA crosses in a number of trading strategies and I often found myself
putting these onto charts. So to save some time I created this indicator that
allows me to put the most common ones on in one hit.
This indicator implements a series of Exponential Moving Averages to show
where they cross. This indicator works on any chart timeframe.
There is an option to swap over to using SMA rather than EMA for all MA lines.
MA lines can be turned on or off individually.
All colours are fully configurable.
If you get some value out of this indicator please consider making
a small donation to my favourite charity the Save the Childrens Fund.
Every donation will make a difference to the lives of children.
All donations over $2 are tax deductable. You can donate here:
savethechildrenfundraising.org.au
Copyright (c) 2018, Grant Cause aka CryptoCoyns

MA Crossover TypeDraws the up and down crossovers of a specified MA Type.
# Inputs
- MA Type: "sma", "ema", "swma", "vwma", "wma"
- Length >=1
- Source
- Offset >= 0
- Show cross Up?
- Show cross Down?
# Open Source
The code is open source @ github.com and uses the commonpine library github.com

MA TypeAdd your MA Type.
# Inputs
- MA Type: "sma", "ema", "swma", "vwma", "wma"
- Length >=1
- Source
- Offset >= 0

Simple Moving Averages Alert Scriptcan set alerts on 3 moving averages (crossovers) , experiment with different moving average lengths in the input settings menu, there is also a toggle switch which turns off the 3rd moving average being used as a stop.
will add a backtesting version at some point
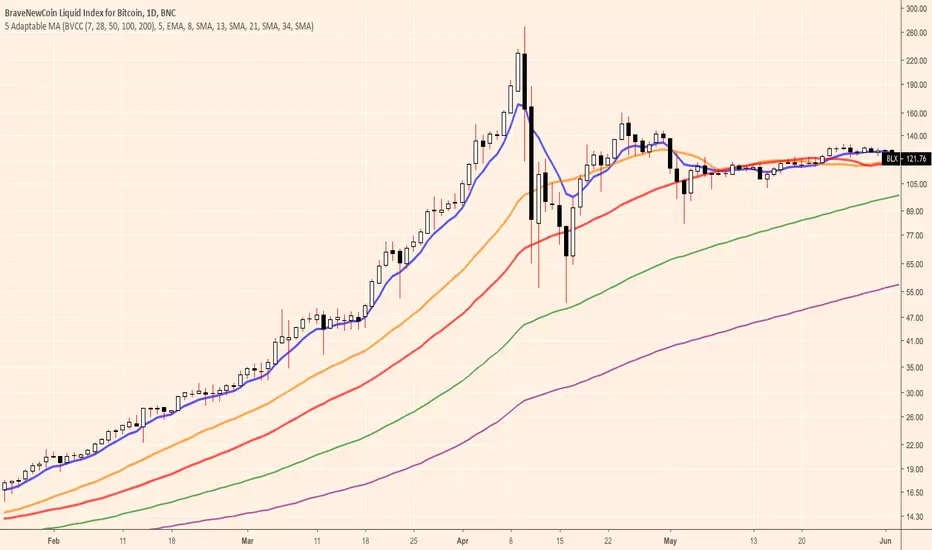
5 Adaptable MA [BVCC]A slight evolution to the ideas presented in the original 7-28-50 BVCC overlay. This version allows you to switch between a custom 5 MA set up of your own choosing and the BVCC recommended 7-28-50-100-200 combo. Additionally, you can choose to mix the SMA and EMA components of the combo in any way that you wish.