Triple MA 5-period forecast [Siem]This script calculates 3 MAs and forecasts where these MAs will be in the next 5 future periods.
Automatic mode - price will be based on current price ("flat") or an X-period linear regression ("linreg").
Manual mode - enter your own value('s): let's see where the MA's will be when your favourite equity all of a sudden hits 1 million tomorrow!
based on Triple MA Forecast by yatrader2 , idea by anthnyl
Media mobile semplice (SMA)


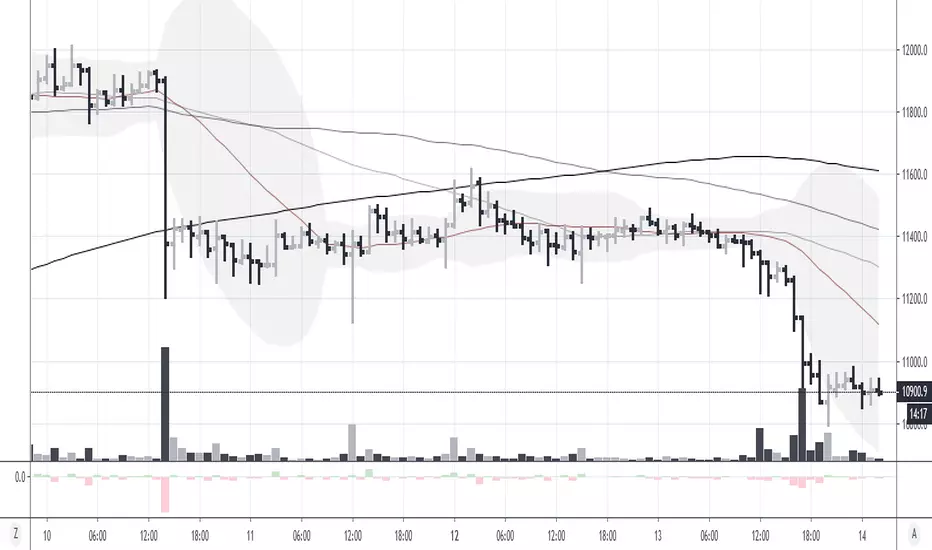
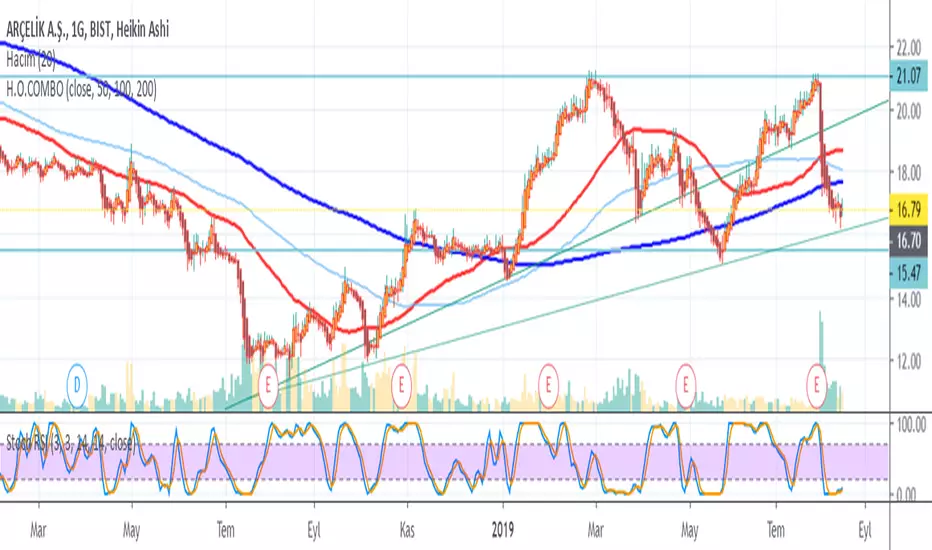
Single MA - Guppy ColorsSingle moving average with CM Super Guppy Colors applied.
Aqua Blue = Fully Bullish Guppy,
Green = Pullback happening within Bullish Trend.
Grey = Indecision
Orange = Fully Bearish Guppy
Red = Pullback happening within Bearish Trend.


Multi EMA/SMA with Bollinger Bands Combo 1.0This script provides:
5 regular EMAs
5 regular SMAs
3 multiple time frame EMAs
3 multiple time frame SMAs
Bollinger Bands
All features can be turned on/off and customized regarding color, lines, etc.
Excellent for TradingView users with limited or free accounts.

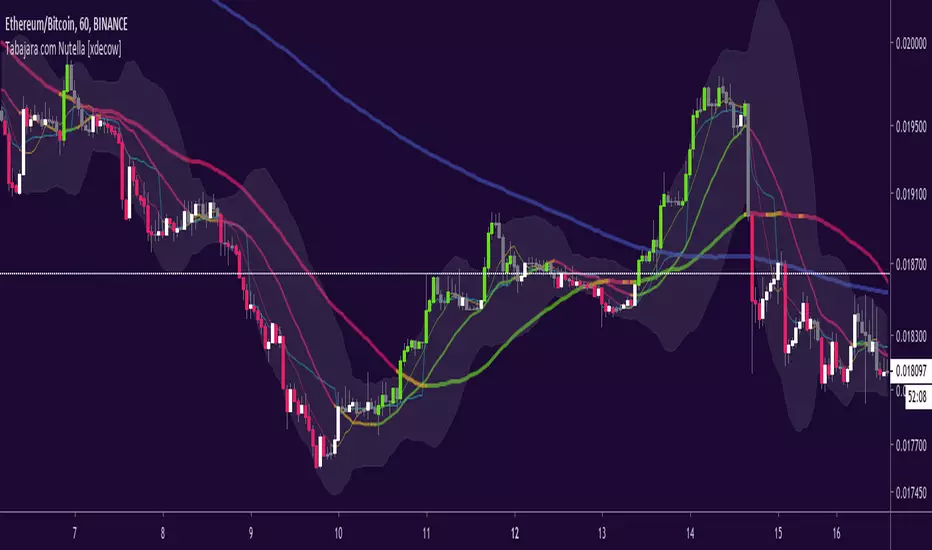
Tabajara com Nutella [xdecow]Tabajara setup from André Machado
-ma 8
-ma 20
-ma 50
-ma 200 (blue)
-vwap (aqua)
-bollinger bands
-barcolor based on tabajara rules
Yield Curve Version 2.55.2Welcome to Yield Curve Version 2.55.2
US10Y-US02Y
* Please read description to help understand the information displayed.
* NOTE - This script requires 1 real time update before accurate information is displayed, therefore WILL NOT display the correct information if the Bond Market is Closed over the Weekend.
* NOTE - When values are changed Via Input setting they do take a bit to display based off all the information that is required to display this script.
**FEATURES**
* Input Features let you view the information the way YOU like via Input Settings
* Displays Current Version Title - Toggleable On/Off via Input Settings - Default On
* Plots the Yield Curve of the Bonds listed (Middle Green and Red Line)
* Displays the Spread for each Bond (Top Green and Red Labels) - Toggleable On/Off via Input Settings - Change Size via Input Settings - Default On
* Displays the current Yield for each Bond (Bottom Green and Red Labels) - Toggleable On/Off via Input Settings - Change Size via Input Settings - Default On - Large Size
* Plots the Average of the Entire Yield Curve (BLUE Line within the Yield Curve) - Toggleable On/Off via Input Settings - Default On
* Displays messages based off Yield Inversions (Orange Text) - Toggleable On/Off via Input Settings - Default On if Applicable
* Displays 2 10 Inversion Warning Message (Orange Text) - Toggleable On/Off via Input Settings - Default On if Applicable
* Plots Column Data at the Bottom that tries to help determine the Stability of the Yield Curve (More information Below about Stability) - Toggleable On/Off via Input Settings - Default On
* Plots the 7,20 and 100 SMA of the STABILITY MAX OVERLOAD (More information Below about Stability Max Overload) - Toggleable On/Off via Input Settings - Default On for 100 SMA , 20 SMA and 7 SMA
* Ability to Display Indicator Name and Value via Input Settings - Default On - Displays Stability Max Overload SMA Labels. Toggleable to Non SMA Values. See Below.
**Bottom Columns are all about STABILITY**
* I have tried to come up with an algorithm that helps understand the Stability of the Yield Curve. There are 3 Sections to the Bottom Columns.
* Section 1 - STABILITY (Displayed as the lightest Green or Red Column) Values range from 0 to 1 where 1 equals the MOST UNSTABLE Curve and 0 equals the MOST STABLE Curve
* Section 2 - STABILITY OVERLOAD (Displayed just above the Stability Column a shade darker Green or Red Column)
* Section 3 - STABILITY MAX OVERLOAD (Displayed just above the Stability Overload Column a shade darker Green or Red Column)
What this section tries to do is help understand the Stability of the Curve based on the inversions data. Lower values represent a MORE STABLE curve. If the Yield Curve currently has 0 Inversions all Stability factors should equal 0 and therefore not plot any lower columns. As the Yield Curve becomes more inverted each section represents a value based off that data. GREEN columns represent a MORE Stable Curve from the resolution prior and vise versa.
(S SO SMO)
STABILITY - tests the current Stability of the Curve itself again ranging from 0 to 1 where 0 equals the MOST Stable Curve and 1 equals the MOST Unstable Curve.
STABILIY OVERLOAD - adds a value to STABLITY based off STABILITY itself.
STABILITY MAX OVERLOAD - adds the Entire value to STABILITY derived again from STABILITY.
This section also allows us to see the 7,20 and 100 SMA of the STABILITY MAX OVERLOAD which should always be the GREATEST of ALL STABILTY VALUES.
*Indicator Labels How to use*
Indicator Labels by default are turned On and will display Name and Value Labels for Stability Max Overload SMA values. To switch to (S SO SMO) Labels, toggle "Indicator Labels / SMO SMA Labels", via Input Settings. This button allows you to switch between the two Indicator Label Display options. You must have "Indicators" turned On to view the Labels and therefore is turned On by Default. To turn all of the Indicator Labels Off, simply disable "Indicators" via Input Settings.
Remember - All information displayed can be tuned On or Off besides the Curve itself. There are also other Features Accessible Via the Input Settings.
I will continue to update this script as there is more information I would like to gather and display!
I hope you enjoy,
OpptionsOnly

Multi EMA/SMA with different resolutions and labelsUp to 6 EMA and 4 SMA that each let you select the time period you want to view them on. Useful for keeping an eye on larger timeframes while watching smaller timeframes and vice versa. Hope you all enjoy!
If you enjoy it so much and are overwhelmed with joy, donations are welcome as I've just recently accomplished the going-broke phase of learning how to trade :)
BTC -- 1G4nKVgK8uJGspXyjYtsQNqiUcnXFTTQ9B
Eth -- 0x11904637C133eFb4BfF95dC8b62cF5c876E170bC
LTC -- Ld3coYyARp3NmLKWd2o9AoTMtirc949hbC
Yield Curve Version 2.41Welcome to Yield Curve Version 2.41
* Please read description to help understand the information displayed.
* NOTE - This script requires 1 real time update before accurate information is displayed, therefore WILL NOT display the correct information if the Bond Market is Closed over the Weekend.
* NOTE - When values are changed Via Input setting they do take a bit to display based off all the information that is required to display this script.
**FEATURES**
* Input Features let you view the information the way YOU like via Input Settings
* Displays Current Version Title - Toggleable On/Off via Input Settings - Default On
* Plots the Yield Curve of the Bonds listed (Middle Green and Red Line)
* Displays the Spread for each Bond (Top Green and Red Labels) - Toggleable On/Off via Input Settings - Change Size via Input Settings - Default On
* Displays the current Yield for each Bond (Bottom Green and Red Labels) - Toggleable On/Off via Input Settings - Change Size via Input Settings - Default On - Large Size
* Plots the Average of the Entire Yield Curve (BLUE Line within the Yield Curve) - Toggleable On/Off via Input Settings - Default On
* Displays messages based off Yield Inversions (Orange Text) - Toggleable On/Off via Input Settings - Default On if Applicable
* Displays 2 10 Inversion Warning Message (Orange Text) - Toggleable On/Off via Input Settings - Default On if Applicable
* Plots Column Data at the Bottom that tries to help determine the Stability of the Yield Curve (More information Below about Stability) - Toggleable On/Off via Input Settings - Default On
* Plots the 7,20 and 100 SMA of the STABILITY MAX OVERLOAD (More information Below about Stability Max Overload) - Toggleable On/Off via Input Settings - Default On for 100SMA Off for 7 and 20 SMA
**Bottom Columns are all about STABILITY**
* I have tried to come up with an algorithm that helps understand the Stability of the Yield Curve. There are 3 Sections to the Bottom Columns.
* Section 1 - STABILITY (Displayed as the lightest Green or Red Column) Values range from 0 to 1 where 1 equals the MOST UNSTABLE Curve and 0 equals the MOST STABLE Curve
* Section 2 - STABILITY OVERLOAD (Displayed just above the Stability Column a shade darker Green or Red Column)
* Section 3 - STABILITY MAX OVERLOAD (Displayed just above the Stability Overload Column a shade darker Green or Red Column)
What this section tries to do is help understand the Stability of the Curve based on the inversions data. Lower values represent a MORE STABLE curve. If the Yield Curve currently has 0 Inversions all Stability factors should equal 0 and therefore not plot any lower columns. As the Yield Curve becomes more inverted each section represents a value based off that data. GREEN columns represent a MORE Stable Curve from the resolution prior and vise versa.
STABILITY tests the current Stability of the Curve itself again ranging from 0 to 1 where 0 equals the MOST Stable Curve and 1 equals the MOST Unstable Curve.
STABILIY OVERLOAD adds a value to STABLITY based off STABILITY itself.
STABILITY MAX OVERLOAD adds the Entire value to STABILITY derived again from STABILITY.
This section also allows us to see the 7,20 and 100 SMA of the STABILITY MAX OVERLOAD which should always be the GREATEST of ALL STABILTY COLUMNS.
Remember - All information displayed can be tuned On or Off besides the Curve itself. There are also other Features Accessible Via the Input Settings.
I will continue to update this script as there is more information I would like to gather and display!
I hope you enjoy,
OpptionsOnly


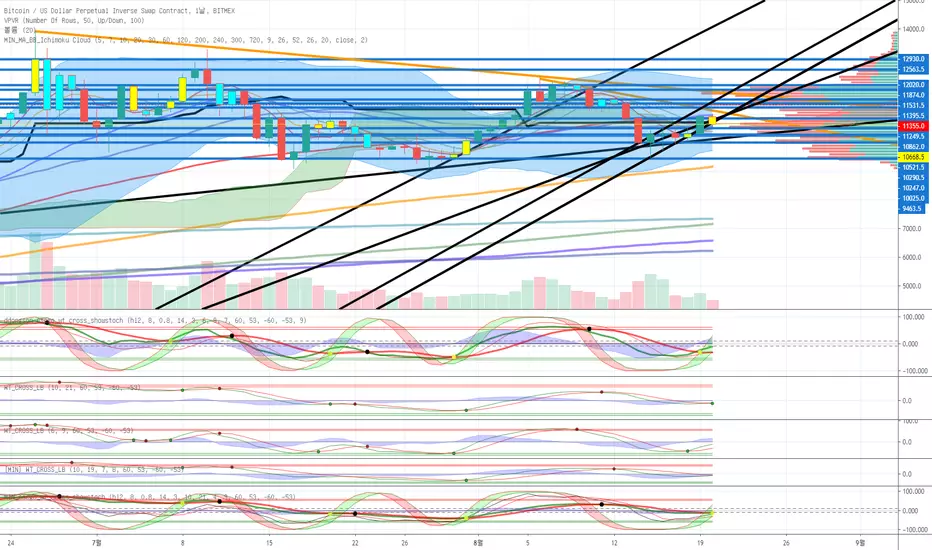
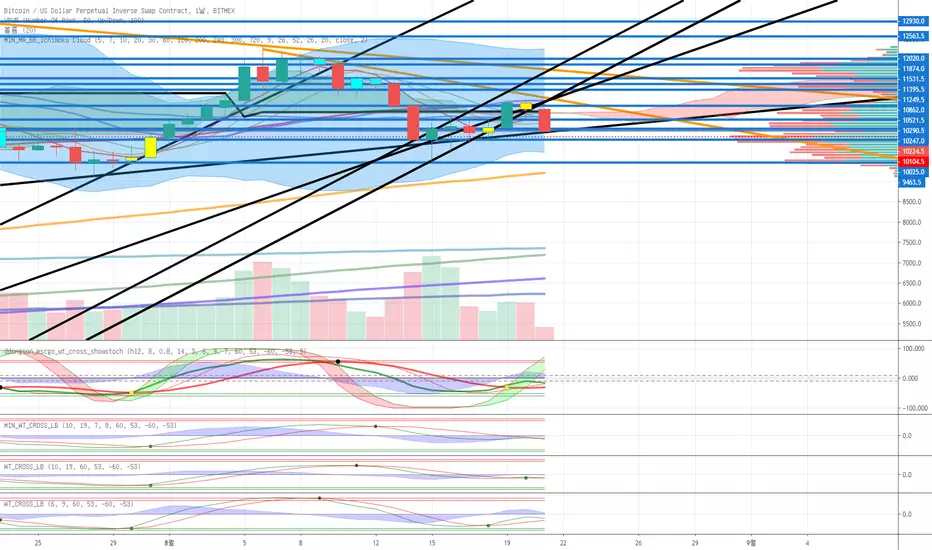
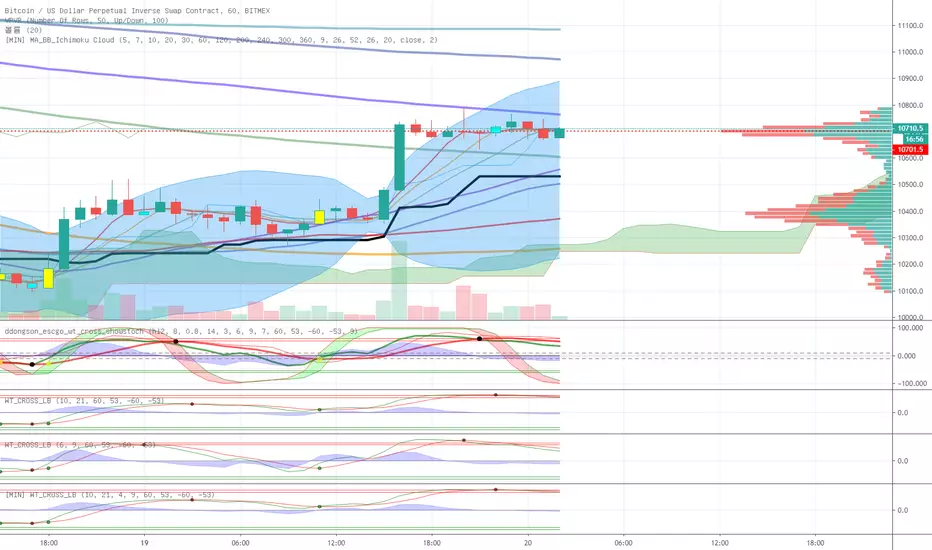
MIN_escgo_wt_cross_showstochehlers stochastic CG oscillator
wavetrend with crosses
slow stochastic
3가지 통합지표입니다.
원지않는 지표는 끌수있습니다.

Leeloo Quadruple (4x) Simple Moving AverageOne-stop shop for all of the simple moving averages because editing separately is annoying.

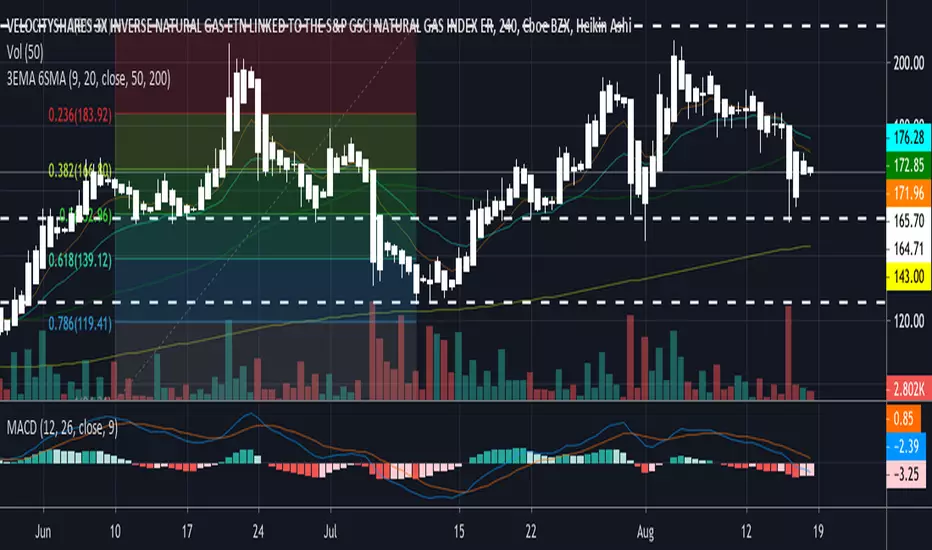
LTIThis is a customised indicator which assists us to easily identify strong linear bullish or bearish trends. It gives us the opportunity to enter only the strongest looking trends which results in potentially faster profits.