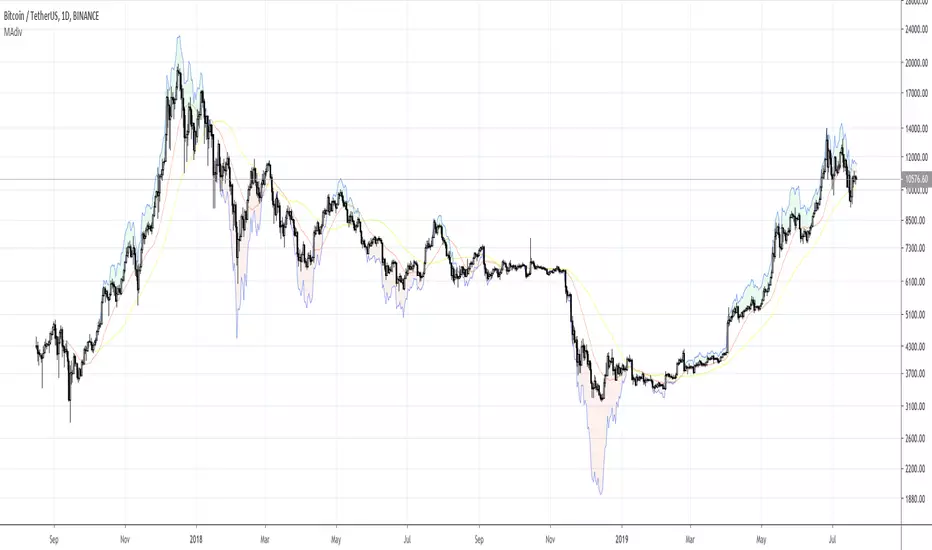
VWAP + SMA + EMA3-in-one indicator, for swing and intra-day trading, which includes
Simple Moving Average (SMA)
Exponential Moving Average (EMA)
Volume-Weighted Average Price (VWAP)
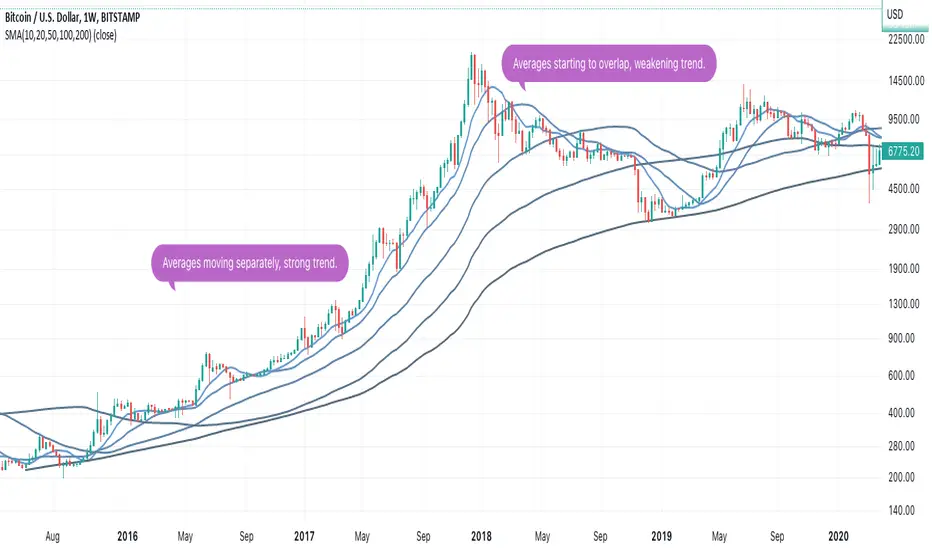
Media mobile semplice (SMA)

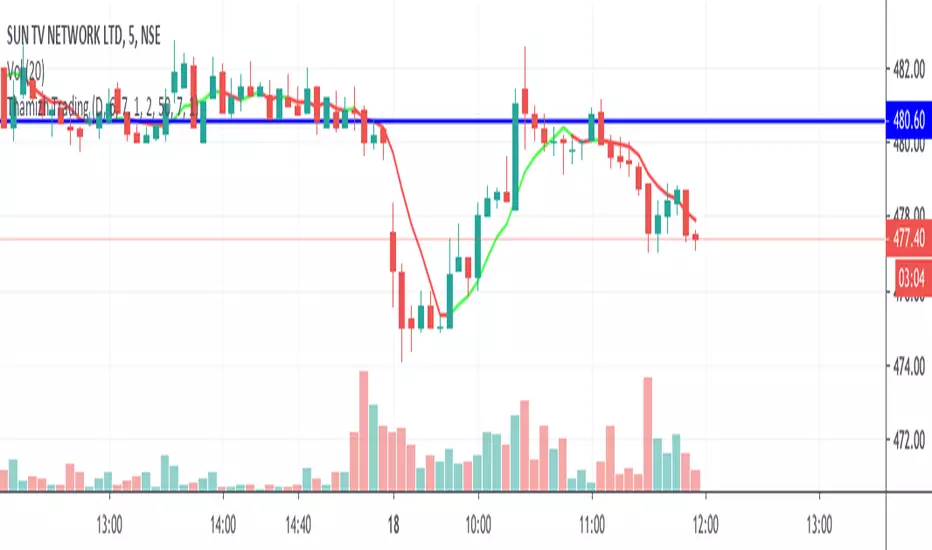
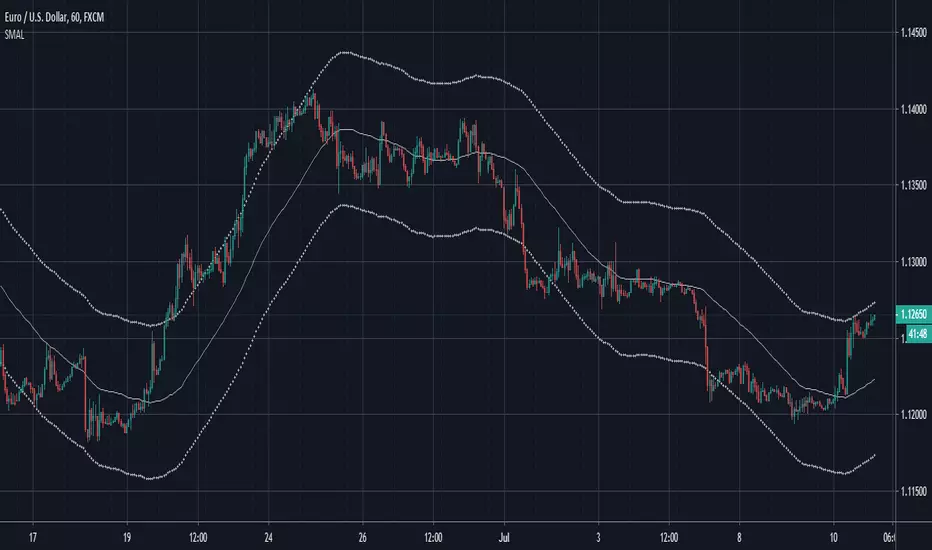
TMA Indicator v2.2This indicator is designed to show support and resistance at local extremes. Configurable SMA crossover events can be used to impart a bullish or bearish bias. This helps to reduce noise on the chart and increase profit factor. In other words, the indicator will only look for bullish breakouts if the fast moving average is above the slow moving average and vice-versa.
SMA Crossover events can be used to filter bullish or bearish resistance levels.
SMA Crossover events can be used to filter bullish or bearish breakout alerts.
Supports alerts for entries and exits based on breakouts of local extrema.
Alerts can be generated at every breakout or with SMA crossover filtering active.
Backtests would suggest that filtering with SMA crossovers often yields slightly lower profit but with a considerable improvement to profit factor.
Green/Red indicates long/short entry
Yellow/Orange indicates long/short exit
See here for an example backtest and visualization of active SMA signal filtering:
For paper trading only. Do not use on real markets. Never make investment decisions based on this indicator alone.

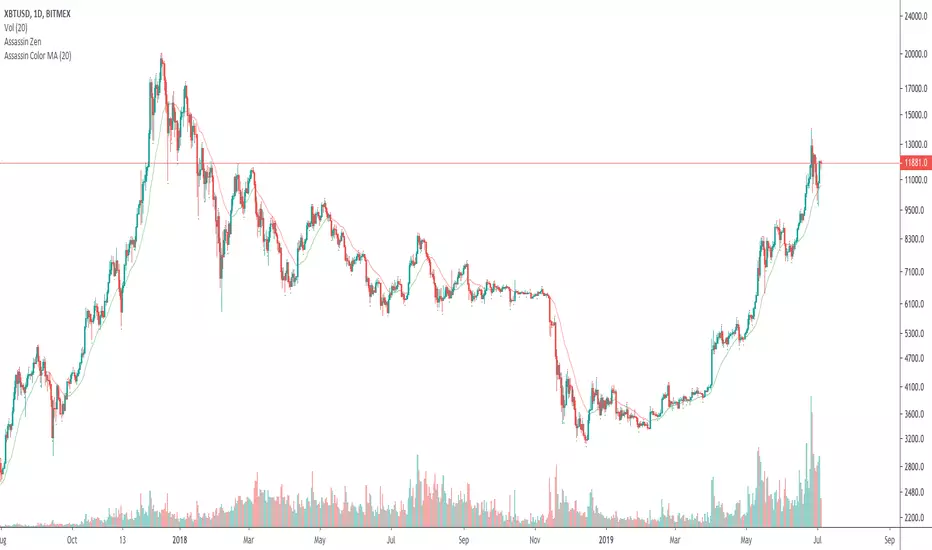
TMA Indicator v2.1This indicator is designed to show support and resistance at local extremes.
Indicator can be configured to filter out bullish vs bearish resistance levels based on configurable parameters.
Supports alerts for entries and exits based on breakouts of local extrema.
Green/Red indicates long/short entry
Yellow/Orange indicates long/short exit
Backtest window: Jan 1, 2015 - Jul 21, 2019 (today)
For paper trading only. Do not use on real markets. Never make investment decisions based on this indicator alone.


Crypto Investidor Setup Indicador Consiste em
EMAs Crypto Investidor - 17 / 34 / 72 / 100 / 200
MAs - 21 / 50 / 100 / 200
Bollinger Bands 2
Bollinger Bands 3
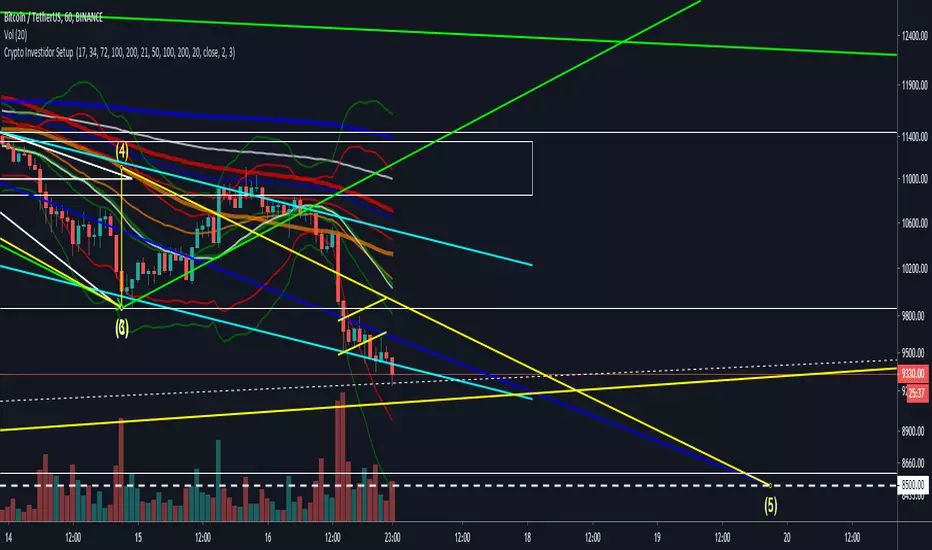
Crypto Investidor EMA e MA Crypto Investidor EMA e MA consiste em um conjunto de 4 EMAs de 21 / 50 / 100 / 200 períodos e também 4 MAs de 21 / 50 / 100 / 200, criado para facilitar o entendimento dos nossos seguidores, a ponto de poder verificar no gráfico tanto as Medias Móveis Exponenciais, quanto as Medias Móveis Simples. Um excelente indicador para quem utiliza o tradingview free.


Didi+EMA200+Bollinger Bands-FRAGAHelps those are using Basic Account / limited indicators
by Will Fraga
@traderzonebr
Angelleal Trading Suite v0.2.0This script is built to condense the main indicators or levels i use for my strategy.
Support & Resistance
Draws the support and resistance levels on the current timeframe, with labels for the latest S/R formed.
The levels change color to reflect a role reversal depending on price action.
The number of bars used to confirm the formation of a new S/R level are configurable, but the default values are:
30 bars to check before a new level
15 bars to check after a new level
5 bars used for early detection
Moving Averages
The script uses 3 Moving Averages to calculate trend direction and posible dynamic supports and resistances for the trend.
Aditionally a couple of bands are drawed around the Medium Length moving average in conjuction with the ATR to account for
the volatility of the instrument.
The default values for the moving averages are:
Short MA Length - 7
Medium MA Length - 30
Long MA Length - 360
ATR Multiplier for narrow band - 1.2
ATR Multiplier for wide band - 3.6
Note: Most of the default values are set taking into account the Daily timeframe and natural divisions in it such as weeks, months and years. These values work well in other timeframes but might be adjusted
to get a better fit to the desired market and timeframe