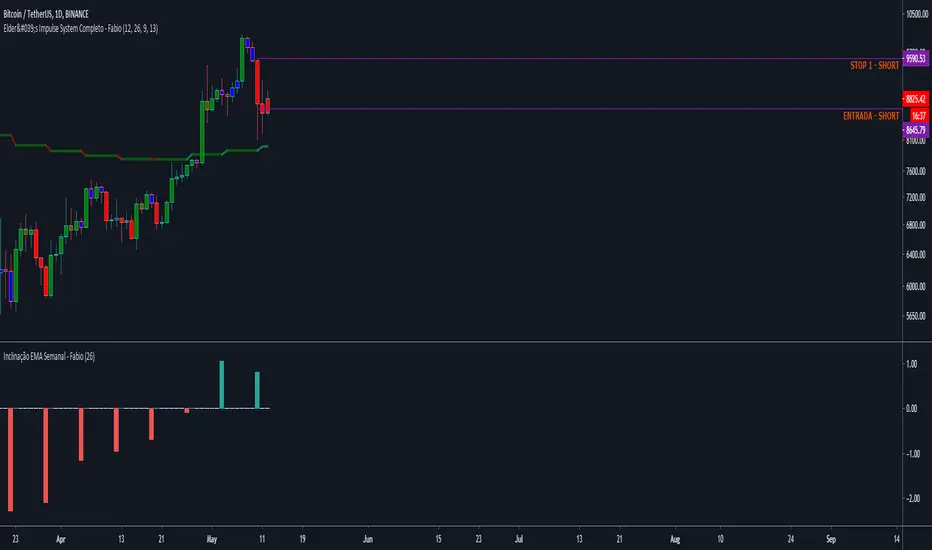
EMA Slope - ValenteThis indicator will show you the EMA SLOPE as a HISTOGRAM.
Este indicador mostra a INCLINACAO da EMA como um HISTOGRAMA
Slope

EMA Slope Trend Follower StrategyThis strategy is based on the slope of the EMA130.
Over that slope, the script calculates two EMAs (9,21) which are used to generate the main entry and exit signal.
In particular, the strategy enters a LONG position when EMA9 > EMA21. On the contrary, it closes the LONG and opens a SHORT when EMA9 < EMA21.
When the slope of the EMA130 is rising, it means that the price is accelerating upwards, fueling an uptrend. Conversely, when the slope is falling, it means that the price is slowing down, falling into a possible downtrend.
Calculating and analyzing two EMAs (fast and slow) over the slope of a medium length EMA instead of the price anticipates a lot the signal. In this way, the strategy never miss a trend.
In order to minimize false positives (entering useless positions), I included two filters, which can be optionally turned on:
- Trend Filter: When the price is above EMA200, the strategy opens ONLY LONG positions. If price < EMA200, only shorts allowed. If the slope gives a long signal and price is below EMA200, for example, the eventual SHORT position is closed, but the LONG entry is postponed to the moment when both conditions (slope uptrending and price > ema200) are met.
I recommend always turning on this filter, as it dramatically decreases drawdown.
- Volatility Filter: When the standard deviation of the last 20 candles is below its 50 samples moving average, no positions are opened, as market is going sideways. The purpose of this filter is to prevent false positives (positions which open and close in a matter of candles due to false signals in sideways market).
I recommend turning on this filter only on low time frames.
This strategy works great on medium time frames (like 4h, 6h, daily), since it spends way less in fees, opening less positions.
It works good on low TFs too (up to 1h, didn't test lower ones), provided Volatility filter is turned on and parameters are set according to the asset.
Commission included in calculations: 0.06% (it's the taker commission on BitMEX with the 10% discount obtainable with any referral link)
Slippage included in calculations: 2 ticks (BitMEX has very liquid order books, and slippage doesn't happen very often unless a huge position size is used).

Leavitt Convolutions Multicator - Jay Leavitt, Ph.D.Hot off the press, I present this next generation "Leavitt Convolutions Multicator" employing PSv4.0, originally formulated by Jay Leavitt, Ph.D. for TASC - January 2020 Traders Tips. Basically it's an all-in-one combination of three Leavitt indicators. This triplet indicator, being less than a 60 line implementation at initial release, is a heavily modified version of the original indicator using novel techniques, surpassing Leavitt's original intended design.
Utilizing the "Power of Pine", I included the maximum amount of features I could surmise in an ultra small yet powerful package. Configurations are displayed above in multiple scenarios that should be suitable for most traders.
Features List Includes:
Dark Background - Easily disabled in indicator Settings->Style for "Light" charts or with Pine commenting
AND much, much more... You have the source!
For those of you who are new to Pine Script, this script may also help you understand advanced programming techniques in Pine and how they may be utilized in a most effective manner. Most notably, the script shows how to potentially combine three indicators in one with Pine. This is commonly what my dense intricate code looks like behind the veil, and if you are wondering why there is no notes, that's because the notation is in the variable naming.
The comments section below is solely just for commenting and other remarks, ideas, compliments, etc... regarding only this indicator, not others. When available time provides itself, I will consider your inquiries, thoughts, and concepts presented below in the comments section, should you have any questions or comments regarding this indicator. When my indicators achieve more prevalent use by TV members, I may implement more ideas when they present themselves as worthy additions. As always, "Like" it if you simply just like it with a proper thumbs up, and also return to my scripts list occasionally for additional postings. Have a profitable future everyone!

[RS][V4]ZigZag Percent Reversal - Helper - AntiSlopeEXPERIMENTAL:
A helper script to map the Anti derivative slopes.
EMA slopeA very simple script to get the slope of the EMA.
Can be used together with "Inverse Volatility" and "Support Resistance IV Finder" for optimal results

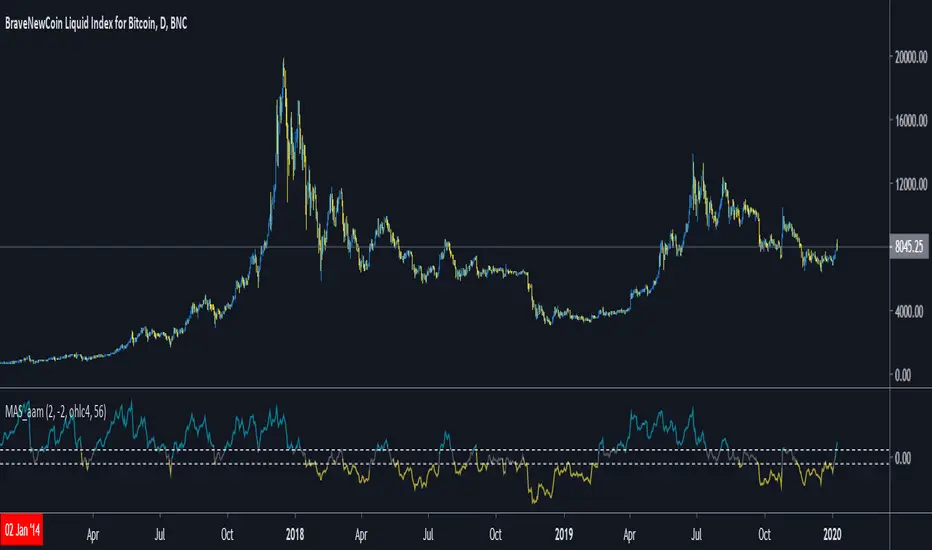
Moving Average Slope [aamonkey]This indicator tries to identify ranging and trending markets.
It measures the angle of a Moving Average in order to filter out ranging markets.
The idea is to only enter a trend following trade if the slope is steep enough.
In order to create this indicator, I used a strategy script from bennef called "Trend Angle BF" and slightly modified it to transform it from an entry/exit indicator to a filter.
The calculations are based on Evergrets "Jurik MA" and angle calculation by KyJ.
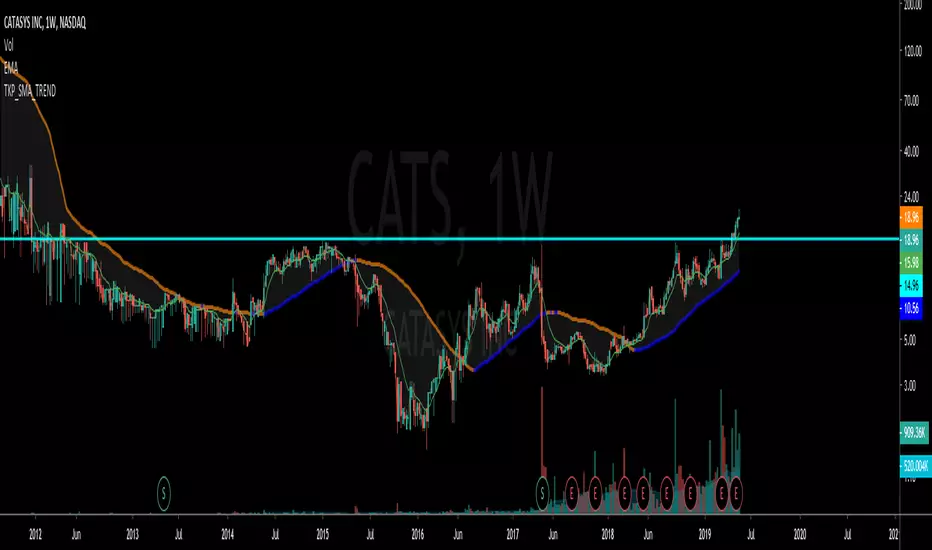
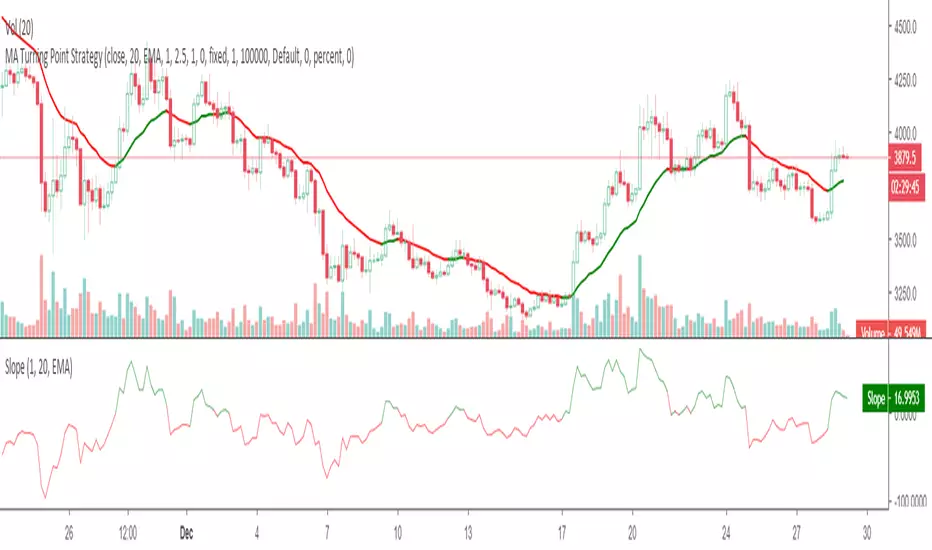
SMA_TKP_TREND SYSTEMI took the "EMA_TKP_TREND SYSTEM" and converted it to plot a simple moving average for the "slow moving average".
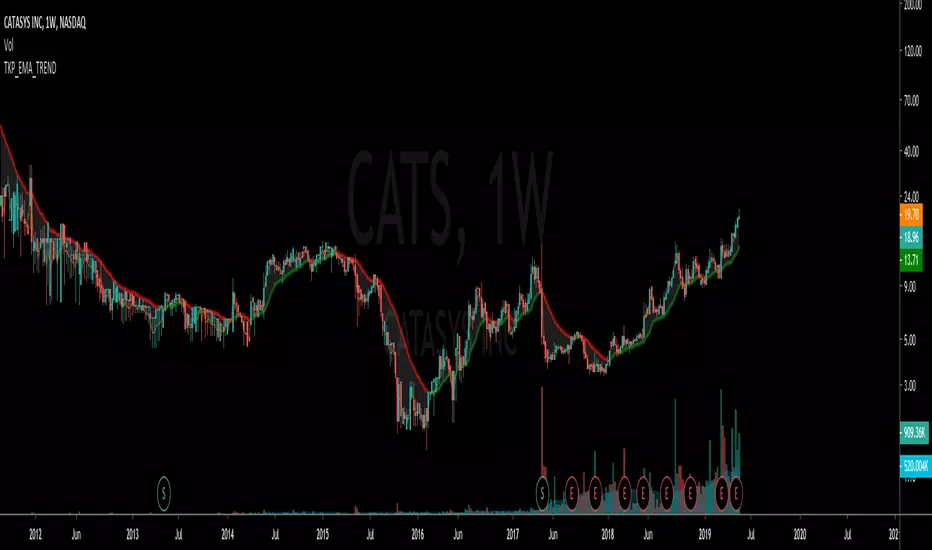
EMA_TKP_TREND_ SYSTEMThis script was cannibalized by another member on here (Kudos given in Script). I trimmed down the script and created this to give a visual representation of the changing slope on exponential moving averages.
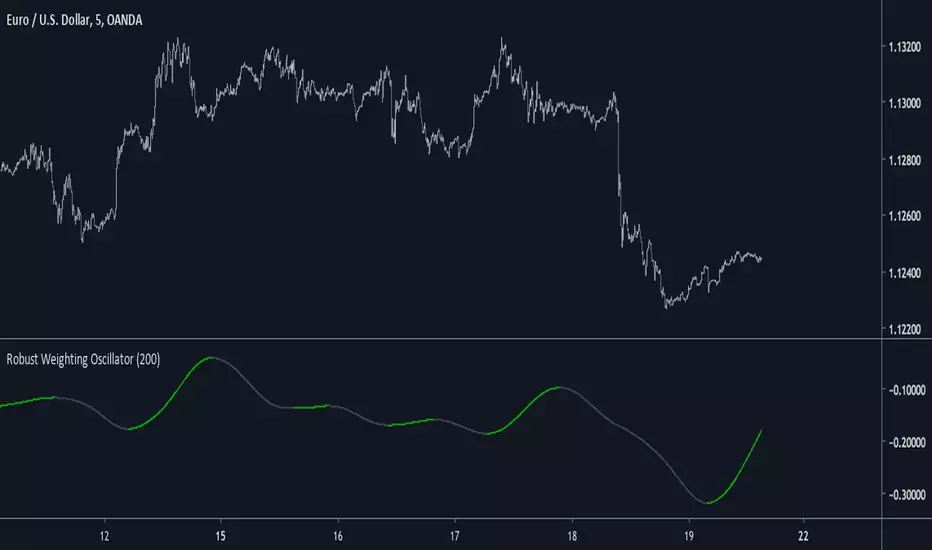
Robust Weighting OscillatorIntroduction
A simple oscillator using a modified lowess architecture, good in term of smoothness and reactivity.
Lowess Regression
Lowess or local regression is a non-parametric (can be used with data not fitting a normal distribution) smoothing method. This method fit a curve to the data using least squares.
In order to have a lowess regression one must use tricube kernel for the weightings w , the weightings are determined using a k-nearest-neighbor model.
lowess is then calculated like so :
Σ (wG(y-a-bx)^2)
Our indicator use G , a , b and remove the square as well as replacing x by y
Conclusion
The oscillator is simple and nothing revolutionary but its still interesting to have new indicators.
Lowess would be a great method to be made on pinescript, i have an estimate but its not that good. Some codes use a simple line equation in order to estimate a lowess smoother, i can describe it as ax + b where a is a smooth oscillator, b some kind of filter defined by lp + bp with lp a smooth low pass filter and bp a bandpass filter, x is a variable dependent of the smoothing span.
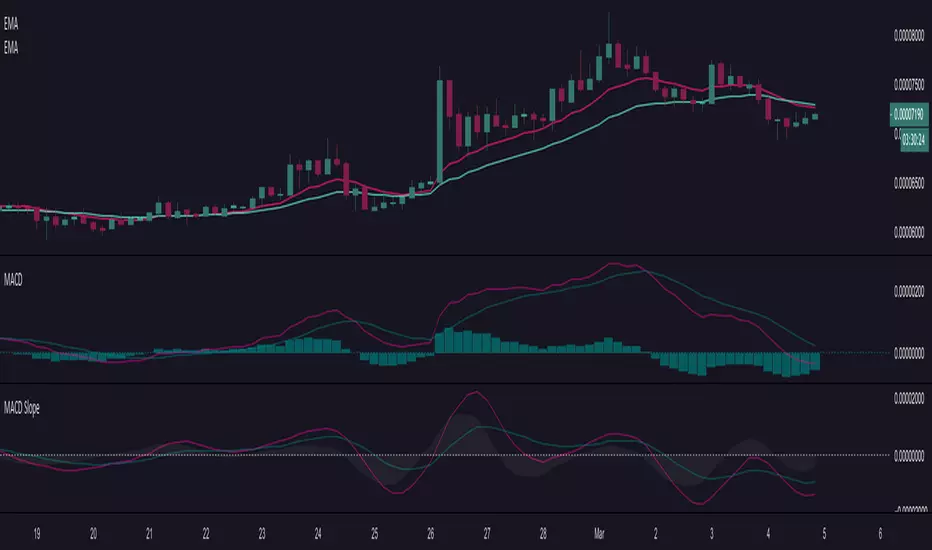
MACD SlopeShows slopes of macd line, signal line and histogram. A negative and rising slope shows improvement within a downtrend. A positive and falling slope shows deterioration within an uptrend.
Function for Least Squares Moving AverageThank you to alexgrover for putting me wide to this, after putting up with long conversations and stupid questions. Follow him and behold: www.tradingview.com
What is this?
This is simply the function for a Least Squares Moving Average. You can render this on the chart by using the linreg() function in Pine.
Personally I like to use the slope of the LSMA to help determine what direction to take a trade in, but I'm sure there are other, more exotic ways of using it and, if you know how to get your fingers dirty with Pine, you can create more exotic versions of it by modifying the function provided.
Want to learn?
If you'd like the opportunity to learn Pine but you have difficulty finding resources to guide you, take a look at this rudimentary list: docs.google.com
The list will be updated in the future as more people share the resources that have helped, or continue to help, them. Follow me on Twitter to keep up-to-date with the growing list of resources.
Suggestions or Questions?
Don't even kinda hesitate to forward them to me. My (metaphorical) door is always open.

SlopeA simple slope indicator of common moving average types with the slope represented in degrees aligned with the trend angle tool on TV after reset chart.
Artemis Linear Regression Slope MACD by ZekisA good indicator for TA based on a smoothed Linear Regression and displayed in two ways, as histogram and as a crossover lines
The histogram shows a better view of the trend
The lines confirms the trend when the crossover is happening
Alerts are added
Enjoy!
@ Zekis

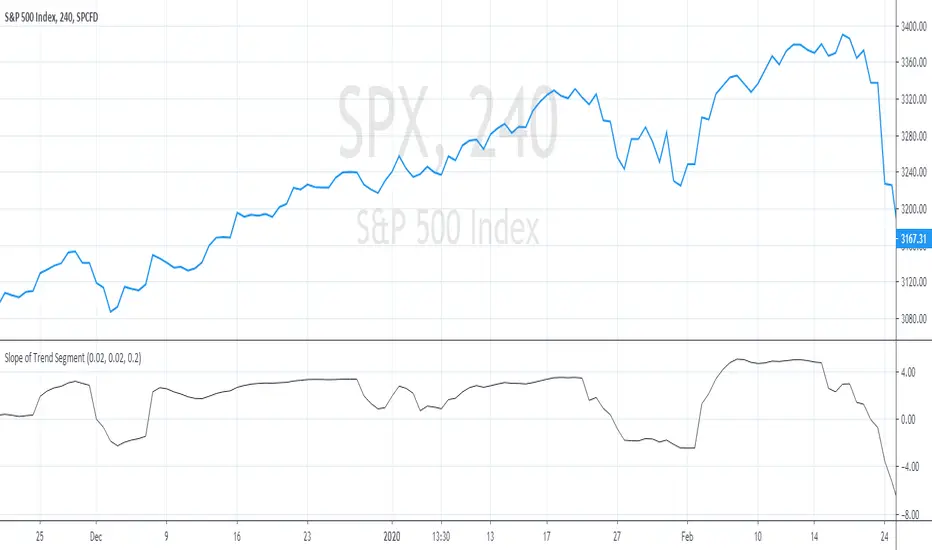
Quadratic Regression Slope [DW]This is a study geared toward identifying price trends using Quadratic regression.
Quadratic regression is the process of finding the equation of a parabola that best fits the set of data being analyzed.
In this study, first a quadratic regression curve is calculated, then the slope of the curve is calculated and plotted.
Custom bar colors are included. The color scheme is based on whether the slope is positive or negative, and whether it is increasing or decreasing.

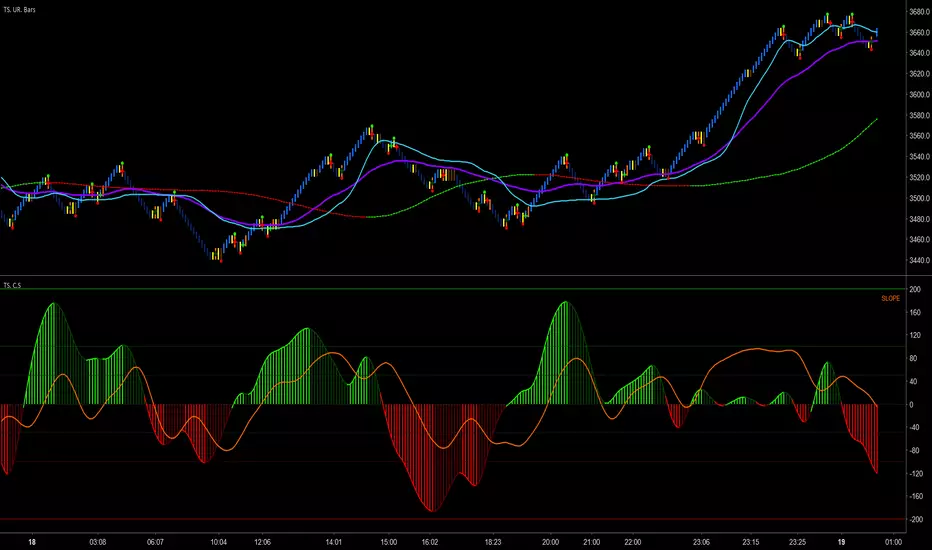
Trader Set - CCI Slope ComboThis is an oscillator that I was doing R&D for developing it, it took near three weeks. If you ever use Super CCI and keep it side by side with slope oscillator, in more than few cases, day in day out, you would find that both of them show similarities. These similarities suggest that there should be a way to combine these two and get a unique indicator that would do both jobs at the same time without the complexity of CCI and WITH simplicity of Slope!
The answer for the R&D was in ehlers books. Well, not the formulas he gave to the world but the concept! Here is a combination behavior of CCI and Slope, if you ever drop ehlers Universal Oscillator near this, you would see where the concept came but they are totally different in look and behavior.
Please don't contact me for access. This is part of my personal methodology that I teach to my students and soon, the English section of my website will be ready with English course for the methodology. When the course is ready I will announce it under every related indicator and those who participate will have access to these indicators.
Woodies SlopeThis is one of the few original things from woodie (At least I Hoope so lol). The slope indicator shows the direction of price movement, the possible future of market's movement, and beside them, it shows which side of the market has the power right now.
This indicator can be switched to use a smoothed version of RSI that is customized too.
Please, don't ask for access, only my students from my classes will have access to this indicator, at least for time being. If at any time in future I wish to sell, you will find the price and how to buy in the comments bellow.

MACD of Linear Regression Slope Indicator I used MACD to find peak and trough points in the Linear Regression Slope

IO_EMA_Delta_OscillatorThis is a EMA Delta Oscillator: An attempt to show ranging markets based on the slope of the EMA.
Green = Bullish Market
Blue = Ranging Market
Red = Bearish Market
The EMA Slope is normalized to make it work like an oscillator with values between 0 and 1.
Bar colors show the oscillator colors, bar borders show the actual candle colors.
- Invsto
(sarangab)

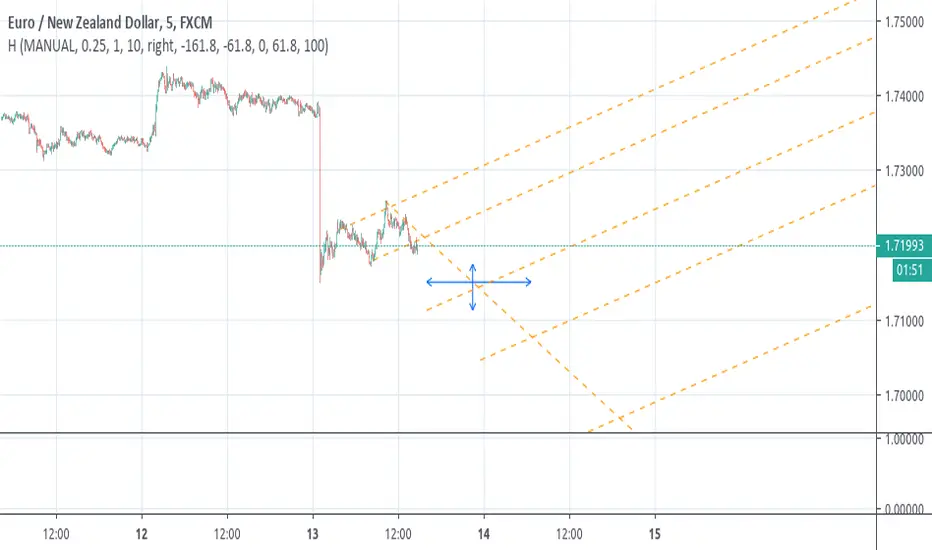
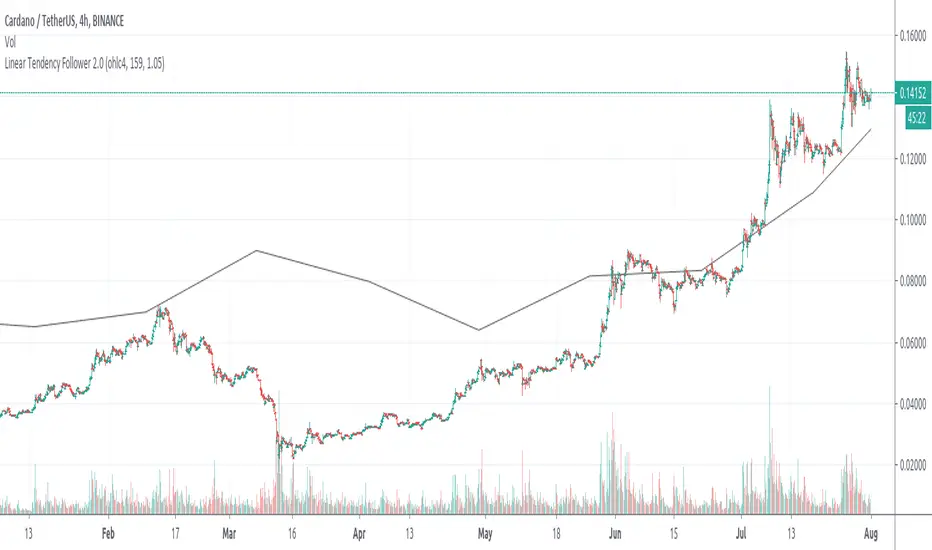
Linear Tendency FollowerLinear Trend Follower follows 'source' trend using lines within a number of periods ('length') using the last n periods source variation divided by 'length' as line slope. It is delayed by 'length' periods.
Ultimate LRS V2Version updates:
-Made visual modifications for simpler move identification.
-Updated algorithm and color scheme to identify potential areas of correction (gray zones).
-PM me for access.

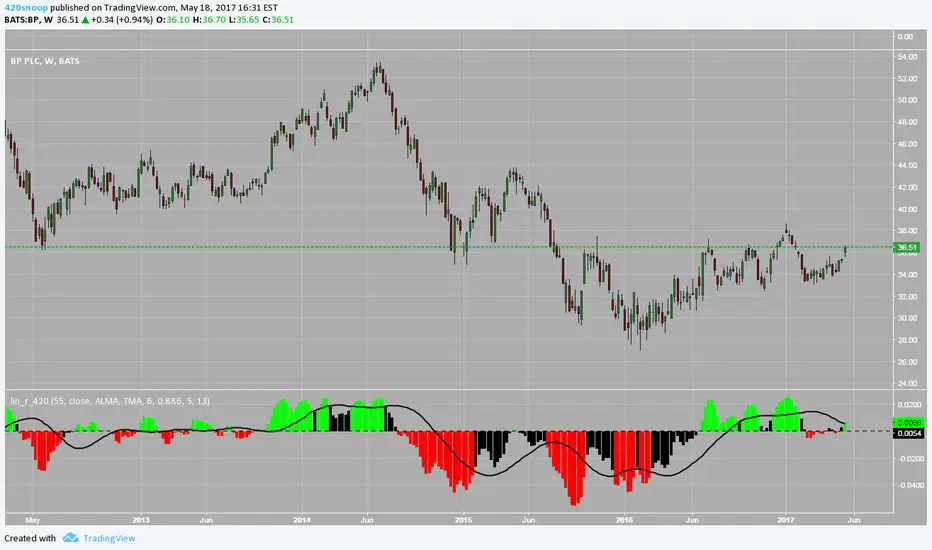
lin.reg.s_420Hey all,
Snoop here with another script this one is linear regression slope analysis;
I used a base skeleton script of /u/ucsgears before adding some other cumulative log filtering and average customization functions I like :)
If you have success with this script feel free to buy me a coffee through my bitcoin address :)
Appreciate the love I get from the community! Thanks all and happy trading!
-Snoop