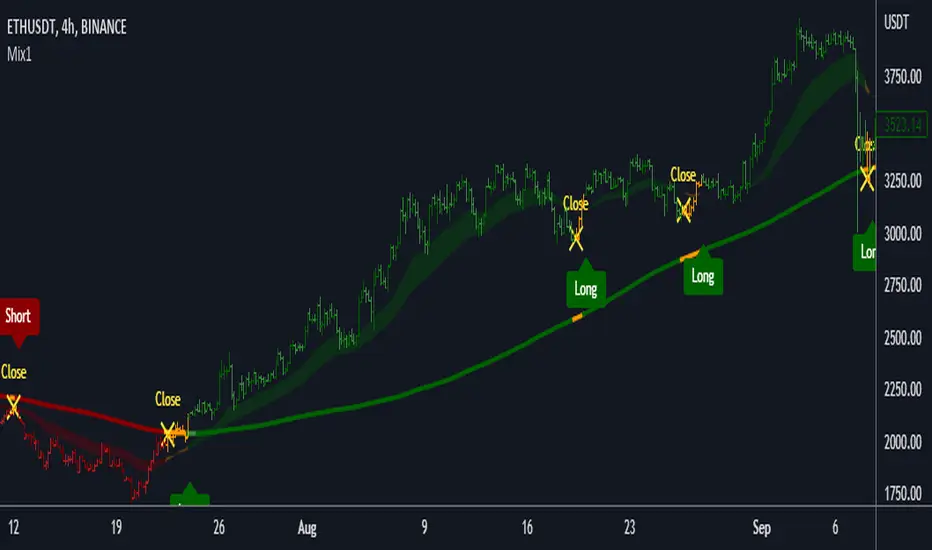
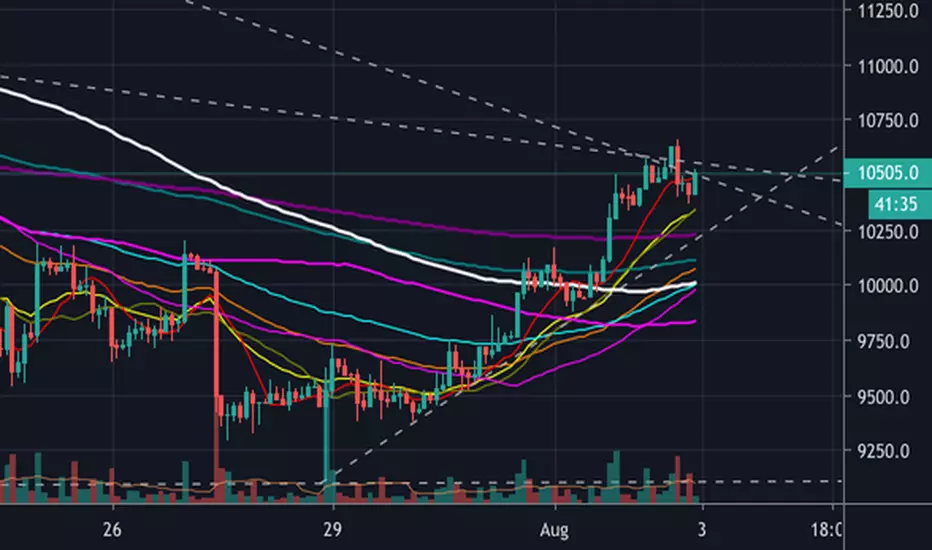
Mix1 : Ema Cross + Trend Channel [Gu5]Based on Trend Channel
Ema-crossover is added
Crossing alerts, only on trend
Basado en mi anterior indicador, Trend Channel
Se agrega Cruce de Medias Moviles (Ema-crossover)
Las alertas solo son en favor a la tendencia
El valor de SMA Range es arbitrario (No Backtesting). Cambia la amplitud de canal que determina cuando es rango (barras amarillas por estar muy cerca del SMA200, sin tendencia definida)
Range Multiplier adapta el indicador a distintos mercados
//Setting recommended for SMA Range
//BTCUSD = 100
//EURUSD = 1000
//SPX = 100
//ETHUSD = 10
Si te fue útil este indicador, puedes comprarme una cerveza ;)
Sma
2 Moving Average Color Direction Detection 2 Moving Average Color Direction Detection, possibility to configure:
- Type: SMA , EMA , WMA , VWMA , SMMA , DEMA , TEMA , HULLMA, ZEMA, TMA, SSMA
- Lenght
- Source
- Color direction

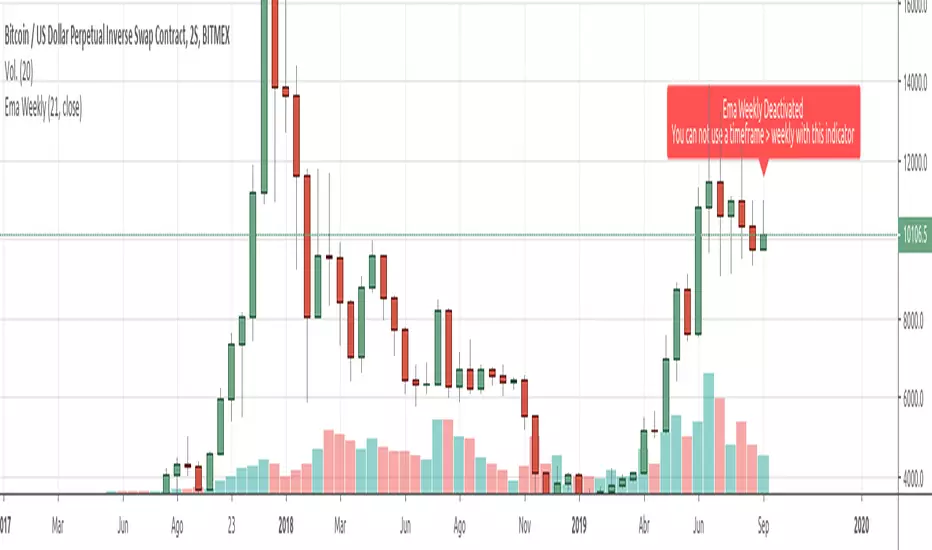
Ema Weekly In current TimeframeThis simple indicator shows the Ema with data extracted from weekly timeframe in your current displayed timeframe.
Due to Tradingview working restrictions, this indicator only works if is used in a timeframe lower (or equal) to one week, otherways shows an error red label showing this error.
All my scripts:
es.tradingview.com

ck - 10 MA Combo (5 EMAs, 5 SMAs)Yet another MA and EMA indicator.
These are my favourite presets & colour combos for Tradingview Dark Theme.
Enjoy!


Composite Movement Indicator w/ Volume-Weighted Balance of PowerThe CMI+ is a composite indicator based on numerous other indicators and some special sauce that helps identify imminent directional changes in an asset's price. While CMI+ was designed for crypto assets, it is also quite useful in traditional markets.

Multiple Moving AveragesThis is an indicator with 4 moving average slots and 6 exponential moving average slots
It also has bollinger bands and a volume weighted moving average slot
Feel free to edit this and add/remove some and publish your own
Candles [Meguru] MobileMulti-currency Indication For mobile "Candles[Meguru]Mobile"
The display of exchanges and major currencies has been made selective. (I thought about the use with a smartphone etc. and made it possible to omit the trouble of character input. It is also possible to enter manually.)
モバイル向け多通貨表示インジ『Candles[Meguru]Mobile』
取引所やメジャーな通貨の表示を選択式にしました。(移動時・スマホなどでの利用を考え、文字入力の手間を省略できるよう作成しました。手入力での設定も利用できます。)
反転チャート・時足の固定も可能です。
複数表示することで、多通貨を同時に表示・監視することもできます。
詳細、購入などはこちらにて
note.mu
Palex 2.0Atualização do SETUP do saudoso Professor Alexandre Fernandes "Palex"
- Bandas de Bolliger (Standard) =
*Banda Superior = Média Móvel Simples (20 dias) + (2 x Desvio Padrão de 20 dias)
*Banda Inferior = Média Móvel Simples (20 dias) – (2 x Desvio Padrão de 20 dias)
- EMA 9 (Média Móvel Exponencial)
- SMA 21 (Média Móvel Simples)
- SMA 200 (Média Móvel Simples) Clássica MA 200 períodos
- SMA 400 (Média Móvel Simples)
- EMA 400 (Média Móvel Exponencial)
- WILD (Média Móvel Welles Wilder)
O mesmo usado pelo nosso grande Mestre PALEX!
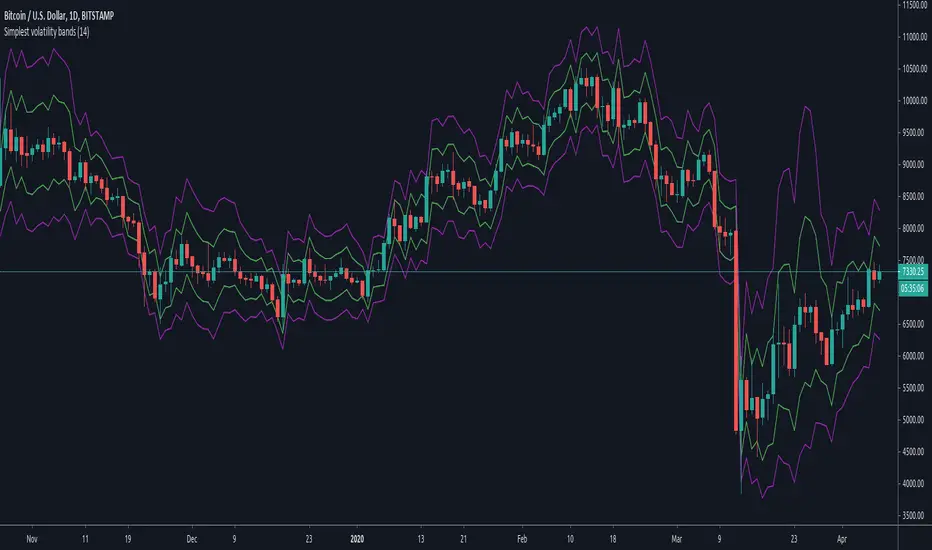
Simplest volatility bandsVolatility bands based on average candle percentage spread. Tested on BTCUSD charts only.
Based on the 68-95-99.7 rule, it seems that the spread, for daily and 4-H candles, follows a normal distribution: that means, around 85% of candles have a %-spread within sma(low/high, some_len) and sma(high/low, some_len) , and around 95% of candles within the pow2 of that range.
If you take the mean between the boundaries of the first %-spreads band, and calculate the 1.5 standard deviation of past some_len candles (I'm speaking from memory, it has been a while since I did them), the 1.5 standard deviation bands match similarly the %-spread bands, and around 85% of the candles are within these %-spread bands.
If you then take the pow2 of the bands, it will be similar to the 2 * std of the original bands, with around 95% of data within the pow2 bands.
You can take ema or other similar means with similar results, and the same for different lengths, but it seems that sma with a len of 14 is the more stable ones for both daily and 4-H, and taken other average calculations doesn't cause too many differences respect to the sma. I haven't tested too much for lower or higher timeframes.
With those %-spread bands, I multiple and divide those spreads to the open value of a new candle to get the two bands.
So, in short, you know that 85% of candles are within the closer bands, and around 95% of candles, around the bigger one. Once a new candle is born, the bands won't move (the bands are calculated from the previous candle, so the current candle's price movement doesn't move the band).
Going out the bands implies a sudden increase in volality, which usually causes rejection. They happen mostly at breakouts and ends of heavy trends. If a candle closes above the bigger band, you have probably got a breakout (a rejection rarely happens if the candle have already closed), although a breakout can happen without closing above the bands if volatility was already high.
If a trend is already stablished and is healthy, you won't probably see candles going out the bands, not even with a wick. When the trend is parabolic, and goes above the candle, the trend has probably ended, although the trend can be exhausted without going out the bands as well.
Heavy but not yet exhausted trends (specially recently started heavy downtrends), usually reach the bottom of the bigger bands during 4 o 5 contiguous candles (check visually looking at bitcoin history though, I'm speaking from memory).
So, the possibilities are multiple and you cannot use the bands to form a strategy, as usual. It can be comfortable enough psycologically for going to sleep, by moving your stop-loss to a point out of the bands in the opposite direction of your trade, and adjusting your position size accordingly; or just to check momentum looking at how close are the candle limits to the bands.
But, as usual, you are responsible of what you do with your money :)
Adaptive Momentum Oscillator(AMO)Here is a new experimental indicator that we've been developing that is focused on gauging momentum.
The indicator fluctuates above and below zero, but instead of using zero as the threshold for differentiating positive and negative momentum, it uses an 89 period median(plotted as the thick white line).
The momentum over the previous 10 periods is then calculated and then smoothed using a 6 period Exponential Moving Average (EMA). This, as well as the choice to use a median as the central divider were done to eliminate the whipsaws that are often generated when making strategies based on pure momentum and crossings above/below 0. The EMA alternates between lime green when it is above the median and pink when it is below. The area between the EMA and median is filled in green when EMA > median and pink when the EMA is less than the median.
Then, a 29 period Simple Moving Average of momentum is calculated. Here, going with a SMA over EMA and a longer window(29) seemed to make sense as it is counteracts the high responsiveness of the EMA. The SMA is green when greater than the median and red when less than the median.
There's two ways to trade using this system. One way would be to go long when the momentum EMA crosses over the white median line and turns lime green, then short when it crosses back under the median line and turns white. Another option is to go long under the same conditions, but short when both the EMA and SMA are above the median and the EMA crosses under the SMA.
Not sure if this exact configuration has already been created by someone, but it'll be interesting to see how it holds up with more backtesting and then running it fully automated.
-Strategy version coming soon-

VWAP + SMA + EMA3-in-one indicator, for swing and intra-day trading, which includes
Simple Moving Average (SMA)
Exponential Moving Average (EMA)
Volume-Weighted Average Price (VWAP)

Five EMA and Two SMA IndicatorIndicator Modeled After Krowns CrptoCave
-CryptoLumberJack
-BlazkingCryptoJunkies Web Slave Master

SMA 50 collector V2Hi everyone
The today script is an upgrade on steroids of my previous SMA 50 collector
Why this script ?
The SMA 50 is known to define a trend. If price is closing above, trend is bullish , if below, trend is bearish.
That's why I like to have all of them in all timeframes on my chart :)
Those are very relevant for all assets class : FOREX, INDEX, STOCKS, CRYPTO, ...
What's the update ?
I added new timeframes and developped a small optimization to get those labels placed on the right hand side of your screen.
"Is it really useful sir ?" Well, you certainly noticed that looking at a chart on tradingview mobile is not ideal (indicators overlapping, indicator names taking too much space and so on...)
When you'll deactivate the indicator name label display from tradingview, you can activate mine which will look way nicer on your mobile (and even Desktop).
This concept was greatly inspired by @scarf :
HOW TO USE IT ?
You can activate/deactivate the SMA50 you (don't) need in the style section of the indicator configuration UI. You'll just have to uncheck/check. Simple right :) ?
See y'all tomorrow for the next indicator or idea. The one for tomorrow should blow your mind as it certainly did when I discovered and optimized it
Enjoy
Dave

Crypto Investidor EMA e MA Crypto Investidor EMA e MA consiste em um conjunto de 4 EMAs de 21 / 50 / 100 / 200 períodos e também 4 MAs de 21 / 50 / 100 / 200, criado para facilitar o entendimento dos nossos seguidores, a ponto de poder verificar no gráfico tanto as Medias Móveis Exponenciais, quanto as Medias Móveis Simples. Um excelente indicador para quem utiliza o tradingview free.

SMA collector MTF ForecastHello everyone
Here's the today indicator
That one is a true gift before X-mas. X-mas in July which bundles a lot more than what Santa Claus will offer you in December :)
So without further due, let's dive right in
This indicator will display the following algorithmic SMA :
SMA 20 Daily
SMA 50 Daily
SMA 50 Daily
SMA 100 Daily
SMA 200 Daily
SMA 20 Weekly
SMA 50 Weekly
SMA 100 Weekly
SMA 200 Weekly
SMA 7 Monthly
SMA 20 Monthly
SMA 50 Monthly
Those SMA usually work as big supports/resistances for all tradable assets (forex, index, crypto, stocks, ...)
That's it for the first feature, let's cover the next one
2/ I developped a small optimization to get those labels placed on the right hand side of your screen.
"Is it really useful sir ?" Well, you certainly noticed that looking at a chart on tradingview mobile is not ideal (indicators overlapping, indicator names taking too much space and so on...)
When you'll deactivate the indicator name label display from tradingview, you can activate mine which will look way nicer on your mobile (and even Desktop).
This concept was greatly inspired by @scarf :
3/ Now the cherry on the top of the cherry on the top of the.... cake
You'll have the cool option to display the forecasts for those SMAs based on either current price "flat" or a 3 period liner regressions "linreg".
You can play out with the forecasts options and find out which ones will make the most of sense to you
They're represented by small dots at the very right of the moving averages
This concept was greatly inspired by @yatrader2 :
That's a lot to digest but hope it went smoothly
As always if you have any question or feedback or complain or you want to show me some love (please), shoot it in the comments section
See y'all tomorrow for another indicator
Enjoy
Dave

The Mango Ribbon The Mango Ribbon is a convenience indicator which encompasses a combination of moving averages combining those of exponential and Ichimoku averages. I will be updating this indicator with more features as time passes.
Hope you enjoy. For access, simply pm me on Telegram (porco1x) or use the sign up form at mangoresearch.co

Czarlieron's Multiple MA's w/ BBThis script contains:
Multiple EMA's (8, 13, 21, 34, 55, 100, 200)
Multiple SMA's (8, 13, 21, 34, 55, 100, 200)
Bollinger Bands
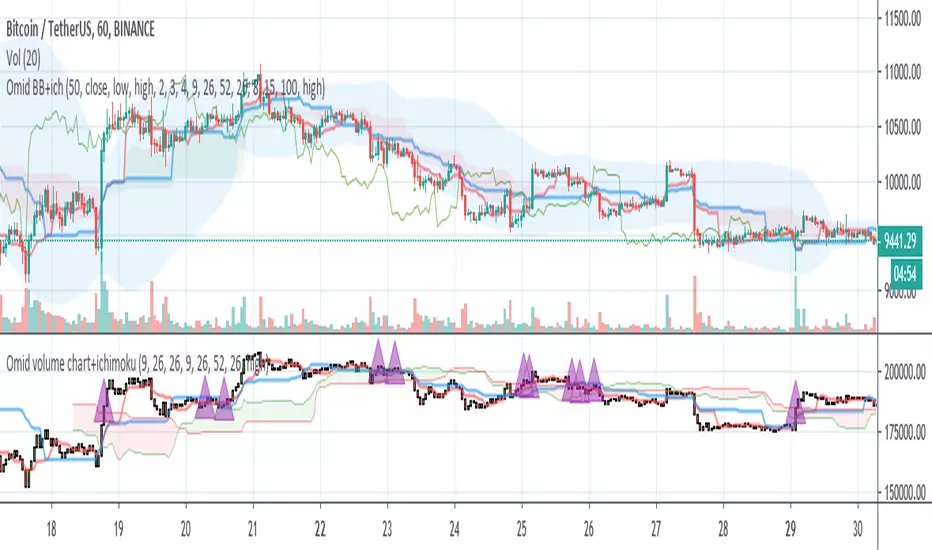
Omid Bollinger Band + ichimokuwith some signals for buying and selling with below method
3 bollinger band ( len 50, div 2,3,4)
EMA 8,15,100
SMA 5,20 with rsi
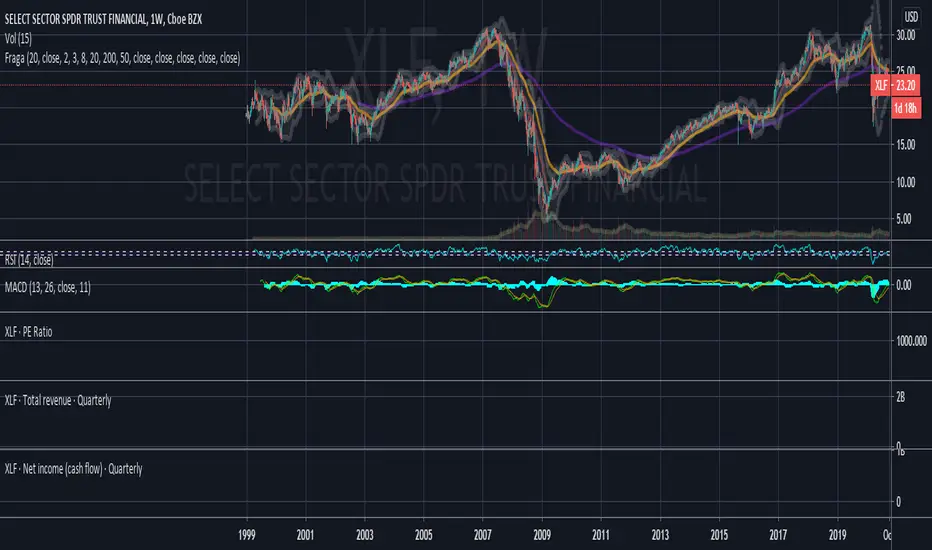
Didi+EMA200+Bollinger Bands-FRAGAHelps those are using Basic Account / limited indicators
by Will Fraga
@traderzonebr