Smart EMA SignalsThis indicator starts by plotting each time the price action crosses above or below the EMA, of which you can tune the timeframe and duration.
It then takes it a step further and plots whether or not that indicator would have given you a profitable trade, of which you can also tune the parameters (Max wait time, and % Profit).
Once you have your EMA tuned to your liking, set up alerts to notify you of a golden opportunity.
Smart

Smart Money Index (SMI)It came to my attention that one very common implementation of SMI was incorrect; rather than subtracting the first hour delta and adding the last hour delta it subtracts the whole day delta and adds the last 30m delta. While this indicator might have had some use, it is not what I understand to be the actual Smart Money Index and so I post this as a correction for use in other scripts.
[LunaOwl] 智慧型RSI (Smart RSI - a handy tool with less noise)Relative Strength Index is a common technical analysis tool, it is classified as a momentum oscillator, measuring the velocity and magnitude of directional price movements. it is most typically used on a 14-period timeframe, measured on a scale from 0 to 100, with high and low levels marked at 70 and 30.
相對強弱指標是常見的技術分析工具,它被歸類為動量振盪器,用於測量定向價格運動的速度和幅度,通常會使用14期數,擺盪範圍在0到100間,超買超賣分別標記成70、30。
after simple improvement and addition of logical judgment, it becomes a passive judge from subjective judgments, avoid the shortcomings of peoples in watching passivation, and the trade can be more consistent.
經過簡單的改良與添加邏輯判斷,能夠使RSI指標的使用,從主觀的判斷成為被動的確認指標,有效避免人們判斷指標鈍化的主觀缺失,並能夠使得交易更加一致。
--------------------------*
1) parameter
RSI period 1 - default is 14, same as general RSI.
RSI period 2 - default is 5, due to its own formula, the amplitude of the oscillator will become larger and more agile or fast. When the parameter is small.
exponential moving avg of RSI - using the result of RSI period 1 as the source of Ema's formula, the default length is 14, which can filter the excessive agility of RSI period 2 to reduce noise, and compared to using the baseline as the criterion for long and short judgments, The characteristics of exponential moving avg are more suitable to become flexible filtering standards.
Overbought - default is 70, you can set your overbought level.
Oversold - same as above, the default is 30.
2) Options
Open Candle color(開啟蠟燭線趨勢) - choose whether to start the color of the candle.
Open background color(開啟指標背景色) - the default is false, you can turn on.
--------------------------*
1. 設置參數
RSI期數1:預設值是14,是普通的RSI指標。
RSI期數2:預設值是5,由於RSI公式的算法,造成參數愈小擺盪幅度就會變大,反應比較快。
指數平均化的RSI期數1:將RSI期數1的結果帶入指數移動平均公式,預設值14,它能過濾RSI期數2過度敏捷的缺點,減少雜訊,相較於單純使用基準線作為多空判斷標準,用EMA的判斷標準更加因時制宜。
超買線:預設值是70,可以隨意調。
超賣線:預設值是30,一樣的。
2. 設定選項
開啟蠟燭線趨勢:顧名思義。已經幫您開好了。
開啟指標背景色:顏色太淺的話可以調深一點。
--------------------------*
ver.2- adjust new style design and create two options.
修改2: 調整新的樣式設計與建立兩個選項。
--------------------------*
ver.3- Create alert condition. maybe I should refer to the Alert Creation Framework,
there is also room for improvement.
修改3: 建立快訊選項。我應該參考警報創建框架,還有進步空間。
--------------------------*
Indicator Style - 指標樣式
The design uses casual light color style, light gray between overbought and oversold.
--------------------------*
Market Example - 市場範例
1. Bitcoin/Tether, Binance, 1 day
2. Bitcoin/USD, Coinbase, 4 hour
3. EUR/USD, Forex Market, 4 hour
4. GBP/USD, Forex Market, 30 min
5. TAIEX, Taiwan SE Weighted Index, 1 week
--------------------------*
postscript - 後記感想
The purpose of publishing Chinese Scripts is to make Pine close to more Chinese user.
I hope English skills enhancement...staggered writing makes me feel hard.
發布中文腳本的目的,是希望可以讓 Pine 親近更多中文圈的使用者。希望我的英語進步,中英文交錯撰寫有一些困難。
--------------------------*
If you find my works useful, you can give me encouragement. I can buy more books to sophisticated themselves.
如果您發現我的作品有用,可以給我鼓勵。讓我可以買更多書籍來精進自己。

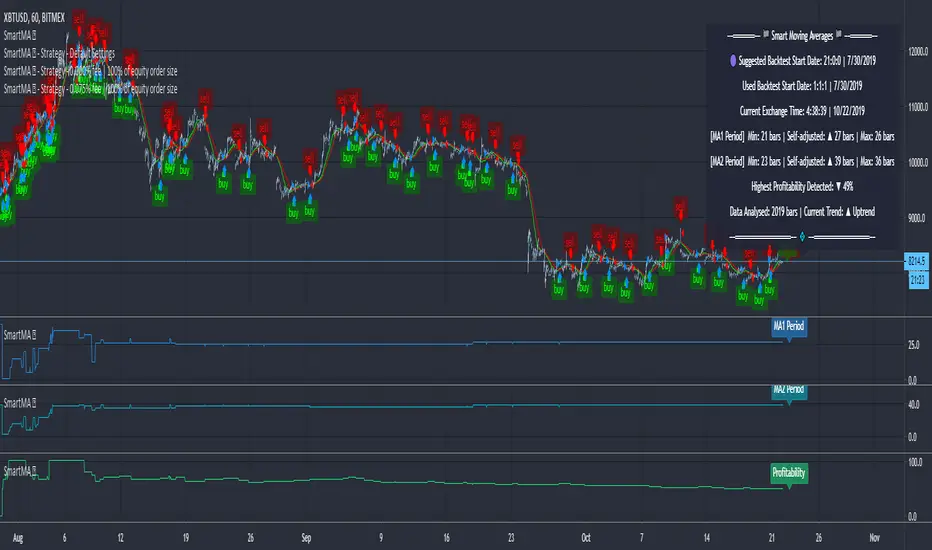
Moving Averages (Self-Adjusting Param for Highest Profitability)Moving Averages (Self-Adjusting Parameters for Highest Profitability)
It is a dual moving average crossover system - Smart Moving Averages .
Moving averages are used to identify current price developments and the potential for a change in an established trend.
The crossover in a dual moving average system can be used as a trigger to buy or to sell an asset, or as a trend reversal indication.
The crossover occurrence depends on the periods for which the moving averages are calculated. Using constant period values may not bring the best results.
The Smart Moving Averages change their periods automatically to get the highest profitability .
The concept is similar to the Smart SuperTrend .
Features:
• Self-Adjusting Period parameters
• The graphs for Profitability, Moving Average 1 Period, Moving Average 2 Period and the Moving Averages themselves are available to choose for display from the indicator settings
• A chart layout can be made just for the Smart Moving Averages, having all the graphs nicely displayed
• Alerts for changes in Trend, Moving Average 1 Period, Moving Average 2 Period, Profitability
• Different types of Moving Averages are available to choose from in the indicator settings (SMA, EMA, RMA, WMA, VWMA, DEMA, TEMA, HullMA, TMA).
The range for Moving Average 1 Period, Moving Average 2 Period and Time can be changed in the indicator settings (suggested optimal values are displayed on the chart).
This affects the loading speed (smaller range, faster to load), as well as the accuracy of the signals.
The indicator switches to the most profitable Moving Average 1 Period and Moving Average 2 Period parameters automatically, in real-time.
It scans across the entire historical data made available by TradingView.
The Smart Moving Average system works on all timeframes and symbols available on TradingView.
Exception for when the Volume Weighted Moving Average is used - it doesn't work for symbols without volume data.
It does not repaint!
But several aspects must be considered:
- 1. TradingView periodically removes access to old data while giving access to new data in real-time.
____ The frequency depends on the timeframe, amount of data. It can happen daily for second charts, weekly for minute charts.
____ Since the Indicator wouldn't have access to that old data anymore, the Profitability may change its value, causing a certain degree of repainting.
- 2. The starting time for Backtest must be inserted in the settings panel.
____ As long as the starting time has available price data, the Smart Moving Averages will NOT get repainted.
____ A suggested starting date for the analysis is shown on the chart. Insert the date in the indicator settings.
This indicator is compatible with the Wrapper Module of the Risk Management System indicator, which means they can work together as a trading bot.
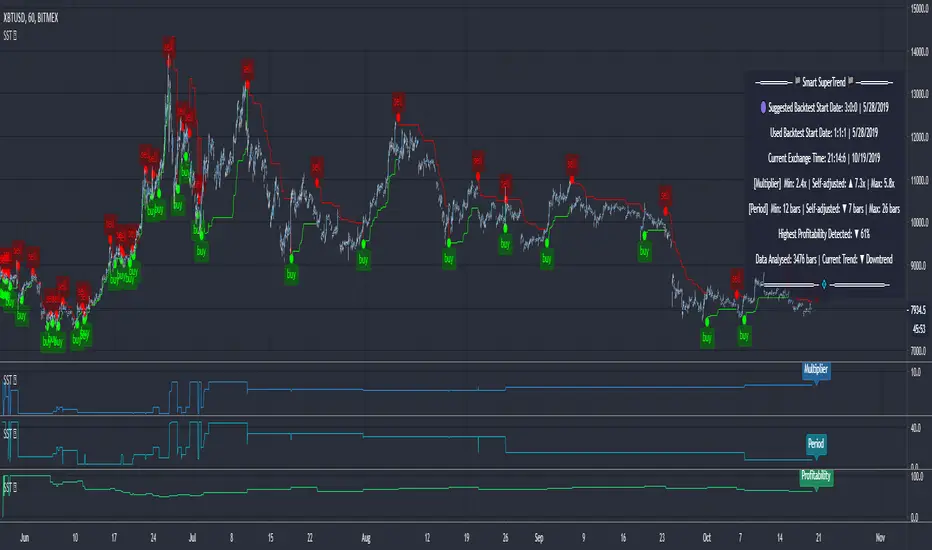
SuperTrend (Self-Adjusting Parameters for Highest Profitability)SuperTrend (Self-Adjusting Parameters for Highest Profitability)
The SuperTrend is a trend-following indicator.
It works best when it is used along with other indicators.
It performs well in trending markets and can give false signals in volatile markets.
It becomes Smart when its Multiplier and Period parameters are automatically detected .
• Self-Adjusting Multiplier and Period parameters
• The graphs for Profitability, SuperTrend Multiplier, SuperTrend Period and the SuperTrend itself are available to choose for display from the indicator settings
• A chart layout can be made just for the Smart SuperTrend, having all the graphs nicely displayed
• Alerts for changes in Trend, Multiplier, Period, Profitability
The range for Multiplier, Period and Time can be changed in the indicator settings.
This affects the loading speed (smaller range, faster to load), as well as the accuracy of the signals.
The indicator switches to the most profitable Multiplier and Period parameters automatically, in real-time .
It scans across the entire historical data made available by TradingView.
The Smart SuperTrend works on all timeframes and symbols available on TradingView.
It does not repaint!
But several aspects must be considered:
- 1. TradingView periodically removes access to old data while giving access to new data in real-time.
____ The frequency depends on the timeframe, amount of data. It can happen daily for second charts, weekly for minute charts.
____ Since the Indicator wouldn't have access to that old data anymore, the Profitability may change its value, causing a certain degree of repainting.
- 2. The starting time for Backtest must be inserted in the settings panel.
____ As long as that starting time has available price data, the SuperTrend will NOT get repainted.
____ A suggested starting date for the analysis is shown on the chart. Insert the date in the indicator settings.
This indicator is compatible with the Wrapper Module of the Risk Management System indicator, which means they can work together as a trading bot .
Smart Labelling - Candlestick ChartingThis is a full-fledged implementation of a system presented in an unique research paper 'Profitability of Candlestick Charting Patterns in the Stock Exchange of Thailand' (2017) on candlestick charting, candlestick patterns, trend identification methods, and testing.
You can easily find this paper in the Web. For example, visit: www.researchgate.net
This script is best suited for middle-to-higher time frames. Possible future developments: trend identification and factor calculation techniques.
Donate: PayPal (paypal.me)

Smart Labelling - Range FilterThis is a labelling module based on a range filter . Notice that the trick here is to use fibonachi numbers . Use smaller range multiplier for higher TFs. This module may serve as a signal generator to be passed through a signal filter.
Quote from the original author:
This is an experimental study designed to filter out minor price action for a clearer view of trends. Inspired by the QQE's volatility filter, this filter applies the process directly to price rather than to a smoothed RSI. First, a smooth average price range is calculated for the basis of the filter and multiplied by a specified amount. Next, the filter is calculated by gating price movements that do not exceed the specified range. Lastly the target ranges are plotted to display the prices that will trigger filter movement.

Smart labelling - Candlestick FunctionOftentimes a single look at the candlestick configuration happens to be enough to understand what is going on. The chandlestick function is an experiment in smart labelling that produces candles for various time frames, not only for the fixed 1m, 3m , 5m, 15m, etc. ones, and helps in decision-making when eye-balling the chart. This function generates up to 12 last candlesticks , which is generally more than enough.
Mind that since this is an experiment, the function does not cover all possible combinations. In some time frames the produced candles overlap. This is a todo item for those who are unterested. For instance, the current version covers the following TFs:
Chart - TF in the script
1m - 1-20,24,30,32
3m - 1-10
5m - 1-4,6,9,12,18,36
15m - 1-4,6,12
Tested chart TFs: 1m, 3m ,5m,15m. Tested securities: BTCUSD , EURUSD

Smart Money Index (50)Added MA50 to help interpret Smart Money Flow Index. Original SMI script by HPotter, idea of MA50 gotten from Troy Bombardia.

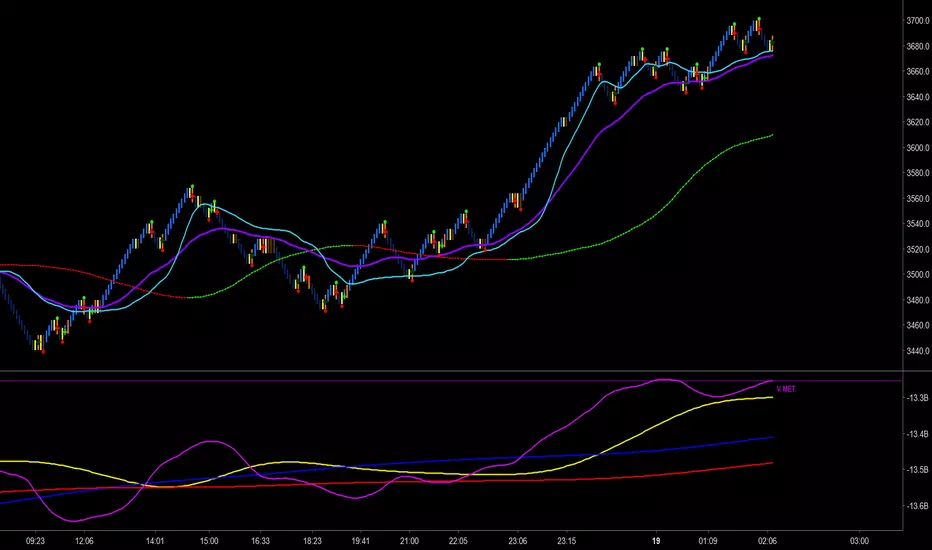
Trader Set - Volume MetricThe last tool in my methodology set, another one of those tools that has unique unpublished formulas, this one purely for following volume and reading smart money's hand, YES it's possible. This indicator has few Alerts built in that you can use, will update the rest of the scripts for additional alerts. You can easily set the alert to play a sound that is not disturbing in long run and check mark open ending and have easy time being alerted when some crossings are happening.
Please, don't ask for access, only my students from my classes will have access to this indicator. The English version of the website and learning material is under development and the moment they get ready I will announce it under each related script.
Smart Money Trend- Plot a series of Smart Money Trend Lines to indicate Different Periods of Support & Resistance:]
Red : Very Short Term Trend
Lime : Short Term Trend (Swing Life Line)
Blue : Mid Term Trend
Black : Long Term Trend (Bull Bear Life Line)
- Plot a series of Smart Money Signal to indicate Buying/Holding/Selling Alerts:
Bottom Arrow Up : Temporary oversold
Bottom Stars : Buy Signal
Top Blue Cross/Diamond : Hold Signal (Trigger Sell Signal when signal disappeared)
Top Red Cross : Sell Signal

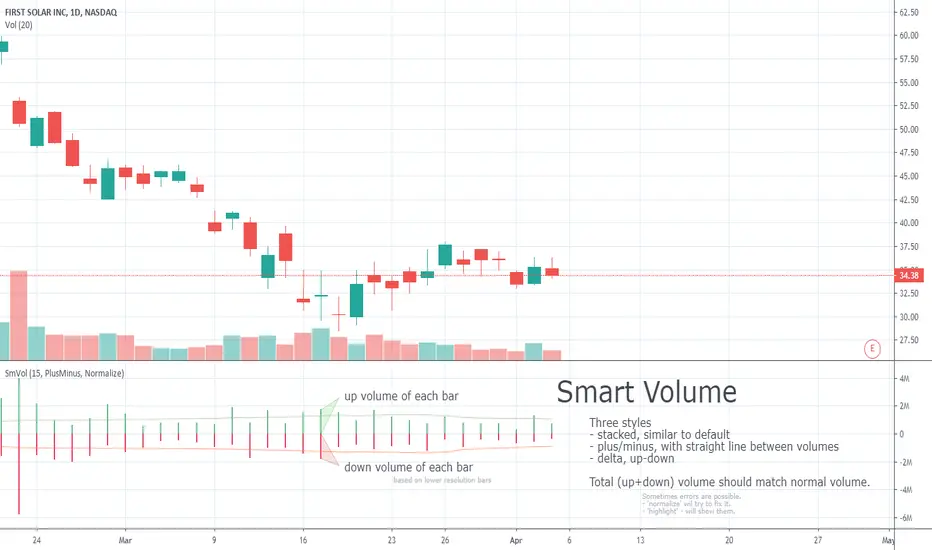
Smart VolumeOut of beta!
This script distinguishes up/down volume based on lower resolution.
It's important to set correct input "Detailed Resolution" — it affects detalization/loading speed. If equal to chart resolution, should match builtin "volume". The lower it is, the more detalized up/down border.
Smart Volume (beta)This script distinguishes up/down volume based on lower resolution.
It's important to set correct inputs. Second - affects detalisation/loading speed. Third one needs to be set according to your chart resolution. 1440 for 'D', 30 for '30'.

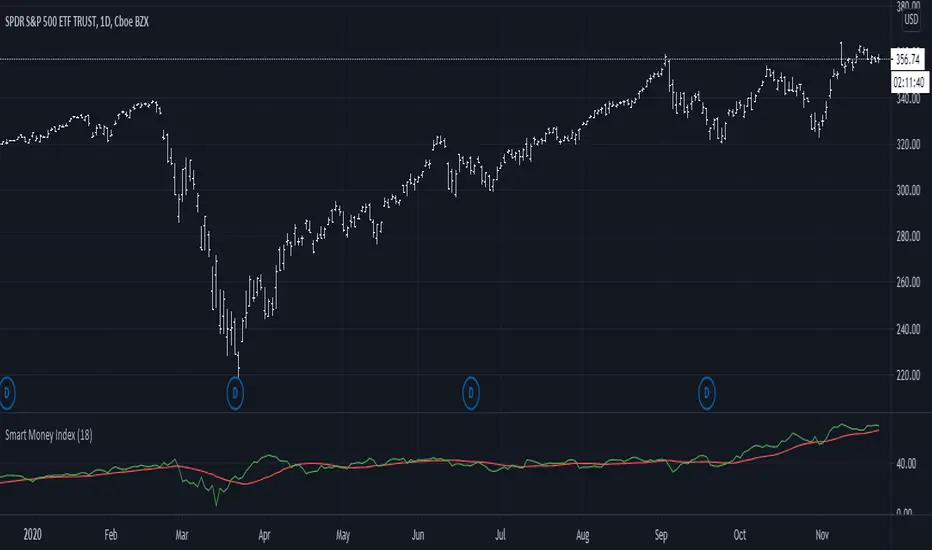
Smart Money Index (SMI)Smart money index (SMI) or smart money flow index is a technical analysis indicator demonstrating investors sentiment.
The index was invented and popularized by money manager Don Hays. The indicator is based on intra-day price patterns.
The main idea is that the majority of traders (emotional, news-driven) overreact at the beginning of the trading day
because of the overnight news and economic data. There is also a lot of buying on market orders and short covering at the opening.
Smart, experienced investors start trading closer to the end of the day having the opportunity to evaluate market performance.
Therefore, the basic strategy is to bet against the morning price trend and bet with the evening price trend. The SMI may be calculated
for many markets and market indices (S&P 500, DJIA, etc.)
The SMI sends no clear signal whether the market is bullish or bearish. There are also no fixed absolute or relative readings signaling
about the trend. Traders need to look at the SMI dynamics relative to that of the market. If, for example, SMI rises sharply when the
market falls, this fact would mean that smart money is buying, and the market is to revert to an uptrend soon. The opposite situation
is also true. A rapidly falling SMI during a bullish market means that smart money is selling and that market is to revert to a downtrend
soon. The SMI is, therefore, a trend-based indicator.
Some analysts use the smart money index to claim that precious metals such as gold will continually maintain value in the future.
